Home > Analyses > Consumer Cyclical > Marriott International, Inc.
Marriott International shapes global travel by delivering unparalleled hospitality experiences across nearly 8,000 properties. Its diverse portfolio spans luxury icons like Ritz-Carlton and St. Regis to trusted brands such as Courtyard and Residence Inn. Renowned for innovation and consistent quality, Marriott commands a significant market presence. As the travel sector evolves, I examine whether Marriott’s solid fundamentals justify its premium valuation and growth outlook in 2026.

Table of contents
Business Model & Company Overview
Marriott International, Inc., founded in 1927 and headquartered in Bethesda, MD, stands as a global leader in the travel lodging industry. It operates nearly 8,000 properties across 30 hotel brands, forming an integrated ecosystem that spans luxury to select-service accommodations. This breadth delivers diverse experiences under iconic names like JW Marriott, Ritz-Carlton, and Sheraton, positioning the company as a dominant hospitality powerhouse.
The company’s revenue engine blends franchising, management fees, and direct operations, balancing asset-light growth with recurring income streams. Marriott’s footprint spans the Americas, Europe, and Asia, capturing demand from leisure and business travelers worldwide. Its expansive brand portfolio, combined with global scale, creates a robust economic moat, shaping the future of hospitality through unparalleled market reach and operational expertise.
Financial Performance & Fundamental Metrics
I will analyze Marriott International’s income statement, key financial ratios, and dividend payout policy to assess its core financial health and shareholder returns.
Income Statement
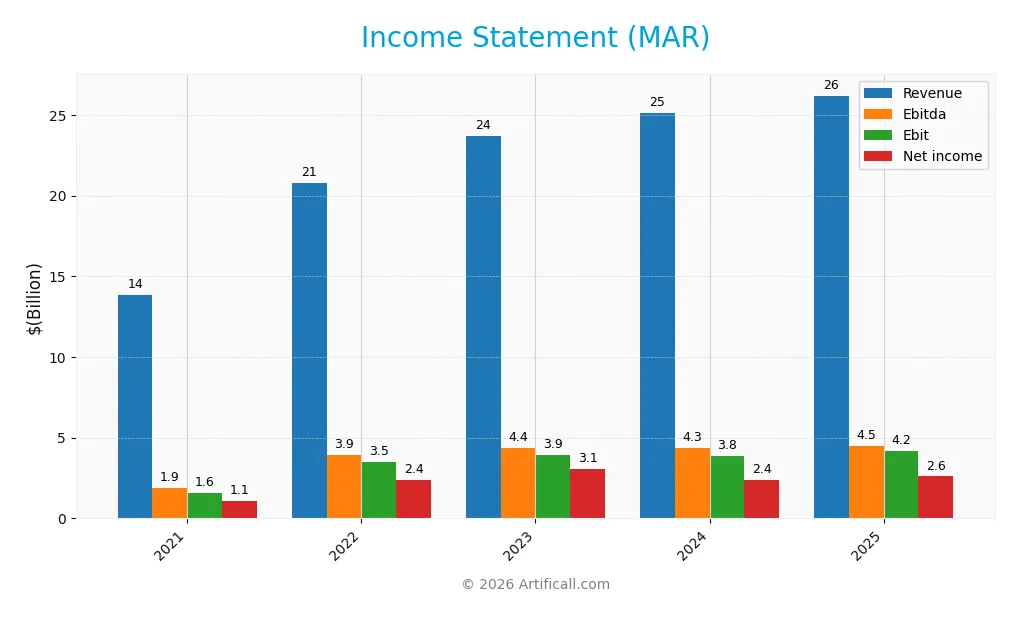
The following table summarizes Marriott International’s key income statement figures over the past five fiscal years, reflecting its revenue growth and profitability trends.
| 2021 | 2022 | 2023 | 2024 | 2025 | |
|---|---|---|---|---|---|
| Revenue | 13.9B | 20.8B | 23.7B | 25.1B | 26.2B |
| Cost of Revenue | 11.1B | 16.2B | 18.6B | 20.0B | 20.6B |
| Operating Expenses | 1.05B | 1.10B | 1.26B | 1.33B | 1.45B |
| Gross Profit | 2.80B | 4.56B | 5.12B | 5.10B | 5.59B |
| EBITDA | 1.90B | 3.92B | 4.38B | 4.34B | 4.49B |
| EBIT | 1.60B | 3.52B | 3.94B | 3.85B | 4.19B |
| Interest Expense | 420M | 403M | 565M | 695M | 809M |
| Net Income | 1.10B | 2.36B | 3.08B | 2.38B | 2.60B |
| EPS | 3.36 | 7.27 | 10.23 | 8.36 | 9.52 |
| Filing Date | 2022-02-15 | 2023-02-14 | 2024-02-13 | 2025-02-11 | 2026-02-10 |
Income Statement Evolution
Marriott International’s revenue grew steadily from 13.9B in 2021 to 26.2B in 2025, nearly doubling in five years. Net income followed this trend, rising from 1.1B to 2.6B, with net margins improving by over 25%. Gross and EBIT margins remained favorable, reflecting disciplined cost control despite expanding operating expenses.
Is the Income Statement Favorable?
The 2025 income statement shows solid fundamentals, with a 4.3% revenue increase and nearly 9% EBIT growth year-over-year. Gross margin stands at 21.3%, supporting an EBIT margin of 16.0%. Interest expenses remain manageable at 3.1% of revenue. Net margin growth is moderate but positive, confirming an overall favorable income profile.
Financial Ratios
The following table presents key financial ratios for Marriott International, Inc. over the past five fiscal years, providing a snapshot of profitability, liquidity, leverage, and market valuation:
| Ratios | 2021 | 2022 | 2023 | 2024 | 2025 |
|---|---|---|---|---|---|
| Net Margin | 7.9% | 11.4% | 13.0% | 9.5% | 9.9% |
| ROE | 0.78 | 4.15 | -4.52 | -0.79 | -0.80 |
| ROIC | 8.2% | 14.4% | 19.1% | 15.1% | 22.8% |
| P/E | 49.2 | 20.5 | 22.1 | 33.4 | 32.0 |
| P/B | 38.2 | 85.0 | -99.7 | -26.5 | -25.7 |
| Current Ratio | 0.57 | 0.45 | 0.43 | 0.40 | 0.80 |
| Quick Ratio | 0.57 | 0.45 | 0.43 | 0.40 | 0.80 |
| D/E | 7.95 | 19.5 | -18.7 | -5.09 | -5.27 |
| Debt-to-Assets | 44% | 45% | 50% | 58% | 107% |
| Interest Coverage | 4.2 | 8.6 | 6.8 | 5.4 | 5.1 |
| Asset Turnover | 0.54 | 0.84 | 0.92 | 0.96 | 1.64 |
| Fixed Asset Turnover | 5.4 | 8.1 | 9.4 | 9.4 | 9.0 |
| Dividend Yield | 0.0% | 0.7% | 0.9% | 0.9% | 0.9% |
Evolution of Financial Ratios
Return on Equity (ROE) declined sharply to -80.3% in 2025, signaling deteriorating shareholder returns. The Current Ratio improved but remains below 1 at 0.8, indicating ongoing liquidity constraints. Debt-to-Equity Ratio stayed negative at -5.27, reflecting complex capital structure dynamics. Profitability margins showed minor fluctuations but remained broadly stable.
Are the Financial Ratios Favorable?
Profitability is mixed with a neutral net margin of 9.93% but unfavorable ROE. Liquidity ratios, including the current and quick ratios at 0.8, are unfavorable, suggesting limited short-term asset coverage. Efficiency measures like asset turnover (1.64) and fixed asset turnover (9.05) are favorable. Leverage appears high with a debt-to-assets ratio of 107.19%, yet interest coverage (5.18) is comfortable. Overall, the ratios present a neutral financial profile.
Shareholder Return Policy
Marriott International, Inc. maintains a consistent dividend payout ratio around 27%, with dividends per share rising from $1.95 in 2023 to $2.67 in 2025. The annual dividend yield hovers near 0.86%, supported by free cash flow coverage and occasional share buybacks.
This balanced approach appears sustainable, as dividend payments remain well-covered by cash flow generation. The company’s prudent capital allocation, combining moderate dividends and buybacks, supports long-term shareholder value without overextending financial resources.
Score analysis
The following radar chart presents Marriott International’s key financial scores for a comprehensive overview:
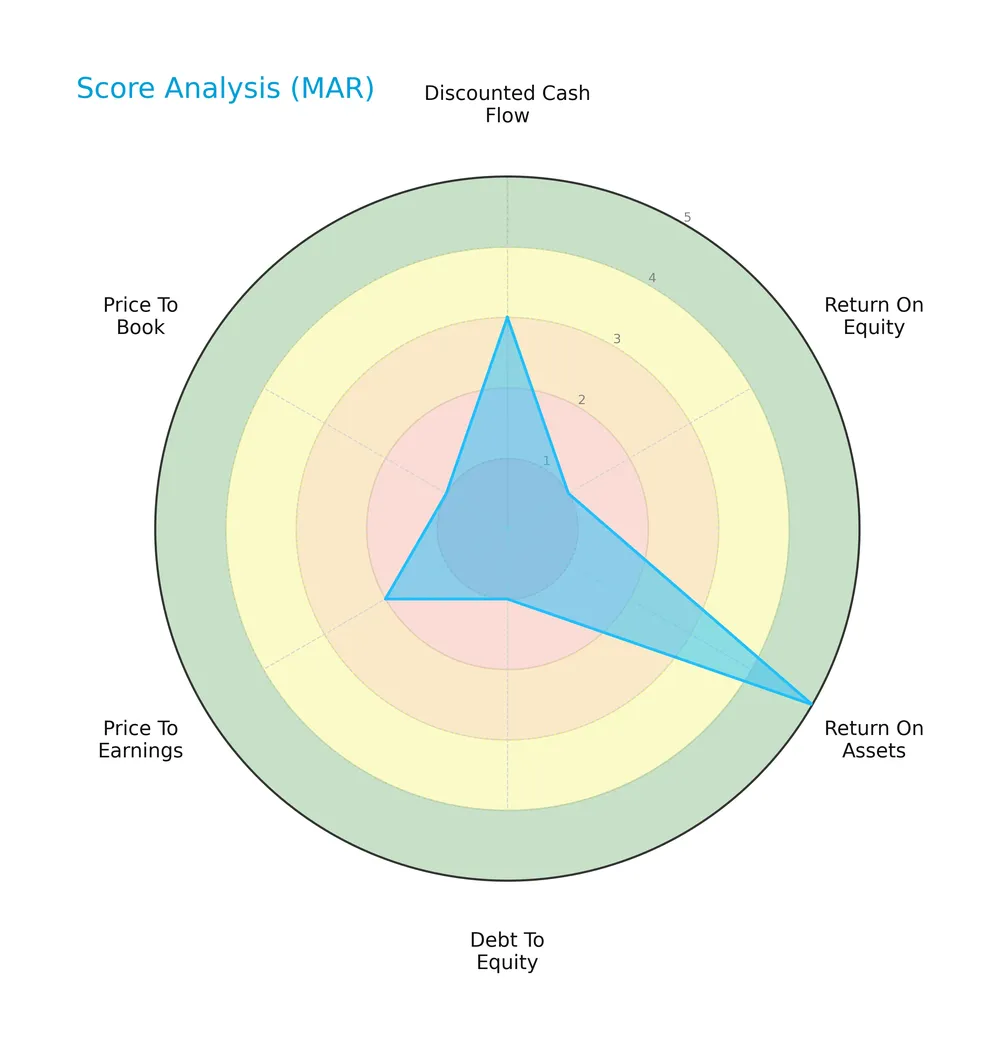
Marriott shows a moderate discounted cash flow score of 3 but struggles with a very unfavorable return on equity and debt-to-equity scores at 1. Return on assets stands out as very favorable at 5, while price-to-earnings and price-to-book ratios remain unfavorable.
Analysis of the company’s bankruptcy risk
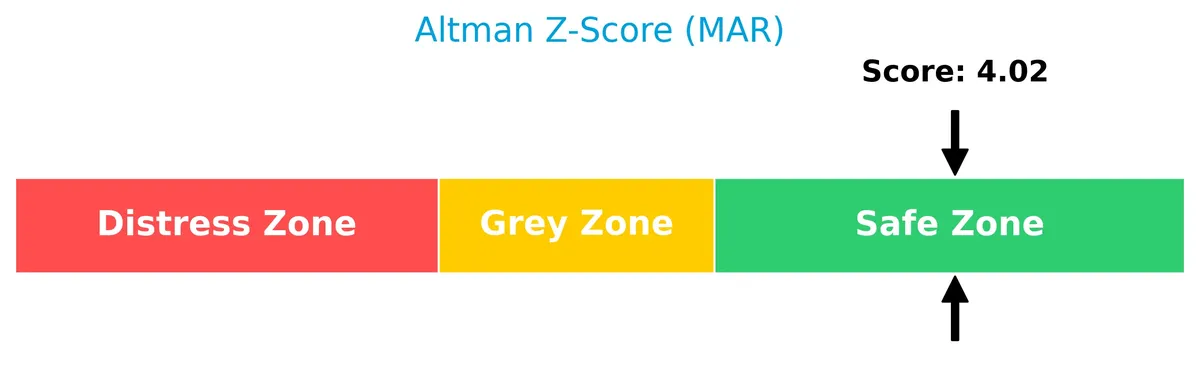
Marriott’s Altman Z-Score places it firmly in the safe zone, indicating low bankruptcy risk and financial stability:
Is the company in good financial health?
This Piotroski diagram illustrates Marriott’s financial health based on a mid-range score:

With a Piotroski Score of 5, Marriott’s financial condition is average. This score reflects moderate strength but leaves room for improvement in profitability and efficiency metrics.
Competitive Landscape & Sector Positioning
This section examines Marriott International’s strategic positioning, revenue streams, key products, and main competitors. I will evaluate whether Marriott holds a competitive advantage in the travel lodging sector.
Strategic Positioning
Marriott operates a diversified portfolio with nearly 8K properties under 30 brands, spanning luxury to economy segments. Its geographic exposure is global, with a strong U.S. and Canada focus generating double the revenue of international markets, reflecting balanced regional reach and product breadth.
Revenue by Segment
This pie chart illustrates Marriott International’s revenue distribution by product segments for the fiscal year 2025, highlighting the company’s multi-faceted business model.
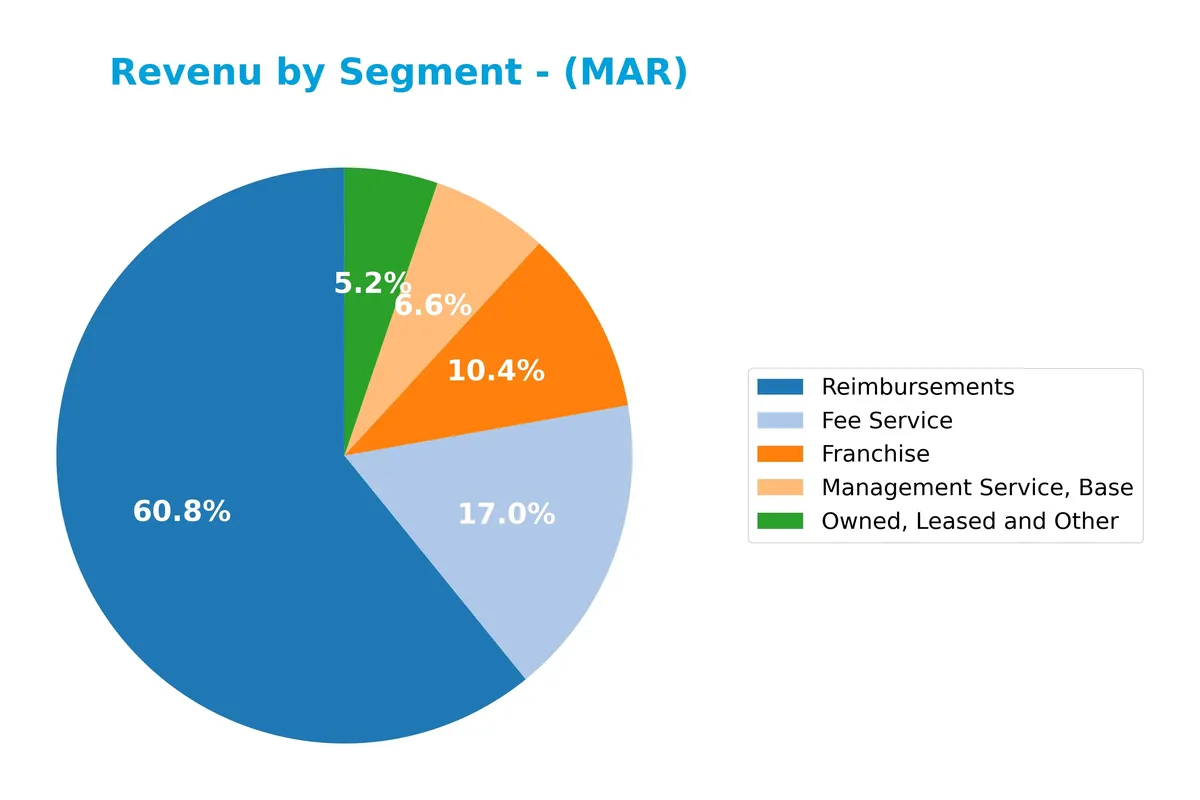
In 2025, Reimbursements dominate with $19.5B, reflecting the scale of cost pass-throughs in managed properties. Fee Service at $5.4B and Franchise revenues at $3.3B drive high-margin income streams, showing steady growth from 2024. Owned, Leased and Other segments contribute $1.7B, indicating cautious capital allocation away from asset-heavy operations. Management Service, Base at $2.1B supports recurring revenue. The mix signals Marriott’s strategic pivot towards asset-light models, balancing growth and risk.
Key Products & Brands
Marriott International operates a diverse portfolio of hotel brands and service segments as follows:
| Product | Description |
|---|---|
| JW Marriott | Luxury hotel brand offering upscale accommodations and services globally. |
| The Ritz-Carlton | Prestigious luxury hotel chain known for high-end customer experiences. |
| W Hotels | Lifestyle luxury brand with a focus on modern design and vibrant social scenes. |
| Marriott Hotels | Full-service hotel brand catering to business and leisure travelers. |
| Sheraton | One of the largest hotel brands with full-service properties worldwide. |
| Westin | Upscale brand emphasizing wellness and comfort for travelers. |
| Courtyard | Mid-priced hotels focused on business travelers with efficient services. |
| Residence Inn | Extended-stay hotels designed for longer visits with residential amenities. |
| Fairfield by Marriott | Economy brand offering reliable, value-focused accommodations. |
| Marriott Vacation Club | Timeshare properties offering vacation ownership opportunities. |
| Franchise & Management Services | Revenue streams from franchising, base management fees, and fee services across global properties. |
Marriott International’s product portfolio spans luxury to economy segments, supported by diverse revenue streams including franchising, management fees, and owned properties. Its 30 brands serve multiple customer segments worldwide.
Main Competitors
There are 2 competitors in total, with the table below listing the top 10 leaders by market capitalization:
| Competitor | Market Cap. |
|---|---|
| Marriott International, Inc. | 84.1B |
| Hilton Worldwide Holdings Inc. | 68.1B |
Marriott International ranks 1st among its competitors, with a market cap 15% above the sector leader benchmark. It stands above both the average and median market caps in its sector. The company leads Hilton Worldwide by a significant 41.6% margin, highlighting a strong market position.
Comparisons with competitors
Check out how we compare the company to its competitors:
Does Marriott have a competitive advantage?
Marriott International demonstrates a clear competitive advantage with a very favorable moat. Its return on invested capital (ROIC) exceeds its weighted average cost of capital (WACC) by over 14%, signaling strong value creation and efficient capital use.
Looking ahead, Marriott’s extensive portfolio of nearly 8,000 properties across 30 brands in 139 countries underpins growth opportunities. The company’s expanding international segment and diversified brand strategy position it well to capture new markets and evolving travel trends.
SWOT Analysis
This analysis highlights Marriott International’s core strengths, weaknesses, opportunities, and threats to guide strategic decision-making.
Strengths
- extensive global brand portfolio
- robust ROIC at 22.8%, well above WACC
- strong revenue growth of 89% over 5 years
Weaknesses
- low current and quick ratios at 0.8 signal liquidity risk
- unfavorable debt-to-assets ratio above 100%
- weak ROE at -80.3% raises profitability concerns
Opportunities
- expanding international footprint
- rising global travel demand post-pandemic
- leveraging technology for customer experience
Threats
- exposure to economic cycles impacting travel
- rising interest rates increasing debt costs
- intense competition in luxury and midscale segments
Marriott’s durable competitive advantage and improving profitability position it well for growth. However, liquidity and leverage risks require careful capital management to sustain long-term value creation.
Stock Price Action Analysis
The weekly stock chart of Marriott International, Inc. (MAR) highlights significant price movements and trend shifts over the past 100 weeks:
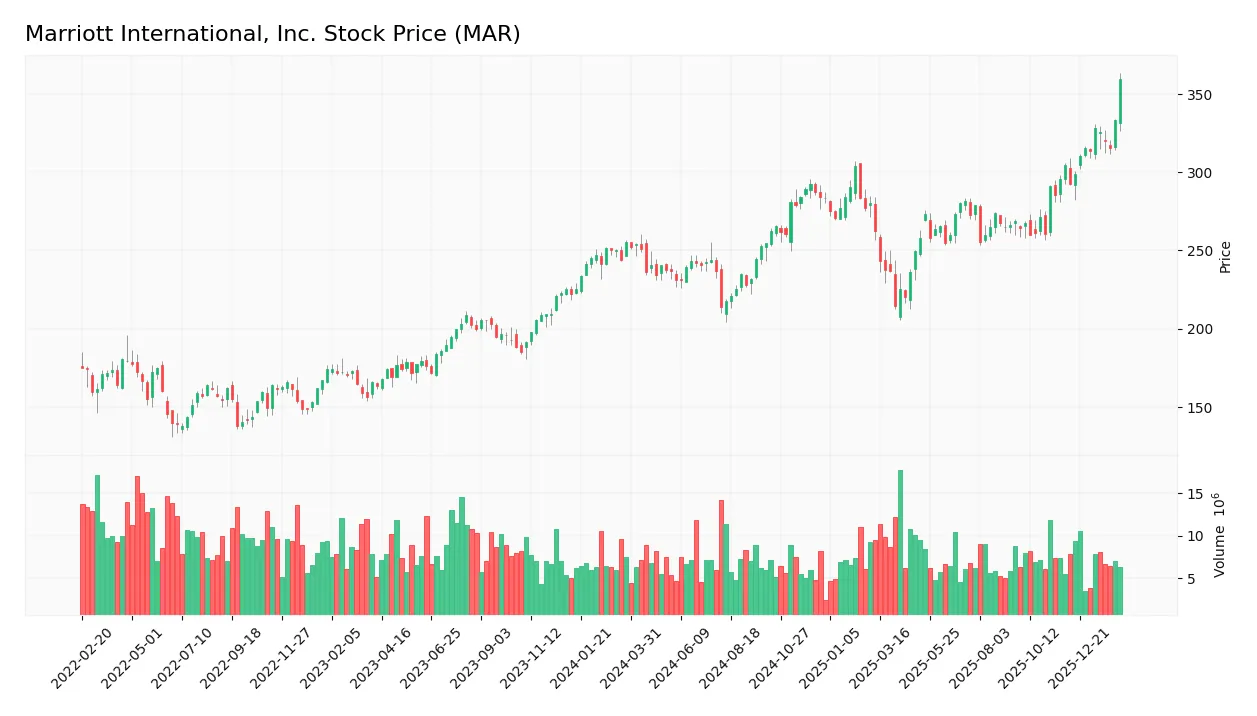
Trend Analysis
Over the past 100 weeks, MAR’s stock price rose 40.83%, indicating a strong bullish trend with acceleration. The price ranged between 213.67 and 359.35, with a high volatility level implied by a 28.41 standard deviation. Recent weeks show a 17.9% gain, confirming sustained upward momentum.
Volume Analysis
Trading volume over the last three months shows a clear buyer dominance with 60.38% buyer volume. Total volume is increasing, reflecting growing market participation and positive investor sentiment favoring MAR’s shares. Seller activity remains notably lower, reinforcing the buyer-driven trend.
Target Prices
Analysts project a solid upside for Marriott International, reflecting confidence in its growth prospects.
| Target Low | Target High | Consensus |
|---|---|---|
| 283 | 370 | 334.38 |
The target range signals optimistic expectations, with the consensus price suggesting a notable premium over current levels.

Don’t Let Luck Decide Your Entry Point
Optimize your entry points with our advanced ProRealTime indicators. You’ll get efficient buy signals with precise price targets for maximum performance. Start outperforming now!
Analyst & Consumer Opinions
This section examines analyst ratings and consumer feedback to provide a comprehensive view of Marriott International, Inc.’s market perception.
Stock Grades
Here are the latest verified analyst grades for Marriott International, Inc., reflecting diverse market perspectives:
| Grading Company | Action | New Grade | Date |
|---|---|---|---|
| JP Morgan | Maintain | Neutral | 2026-02-03 |
| Evercore ISI Group | Maintain | Outperform | 2026-01-22 |
| Morgan Stanley | Maintain | Overweight | 2026-01-16 |
| Barclays | Maintain | Equal Weight | 2026-01-16 |
| Citigroup | Maintain | Neutral | 2026-01-15 |
| BMO Capital | Upgrade | Outperform | 2026-01-09 |
| Bernstein | Maintain | Outperform | 2026-01-06 |
| Barclays | Maintain | Equal Weight | 2025-12-17 |
| Goldman Sachs | Upgrade | Buy | 2025-12-15 |
| Truist Securities | Maintain | Hold | 2025-12-04 |
Grades show a stable consensus leaning toward neutral to outperform, with few upgrades signaling cautious optimism. The mix of Hold, Neutral, and Outperform ratings indicates balanced analyst sentiment without strong conviction shifts.
Consumer Opinions
Marriott International continues to evoke strong sentiments among travelers, balancing praise for its service with critiques on pricing.
| Positive Reviews | Negative Reviews |
|---|---|
| Exceptional customer service quality | Room rates have increased sharply |
| Consistently clean and comfortable rooms | Loyalty program changes confusing |
| Convenient locations worldwide | Occasional delays in check-in |
Overall, consumers appreciate Marriott’s reliable service and global presence. However, rising prices and loyalty program adjustments generate dissatisfaction, suggesting caution for budget-conscious travelers.
Risk Analysis
Below is a summary of key risks facing Marriott International, highlighting their likelihood and potential impact:
| Category | Description | Probability | Impact |
|---|---|---|---|
| Financial Leverage | Debt-to-assets ratio exceeds 107%, indicating high leverage | High | High |
| Liquidity | Current and quick ratios at 0.8 signal weak short-term liquidity | High | Medium |
| Profitability | Negative return on equity (-80.3%) points to poor shareholder returns | Medium | High |
| Valuation | Elevated P/E ratio of 32 suggests potential overvaluation | Medium | Medium |
| Dividend Yield | Low yield at 0.86% may limit income appeal for investors | Low | Low |
| Operational Risk | Exposure to global travel cycles and geopolitical events | Medium | High |
Marriott’s greatest vulnerabilities stem from excessive leverage and weak liquidity, raising solvency concerns despite a healthy Altman Z-Score in the safe zone. Negative ROE warns of inefficient capital use. The travel sector’s cyclical nature demands cautious monitoring of global disruptions.
Should You Buy Marriott International, Inc.?
Marriott International appears to be in a very favorable competitive position with a durable moat supported by a growing ROIC exceeding WACC. While profitability shows operational efficiency, the leverage profile and equity returns suggest caution. The overall rating stands at C+, reflecting a mixed financial health profile.
Strength & Efficiency Pillars
Marriott International, Inc. demonstrates solid operational efficiency, marked by a net margin of 9.93% and a robust ROIC of 22.79%. With a WACC of 8.15%, the company clearly creates value, sustaining a competitive advantage. Despite a challenging ROE of -80.3%, Marriott’s asset turnover (1.64) and fixed asset turnover (9.05) underpin its operational strength. Profitability trends and growing ROIC confirm Marriott’s solid foothold in the hospitality sector.
Weaknesses and Drawbacks
Marriott’s valuation and liquidity present notable risks. The price-to-earnings ratio stands at 32.03, indicating a premium valuation that may pressure future returns. The current ratio of 0.8 signals potential short-term liquidity constraints, raising caution about its ability to cover immediate liabilities. Negative price-to-book and debt-to-equity ratios, while favorable in status, reflect complex capital structure nuances requiring close scrutiny. Dividends yield is modest at 0.86%, limiting income appeal.
Our Final Verdict about Marriott International, Inc.
Marriott’s fundamentals appear attractive for long-term exposure, supported by strong value creation and a bullish overall trend. The recent period is buyer-dominant, enhancing near-term momentum and suggesting potential for continued upside. However, premium valuation and liquidity weaknesses may warrant a cautious entry. Investors might consider waiting for more favorable conditions or portfolio diversification to mitigate these risks.
Disclaimer: This content is for informational purposes only and does not constitute financial, investment, or other professional advice. Investing in financial markets involves a significant risk of loss, and past performance is not indicative of future results.
Additional Resources
- Marriott International Inc (MAR) Q4 2025 Earnings Call Highlights: Strong Fee Revenue Growth and Record Pipeline – GuruFocus (Feb 10, 2026)
- Marriott International, Inc. $MAR Shares Sold by ProShare Advisors LLC – MarketBeat (Feb 10, 2026)
- Marriott Q4 Earnings Lag Estimates, Revenues Top, RevPAR Rises Y/Y – TradingView (Feb 10, 2026)
- Marriott shares jump on strong 2025 revenue, international travel boost – Proactive financial news (Feb 10, 2026)
- Marriott sets full-year profit guidance ahead of expectations (MAR:NASDAQ) – Seeking Alpha (Feb 10, 2026)
For more information about Marriott International, Inc., please visit the official website: marriott.com