Home > Analyses > Energy > Marathon Petroleum Corporation
Marathon Petroleum powers millions of vehicles daily, fueling commerce and mobility across the United States. As a dominant force in oil refining and midstream logistics, it operates some of the nation’s most strategic refineries and an extensive distribution network. Known for its ARCO and Marathon brands, the company combines scale with innovation in fuel production and delivery. The critical question now is whether Marathon’s solid fundamentals can sustain growth amid evolving energy markets and regulatory pressures.

Table of contents
Business Model & Company Overview
Marathon Petroleum Corporation, founded in 1887 and headquartered in Findlay, Ohio, stands as a dominant force in the Oil & Gas Refining & Marketing sector. It operates an integrated ecosystem combining refining, marketing, and midstream logistics. The company’s core mission unites refining crude oil into fuels and specialty products with marketing through established brands like Marathon and ARCO, creating a seamless energy value chain across the U.S. and Mexico.
Its revenue engine balances refining operations with midstream assets, including pipelines, terminals, and natural gas processing. This mix drives steady cash flow from both product sales and transportation fees. Marathon’s strategic footprint spans the Gulf Coast, Mid-Continent, and West Coast, ensuring market reach and resilience. The company’s economic moat lies in its extensive refining capacity coupled with a robust distribution network, shaping the future of downstream energy infrastructure.
Financial Performance & Fundamental Metrics
I will analyze Marathon Petroleum Corporation’s income statement, key financial ratios, and dividend payout policy to assess its core financial health and shareholder value.
Income Statement
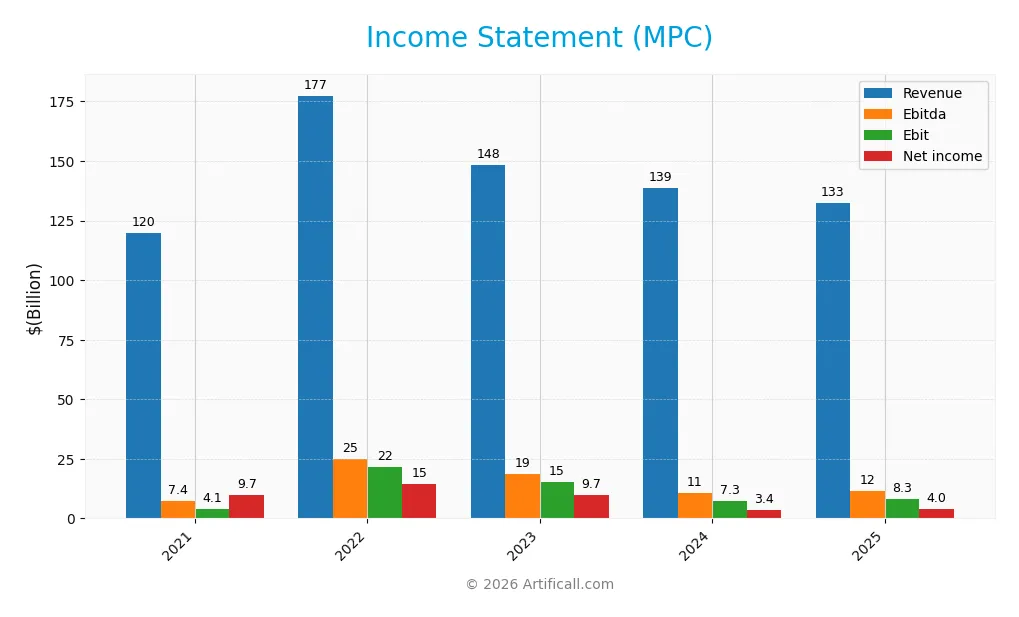
The table below summarizes Marathon Petroleum Corporation’s key income statement metrics for fiscal years 2021 through 2025, reflecting revenue, profitability, and earnings per share trends.
| 2021 | 2022 | 2023 | 2024 | 2025 | |
|---|---|---|---|---|---|
| Revenue | 120B | 177.5B | 148.4B | 138.9B | 132.5B |
| Cost of Revenue | 113.4B | 154.9B | 131.9B | 129.6B | 122.7B |
| Operating Expenses | 2.3B | 1.1B | 3.9B | 4.0B | 3.3B |
| Gross Profit | 6.6B | 22.6B | 16.5B | 9.3B | 9.8B |
| EBITDA | 7.4B | 24.9B | 18.6B | 10.6B | 11.5B |
| EBIT | 4.1B | 21.7B | 15.3B | 7.3B | 8.3B |
| Interest Expense | 1.3B | 1.2B | 1.3B | 1.3B | 1.3B |
| Net Income | 9.7B | 14.5B | 9.7B | 3.4B | 4.0B |
| EPS | 2.71 | 28.34 | 23.76 | 10.12 | 13.27 |
| Filing Date | 2022-02-24 | 2023-02-23 | 2024-02-28 | 2025-02-27 | 2026-02-26 |
Income Statement Evolution
Marathon Petroleum’s revenue decreased by 4.55% in 2025, reversing prior growth trends. Despite this, gross profit rose 6.01%, reflecting improved cost management. Operating expenses declined alongside revenue, supporting a 14.12% jump in EBIT. Net income fell sharply over the five-year span, causing net margin contraction, though recent margin improvements are evident.
Is the Income Statement Favorable?
In 2025, MPC’s fundamentals show mixed signals. The net margin at 3.05% remains neutral but grew 23.08% year-over-year, supported by a 31.52% EPS increase. Interest expense is well-controlled at under 1% of revenue, a favorable sign. Overall, 57% of income metrics rate favorable, indicating an improving profitability profile amid revenue headwinds.
Financial Ratios
The table below summarizes key financial ratios for Marathon Petroleum Corporation (MPC) over the last five fiscal years, providing a clear view of its financial health and valuation metrics:
| Ratios | 2021 | 2022 | 2023 | 2024 | 2025 |
|---|---|---|---|---|---|
| Net Margin | 8.1% | 8.2% | 6.5% | 2.5% | 3.1% |
| ROE | 37.2% | 52.4% | 39.7% | 19.4% | 23.4% |
| ROIC | 5.7% | 23.5% | 14.7% | 7.3% | 8.1% |
| P/E | 4.2 | 4.1 | 6.2 | 13.8 | 12.3 |
| P/B | 1.5 | 2.2 | 2.5 | 2.7 | 2.9 |
| Current Ratio | 1.7 | 1.8 | 1.6 | 1.2 | 1.3 |
| Quick Ratio | 1.3 | 1.3 | 1.1 | 0.7 | 0.7 |
| D/E | 1.0 | 1.0 | 1.2 | 1.6 | 2.0 |
| Debt-to-Assets | 31.5% | 31.0% | 33.1% | 36.5% | 40.9% |
| Interest Coverage | 3.3 | 17.7 | 9.9 | 3.9 | 5.1 |
| Asset Turnover | 1.4 | 2.0 | 1.7 | 1.8 | 1.6 |
| Fixed Asset Turnover | 3.1 | 4.8 | 4.1 | 3.8 | 3.4 |
| Dividend Yield | 3.7% | 2.1% | 2.1% | 2.4% | 2.3% |
Evolution of Financial Ratios
Marathon Petroleum Corporation’s Return on Equity (ROE) rose steadily, reaching 23.37% in 2025, reflecting improved profitability. The Current Ratio showed moderate stability around 1.2–1.3, indicating consistent liquidity. However, the Debt-to-Equity Ratio increased to 1.98, suggesting a higher leverage trend over the period, which may raise financial risk concerns.
Are the Financial Ratios Favorable?
In 2025, MPC displays a mixed ratio profile. Profitability is robust with a favorable ROE and interest coverage ratio of 6.5, but the net profit margin at 3.05% is weak. Liquidity ratios are neutral to unfavorable, with a current ratio of 1.26 and quick ratio below 1. Leverage remains high, with a 1.98 debt-to-equity ratio. Asset efficiency is strong, and dividend yield of 2.29% supports shareholder returns. Overall, ratios are slightly favorable.
Shareholder Return Policy
Marathon Petroleum Corporation maintains a consistent dividend policy, with a payout ratio near 28% in 2025 and a dividend yield around 2.3%. The dividend per share has steadily increased from $2.34 in 2021 to $3.73 in 2025, supported by free cash flow coverage and supplemented by share buybacks.
This disciplined approach balances shareholder returns with reinvestment needs, as dividend and capital expenditures remain well-covered. The policy supports sustainable long-term value creation, though leverage ratios warrant monitoring to avoid risks from excessive debt or repurchases.
Score analysis
The following radar chart illustrates Marathon Petroleum Corporation’s key financial scores across valuation, profitability, and leverage metrics:
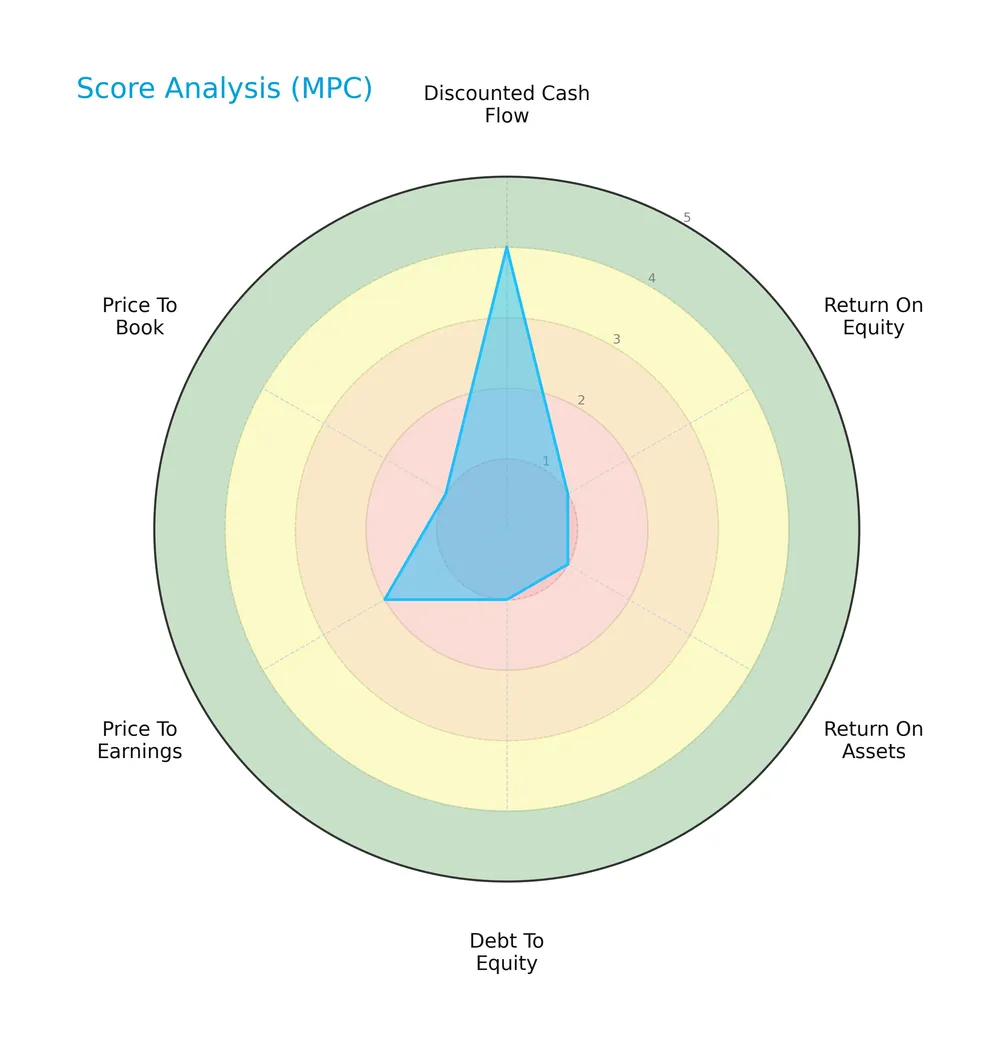
Marathon Petroleum shows strong profitability with a very favorable ROE score of 5 and favorable ROA of 4. However, valuation scores are weak, with very unfavorable PB at 1 and unfavorable PE at 2. The debt-to-equity score is very unfavorable at 1, signaling potential leverage concerns.
Analysis of the company’s bankruptcy risk
Marathon Petroleum’s Altman Z-Score places it firmly in the safe zone, indicating a low probability of bankruptcy and solid financial stability:

Is the company in good financial health?
The Piotroski Score diagram highlights Marathon Petroleum’s financial strength based on nine key criteria:

With a Piotroski Score of 7, the company demonstrates strong financial health, suggesting efficient operations and prudent capital management, though not at the very strongest level.
Competitive Landscape & Sector Positioning
This section examines Marathon Petroleum Corporation’s strategic positioning within the Oil & Gas Refining & Marketing sector. I will analyze its revenue by segment, key products, main competitors, and overall market stance. I aim to determine whether Marathon Petroleum holds a competitive advantage over its rivals.
Strategic Positioning
Marathon Petroleum concentrates on refining and marketing, generating $124B in 2025, supplemented by a $5.6B midstream segment and $2.8B renewable diesel. Its operations are primarily U.S.-focused, with extensive downstream integration and significant brand presence across 37 states and Mexico.
Revenue by Segment
This pie chart illustrates Marathon Petroleum Corporation’s revenue distribution by segment for the fiscal year 2025, highlighting key business areas and their relative contributions.
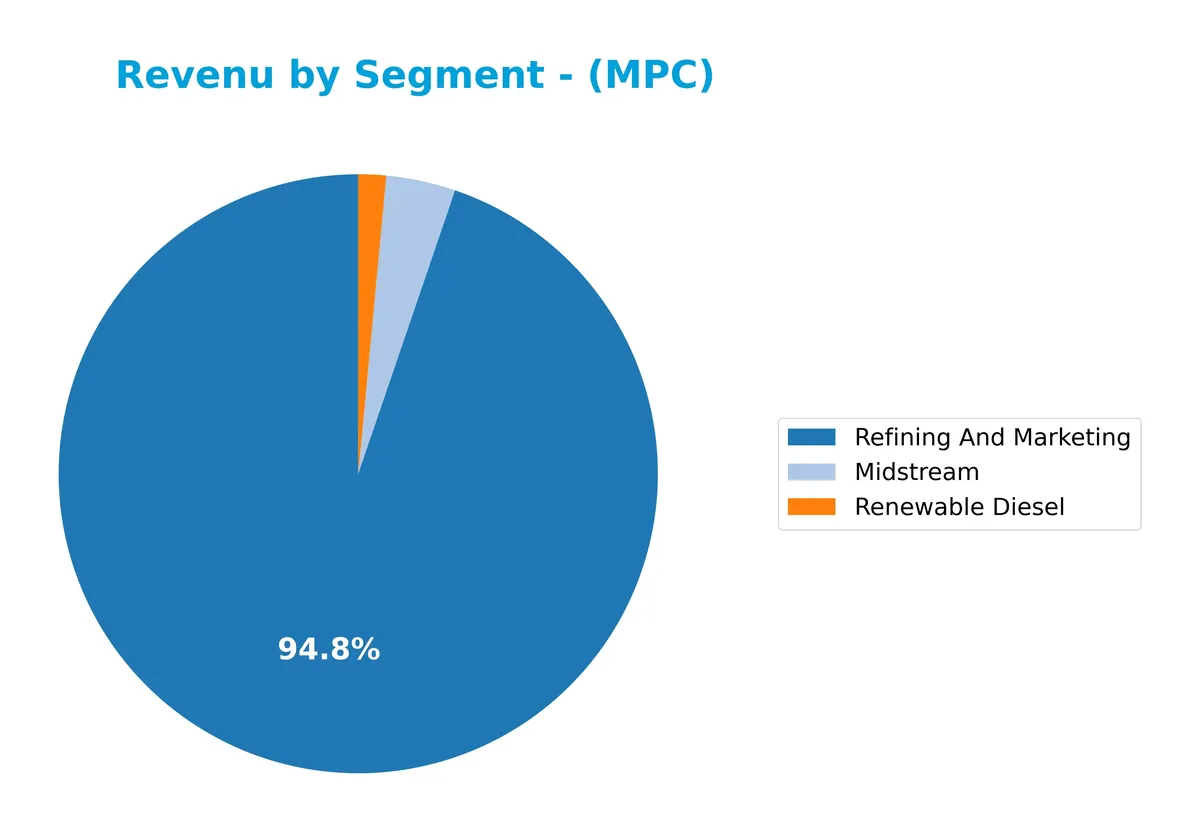
In 2025, Refining And Marketing remains the dominant revenue driver at $124B, showing a slight decline from prior years but still critical to the business. Renewable Diesel, at $2.8B, signals growing investment in sustainable fuels, accelerating from $2.1B in 2024. Midstream revenue increased modestly to $5.6B, indicating steady operational support. The shift towards renewable fuels underscores strategic diversification amid refining volatility.
Key Products & Brands
The following table summarizes Marathon Petroleum Corporation’s main products and brands with brief descriptions:
| Product | Description |
|---|---|
| Refining & Marketing | Refines crude oil and feedstocks; produces transportation fuels, heavy fuel oil, asphalt, and chemicals. Sells to wholesale and retail outlets, including Marathon and ARCO brands. |
| Midstream | Transports, stores, and markets crude oil, refined products, natural gas, and natural gas liquids via pipelines, terminals, and barges. |
| Renewable Diesel | Produces renewable diesel fuel, contributing to cleaner transportation energy solutions. |
Marathon Petroleum’s core revenue drivers remain its refining and marketing operations, supplemented by midstream logistics and growing renewable diesel production, reflecting evolving energy trends.
Main Competitors
There are 3 main competitors in the Oil & Gas Refining & Marketing industry; below are the top 3 leaders by market capitalization:
| Competitor | Market Cap. |
|---|---|
| Phillips 66 | 52.6B |
| Valero Energy Corporation | 51.6B |
| Marathon Petroleum Corporation | 49.6B |
Marathon Petroleum Corporation ranks 3rd among its competitors. Its market cap equals 1.15 times that of the leader, Phillips 66. The company stands above both the average market cap of the top 10 and the sector median. It trails its closest rival by approximately 14.6%, highlighting a notable gap.
Comparisons with competitors
Check out how we compare the company to its competitors:
Does MPC have a competitive advantage?
Marathon Petroleum Corporation demonstrates a clear competitive advantage, consistently generating returns above its cost of capital. Its growing ROIC over 2021-2025 signals efficient capital use and value creation in refining and midstream operations.
Looking ahead, MPC’s integrated downstream model and extensive logistics assets position it well to capitalize on evolving energy markets. Expansion in refined product sales and midstream services offers notable growth opportunities amid shifting demand dynamics.
SWOT Analysis
This SWOT analysis highlights Marathon Petroleum Corporation’s key internal and external factors shaping its strategic outlook.
Strengths
- strong ROE at 23.37%
- favorable interest coverage of 6.5x
- growing ROIC outperforming WACC by 2.7x
Weaknesses
- weak quick ratio at 0.74
- high debt-to-equity ratio near 2
- net margin remains low at 3.05%
Opportunities
- expanding midstream segment with $11.5B revenue
- favorable dividend yield at 2.29%
- improving EPS growth over 390% in long term
Threats
- volatile oil price environment
- regulatory shifts on fossil fuels
- competitive pressure from renewable energy sources
Marathon’s solid profitability and capital efficiency underpin its strong moat. However, liquidity constraints and leverage pose risks. The firm must leverage growth in midstream assets while managing debt prudently amid sector headwinds.
Stock Price Action Analysis
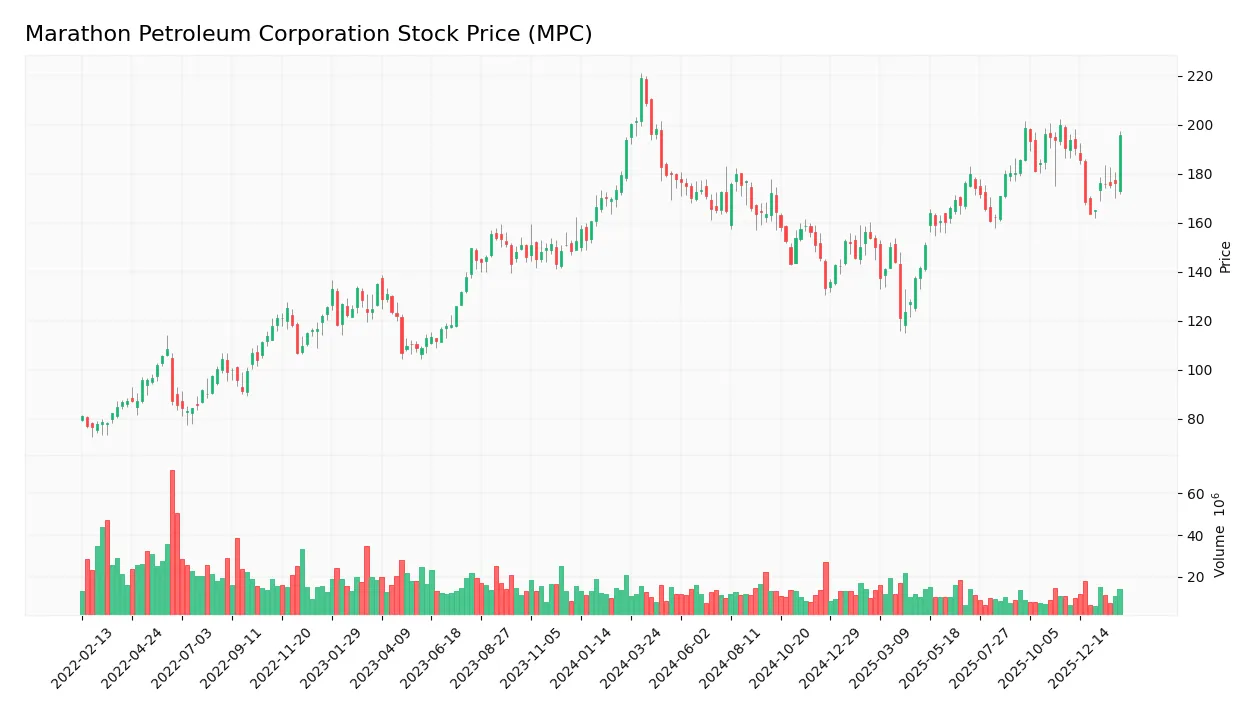
The following weekly stock chart illustrates Marathon Petroleum Corporation’s price movements over the past 12 months, highlighting key volatility and trend shifts:
Trend Analysis
Over the past 12 months, MPC’s stock price declined by 8.24%, indicating a clear bearish trend with accelerating downward momentum. The price fluctuated widely, hitting a high of 219.13 and a low of 121.07. Volatility remains elevated with a 19.62 standard deviation, emphasizing risk.
Volume Analysis
Trading volume totaled 1.46B shares, with buyers accounting for 53.49%, suggesting slight buyer dominance. However, volume is decreasing, signaling waning market participation. Recent three-month data show a neutral buyer trend at 51.23%, reflecting balanced sentiment without strong conviction.
Target Prices
Analysts present a clear target consensus for Marathon Petroleum Corporation (MPC).
| Target Low | Target High | Consensus |
|---|---|---|
| 174 | 225 | 202.22 |
The target range suggests moderate upside potential, with consensus reflecting confidence in MPC’s strategic positioning amid energy sector volatility.

Don’t Let Luck Decide Your Entry Point
Optimize your entry points with our advanced ProRealTime indicators. You’ll get efficient buy signals with precise price targets for maximum performance. Start outperforming now!
Analyst & Consumer Opinions
This section examines Marathon Petroleum Corporation’s recent analyst ratings alongside consumer feedback and market sentiment metrics.
Stock Grades
Here are the latest verified stock grades for Marathon Petroleum Corporation from leading financial institutions:
| Grading Company | Action | New Grade | Date |
|---|---|---|---|
| BMO Capital | Maintain | Outperform | 2026-02-09 |
| Citigroup | Maintain | Neutral | 2026-02-09 |
| Wells Fargo | Maintain | Overweight | 2026-02-04 |
| Citigroup | Maintain | Neutral | 2026-01-14 |
| Barclays | Maintain | Overweight | 2026-01-13 |
| Mizuho | Maintain | Neutral | 2026-01-13 |
| Piper Sandler | Maintain | Neutral | 2026-01-08 |
| Barclays | Maintain | Overweight | 2025-11-17 |
| Piper Sandler | Maintain | Neutral | 2025-11-14 |
| Wells Fargo | Maintain | Overweight | 2025-11-05 |
The consensus remains positive with a Buy rating overall. Most firms maintain neutral to overweight stances, indicating cautious optimism without significant shifts in sentiment.
Consumer Opinions
Marathon Petroleum Corporation (MPC) draws mixed consumer sentiment, reflecting both its operational strengths and areas needing improvement.
| Positive Reviews | Negative Reviews |
|---|---|
| Efficient fuel stations with competitive pricing. | Customer service response times can be slow. |
| Consistent fuel quality and availability. | Some locations suffer from outdated facilities. |
| Reward program offers valuable savings. | Mobile app functionality is often glitchy. |
Overall, consumers appreciate MPC’s reliable fuel quality and attractive pricing. However, slow customer service and technology issues frequently undermine satisfaction.
Risk Analysis
Below is a summary table of key risks relevant to Marathon Petroleum Corporation’s financial and operational profile:
| Category | Description | Probability | Impact |
|---|---|---|---|
| Leverage Risk | High debt-to-equity ratio (1.98) increases financial leverage and risk. | Medium | High |
| Liquidity Risk | Quick ratio at 0.74 signals potential short-term liquidity constraints. | Medium | Medium |
| Commodity Price | Exposure to volatile oil prices can compress margins and earnings. | High | High |
| Regulatory Risk | Stricter environmental regulations could raise costs and limit operations. | Medium | Medium |
| Market Volatility | Beta 0.708 indicates below-market volatility but still subject to shocks. | Low | Medium |
The most significant risks are commodity price volatility and leverage. The oil & gas refining sector historically sees sharp earnings swings tied to crude prices. Marathon’s debt levels remain elevated, increasing vulnerability to interest rate rises. However, its Altman Z-Score of 3.26 places it securely in the safe zone, reflecting solid financial stability despite these risks.
Should You Buy Marathon Petroleum Corporation?
Marathon Petroleum Corporation appears to be in a very favorable position with robust profitability and a durable competitive moat supported by growing ROIC well above WACC. Despite a substantial leverage profile, the overall rating of B suggests a strong value creation potential, tempered by some debt-related risks.
Strength & Efficiency Pillars
Marathon Petroleum Corporation delivers solid profitability with a return on equity of 23.37% and a net margin of 3.05%. Its return on invested capital (ROIC) stands at 8.11%, comfortably above its weighted average cost of capital (WACC) of 5.38%. This confirms the company as a value creator, generating returns exceeding its capital costs. Operational efficiency is evident with strong asset turnover metrics (1.58) and interest coverage at 6.5x, supporting sustainable earnings growth and competitive advantage.
Weaknesses and Drawbacks
The company faces valuation and leverage challenges. While its price-to-earnings ratio of 12.26 is favorable, the price-to-book ratio at 2.86 is only neutral. More concerning is the debt-to-equity ratio of 1.98, flagged as unfavorable, indicating significant leverage that could pressure financial flexibility. The quick ratio of 0.74 also signals liquidity constraints compared to industry norms. These factors increase risk, especially in volatile market conditions, despite a stable current ratio of 1.26.
Our Final Verdict about Marathon Petroleum Corporation
Marathon Petroleum Corporation presents a fundamentally sound profile with a strong Piotroski score of 7 and a safe Altman Z-Score of 3.26, signaling low bankruptcy risk. Despite a recent bearish trend, a neutral buyer dominance of 51.23% suggests a cautious but watchful stance. Its value-creating efficiency and improving operational margins make the stock potentially attractive for long-term exposure, though investors may prefer to monitor market signals before committing.
Disclaimer: This content is for informational purposes only and does not constitute financial, investment, or other professional advice. Investing in financial markets involves a significant risk of loss, and past performance is not indicative of future results.
Additional Resources
- Decoding Marathon Petroleum Corp (MPC): A Strategic SWOT Insight – GuruFocus (Feb 27, 2026)
- US Bancorp DE Decreases Stock Holdings in Marathon Petroleum Corporation $MPC – MarketBeat (Feb 26, 2026)
- Marathon Petroleum Corp SEC 10-K Report – TradingView (Feb 26, 2026)
- Is Trending Stock Marathon Petroleum Corporation (MPC) a Buy Now? – Yahoo Finance (Feb 23, 2026)
- Marathon Petroleum (MPC): Growth, Guidance, and Market Outlook – Insider Monkey (Feb 25, 2026)
For more information about Marathon Petroleum Corporation, please visit the official website: marathonpetroleum.com