Home > Analyses > Financial Services > M&T Bank Corporation
M&T Bank Corporation anchors daily financial lives across the Mid-Atlantic and Northeastern U.S., shaping communities with tailored banking solutions. It commands respect as a regional banking powerhouse, delivering commercial and retail services through robust lending, wealth management, and digital platforms. Known for disciplined capital allocation and steady innovation, M&T balances tradition with modern demands. The critical question now: does its solid franchise and prudent strategy justify current valuations amid evolving economic cycles?

Table of contents
Business Model & Company Overview
M&T Bank Corporation, founded in 1856 and headquartered in Buffalo, NY, stands as a dominant regional bank with 688 domestic offices across eight states and a presence in Ontario, Canada. Its core mission unites commercial and retail banking services into a cohesive ecosystem, serving small businesses, middle-market clients, and retail consumers with a broad spectrum of financial products.
The company’s revenue engine balances lending, deposit-taking, and fee-based wealth management, blending commercial real estate, residential mortgages, and trust services. M&T’s strategic footprint spans the Americas and extends into Canada, enhancing its competitive edge. This multi-faceted approach creates a robust economic moat, positioning M&T as a formidable force shaping regional banking’s future.
Financial Performance & Fundamental Metrics
I analyze M&T Bank Corporation’s income statement, key financial ratios, and dividend payout policy to assess its core financial health and shareholder value.
Income Statement
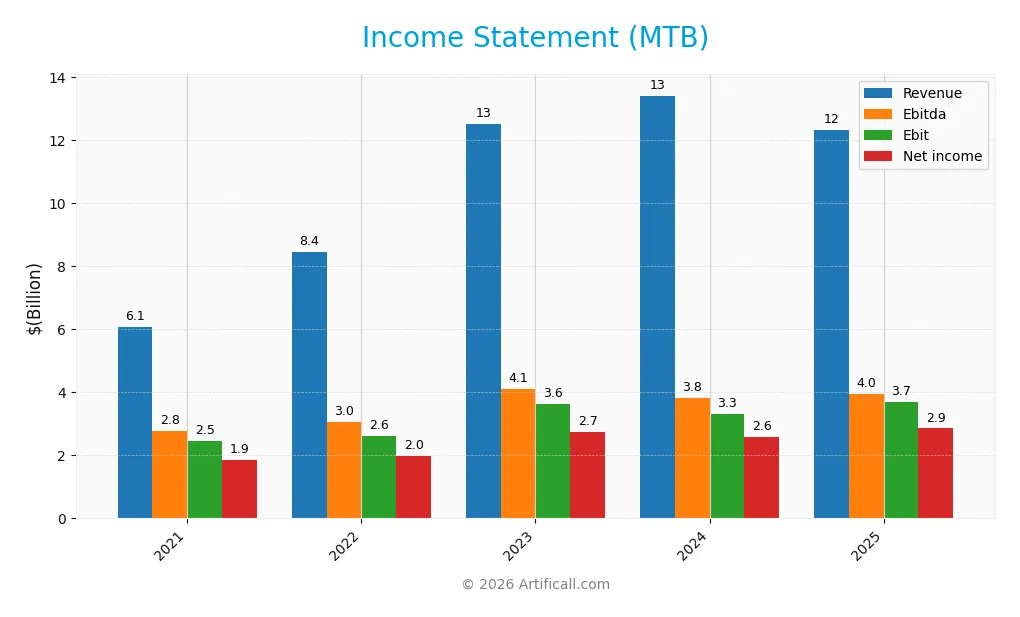
The table below summarizes M&T Bank Corporation’s key income statement figures over the past five fiscal years, providing insight into its financial performance trajectory.
| 2021 | 2022 | 2023 | 2024 | 2025 | |
|---|---|---|---|---|---|
| Revenue | 6.08B | 8.44B | 12.51B | 13.41B | 12.31B |
| Cost of Revenue | 39M | 942M | 3.75B | 4.78B | 3.12B |
| Operating Expenses | 3.58B | 4.88B | 5.13B | 5.31B | 5.49B |
| Gross Profit | 6.04B | 7.50B | 8.75B | 8.62B | 9.19B |
| EBITDA | 2.78B | 3.05B | 4.12B | 3.82B | 3.96B |
| EBIT | 2.46B | 2.61B | 3.62B | 3.31B | 3.69B |
| Interest Expense | 114M | 425M | 3.11B | 4.17B | 3.54B |
| Net Income | 1.86B | 1.99B | 2.74B | 2.59B | 2.85B |
| EPS | 13.81 | 11.59 | 15.85 | 14.71 | 17.10 |
| Filing Date | 2022-02-16 | 2023-02-22 | 2024-02-21 | 2025-02-19 | 2026-02-18 |
Income Statement Evolution
Between 2021 and 2025, M&T Bank’s revenue more than doubled, rising 103%. However, revenue dipped 8% in the latest year. Gross profit increased overall, showing a favorable 6.5% growth last year despite revenue decline. Margins remain strong, with a gross margin of 74.6% and an EBIT margin near 30%, indicating stable operational efficiency.
Is the Income Statement Favorable?
In 2025, net income reached $2.85B, reflecting a 20% net margin growth and 16% EPS growth year-over-year. Operating expenses fell alongside revenue, but interest expense remains high at 29% of revenue, flagged as unfavorable. Overall, over 70% of income metrics rate favorable, supporting a generally positive fundamental outlook.
Financial Ratios
The table below summarizes key financial ratios for M&T Bank Corporation (MTB) over the last five fiscal years:
| Ratios | 2021 | 2022 | 2023 | 2024 | 2025 |
|---|---|---|---|---|---|
| Net Margin | 31% | 24% | 22% | 19% | 23% |
| ROE | 10.4% | 7.9% | 10.2% | 8.9% | 9.8% |
| ROIC | 8.7% | 6.1% | 6.8% | 5.5% | 6.8% |
| P/E | 10.6 | 11.9 | 8.3 | 12.1 | 11.5 |
| P/B | 1.10 | 0.93 | 0.85 | 1.08 | 1.13 |
| Current Ratio | 0.36 | 0.23 | 0.25 | 0.22 | 0.32 |
| Quick Ratio | 0.36 | 0.23 | 0.25 | 0.22 | 0.32 |
| D/E | 0.20 | 0.30 | 0.50 | 0.47 | 0.45 |
| Debt-to-Assets | 2.3% | 3.7% | 6.5% | 6.6% | 6.1% |
| Interest Coverage | 21.5 | 6.1 | 1.2 | 0.8 | 1.0 |
| Asset Turnover | 0.04 | 0.04 | 0.06 | 0.06 | 0.06 |
| Fixed Asset Turnover | 5.3 | 5.1 | 7.2 | 7.9 | 0.0* |
| Dividend Yield | 3.3% | 3.7% | 4.2% | 3.3% | 2.7% |
*Fixed Asset Turnover for 2025 is reported as zero and should be treated as a potential data anomaly or red flag.
Evolution of Financial Ratios
M&T Bank’s Return on Equity (ROE) declined from 10.38% in 2021 to 9.77% in 2025, indicating slowing profitability. The Current Ratio remained consistently low, below 0.4, signaling tight liquidity. Meanwhile, the Debt-to-Equity Ratio improved from 0.50 in 2023 to 0.45 in 2025, reflecting a modest reduction in leverage risk.
Are the Financial Ratios Fovorable?
In 2025, profitability shows strength with a favorable net margin of 23.16%, but ROE at 9.77% lags behind the cost of capital (WACC 10.19%), suggesting capital returns under pressure. Liquidity ratios are weak, with Current and Quick Ratios near 0.32, a red flag for short-term resilience. Leverage ratios, including Debt-to-Equity at 0.45 and Debt-to-Assets at 6.12%, are favorable, while interest coverage at 1.04 signals risk. Overall, ratios skew slightly unfavorable.
Shareholder Return Policy
M&T Bank Corporation maintains a consistent dividend payout ratio around 31-44%, with dividends per share rising from $5.04 in 2021 to $5.51 in 2025. The annual dividend yield fluctuates between 2.7% and 4.2%, supported by coverage ratios above 3x, indicating sustainable distributions.
The company also executes share buybacks, enhancing shareholder returns alongside dividends. This balanced approach, underpinned by solid free cash flow coverage, suggests a disciplined capital allocation strategy that supports sustainable long-term shareholder value.
Score analysis
The following radar chart summarizes key valuation and financial performance scores for M&T Bank Corporation:
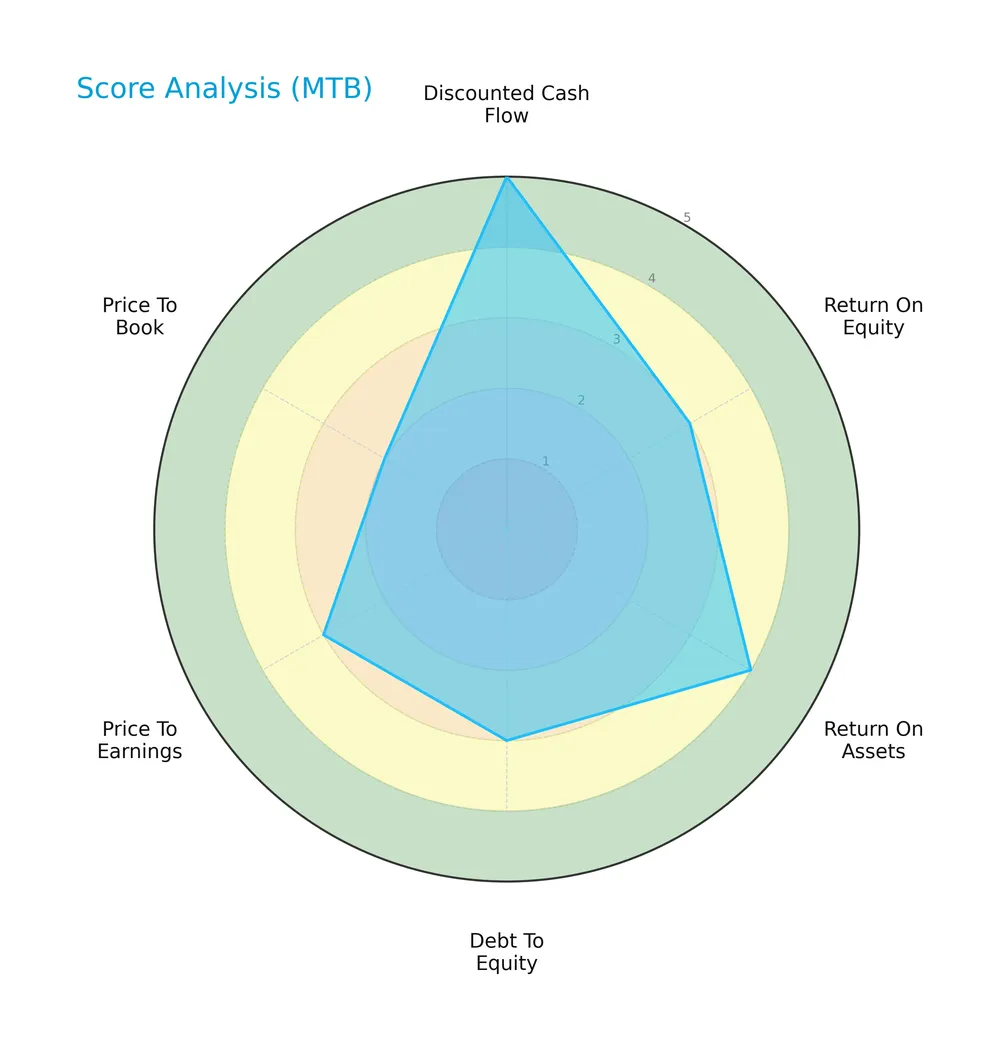
M&T Bank shows strength in discounted cash flow with a very favorable score of 5. Return on assets is favorable at 4, while return on equity and debt-to-equity each receive moderate scores of 3. Price-to-earnings is moderate, but price-to-book lags with an unfavorable score of 2.
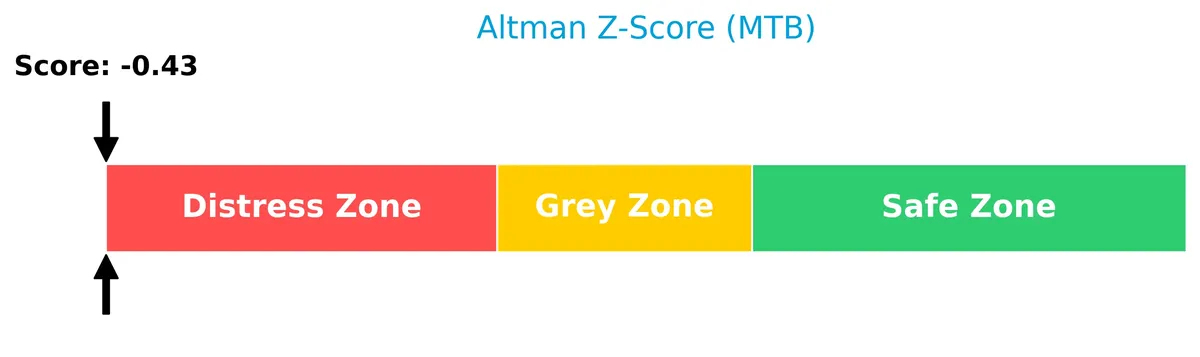
Analysis of the company’s bankruptcy risk
M&T Bank’s Altman Z-Score places it in the distress zone, indicating elevated bankruptcy risk and financial instability:
Is the company in good financial health?
The Piotroski Score diagram illustrates a very strong financial health rating for M&T Bank:

With a Piotroski Score of 8, the company demonstrates robust profitability, liquidity, and operational efficiency, signaling strong financial health despite other risk factors.
Competitive Landscape & Sector Positioning
This sector analysis examines M&T Bank Corporation’s strategic positioning, revenue segments, key products, and main competitors. I will assess whether M&T Bank holds a competitive advantage over its peers.
Strategic Positioning
M&T Bank Corporation concentrates on regional banking with a diversified product portfolio spanning commercial, retail, mortgage, and fiduciary services. Its geographic exposure mainly covers the US Northeast and Mid-Atlantic, with limited international presence limited to one office in Ontario, Canada.
Revenue by Segment
The pie chart illustrates M&T Bank Corporation’s revenue distribution by business segments for fiscal year 2025, highlighting the relative contribution of each key division.
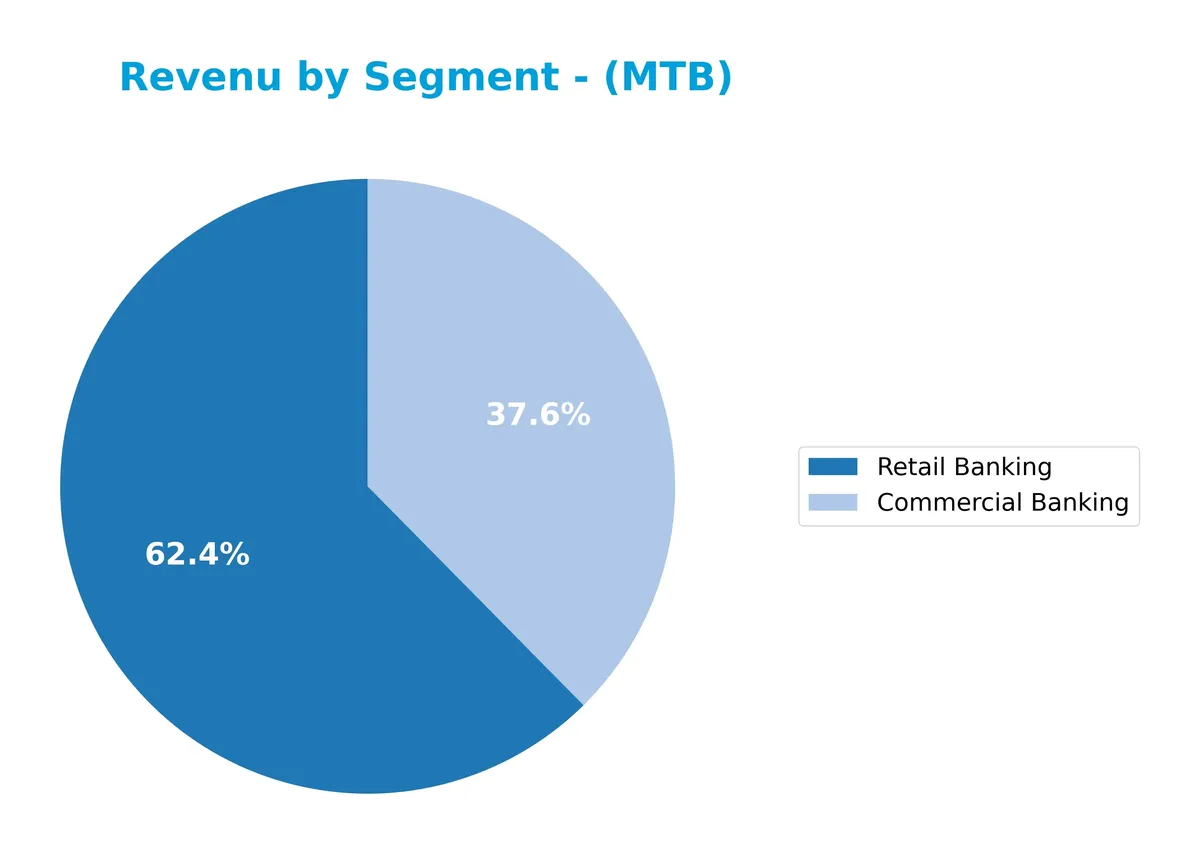
In 2025, Retail Banking leads with $501M, reflecting steady growth from $471M in 2024. Commercial Banking follows at $302M, up from $272M, showing a healthy expansion. Earlier years show more diversified segments, but recent data focuses on these two, signaling consolidation. The acceleration in Retail Banking revenue signals growing consumer demand, while Commercial Banking’s rise suggests strengthening corporate relationships, though dependence on these segments could pose concentration risks.
Key Products & Brands
M&T Bank Corporation operates several banking and financial service segments, as summarized below:
| Product | Description |
|---|---|
| Business Banking | Deposit, lending, cash management, and financial services for small businesses and professionals. |
| Commercial Banking | Deposit products, commercial lending, leasing, letters of credit, and cash management for middle-market and large commercial customers. |
| Commercial Real Estate | Originates, sells, and services commercial real estate loans; provides deposit services. |
| Discretionary Portfolio | Includes deposits, securities, residential real estate loans, borrowed funds, and foreign exchange services. |
| Residential Mortgage Banking | Offers residential real estate loans for consumers; sells loans in secondary markets; purchases servicing rights. |
| Retail Banking | Demand, savings, and time accounts; consumer installment, automobile, recreational, home equity loans; credit cards; mutual funds and annuities; other retail financial services. |
| Fiduciary and Trust | Trust, wealth management, fiduciary, and custodial services. |
| Institutional Brokerage & Securities | Brokerage and securities services for institutional clients. |
| Investment Management | Provides investment management services. |
| Insurance Agency | Offers insurance-related services. |
M&T Bank’s diverse product lines span commercial and retail banking, mortgage services, trust and wealth management, and brokerage. This breadth supports stable revenue streams across market cycles.
Main Competitors
There are 9 competitors in total; the table below lists the top 9 leaders by market capitalization:
| Competitor | Market Cap. |
|---|---|
| U.S. Bancorp | 83.8B |
| The PNC Financial Services Group, Inc. | 82.9B |
| Truist Financial Corporation | 64.6B |
| Fifth Third Bancorp | 31.5B |
| M&T Bank Corporation | 31.4B |
| Huntington Bancshares Incorporated | 25.5B |
| Citizens Financial Group, Inc. | 25.5B |
| Regions Financial Corporation | 24.9B |
| KeyCorp | 22.9B |
M&T Bank Corporation ranks 5th among its competitors, holding roughly 42% of the market cap of the leader, U.S. Bancorp. It trades below the average market cap of the top 10 competitors (43.7B) but remains above the sector median (31.4B). The company is about 11.5% smaller than its nearest competitor above, Fifth Third Bancorp, indicating a moderate gap to climb.
Comparisons with competitors
Check out how we compare the company to its competitors:
Does MTB have a competitive advantage?
M&T Bank Corporation does not present a competitive advantage based on its negative spread between ROIC and WACC and a declining ROIC trend. The company is currently destroying value with decreasing profitability, indicating weak capital efficiency.
Looking ahead, MTB’s broad service offerings across commercial and retail banking, including wealth management and mortgage banking, position it to explore growth in new markets and products. However, sustaining a competitive edge will require reversing its unfavorable value creation trend.
SWOT Analysis
This SWOT analysis highlights M&T Bank Corporation’s key internal and external factors shaping its strategic outlook.
Strengths
- strong net margin at 23%
- favorable gross and EBIT margins
- stable dividend yield of 2.73%
Weaknesses
- declining revenue growth recently
- unfavorable interest coverage ratio
- low current and quick ratios signal liquidity risks
Opportunities
- expansion in commercial real estate lending
- digital banking growth
- cross-selling wealth management services
Threats
- rising interest expenses
- competitive regional banking sector
- regulatory changes impacting lending
M&T Bank exhibits solid profitability but struggles with liquidity and interest coverage. The company must leverage its strong margins and wealth management to offset revenue pressures. Prudent risk management is essential amid rising expenses and sector competition.
Stock Price Action Analysis
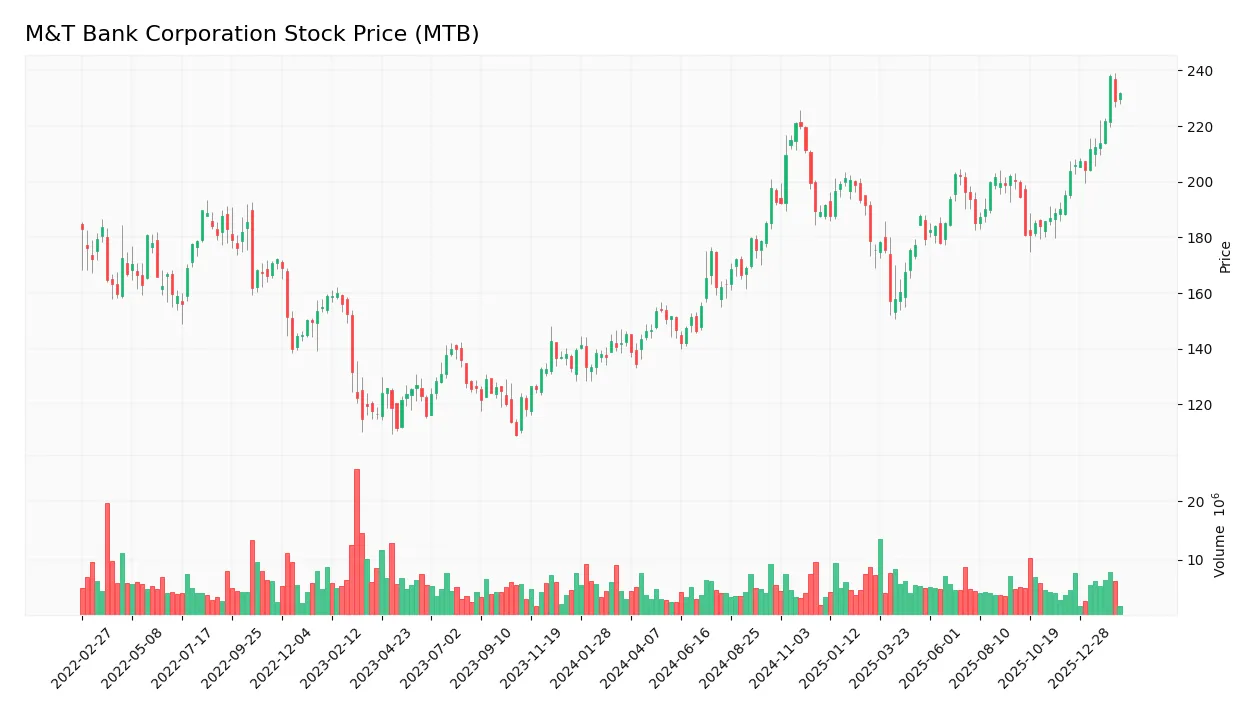
The weekly stock chart illustrates M&T Bank Corporation’s price movement over the past 12 months with notable volatility and upward momentum:
Trend Analysis
Over the past 12 months, MTB’s stock price rose 59.34%, signaling a clear bullish trend with accelerating momentum. The price fluctuated between a low of 134.56 and a high of 238.01, showing significant volatility with a 22.49 standard deviation.
Volume Analysis
Trading volume shows an increasing trend, with buyers accounting for 58% overall and surging to 85% dominance recently. This strong buyer-driven activity reflects growing investor confidence and heightened market participation in the last three months.
Target Prices
Analysts set a clear target price consensus for M&T Bank Corporation, reflecting moderate upside potential.
| Target Low | Target High | Consensus |
|---|---|---|
| 208 | 255 | 230.8 |
The target range suggests analysts expect the stock to appreciate from current levels, with a balanced outlook on growth and risk.

Don’t Let Luck Decide Your Entry Point
Optimize your entry points with our advanced ProRealTime indicators. You’ll get efficient buy signals with precise price targets for maximum performance. Start outperforming now!
Analyst & Consumer Opinions
This section reviews the latest analyst ratings and consumer feedback to gauge M&T Bank Corporation’s market perception.
Stock Grades
The latest ratings for M&T Bank Corporation from top-tier analysts reveal a nuanced view of the stock’s prospects:
| Grading Company | Action | New Grade | Date |
|---|---|---|---|
| JP Morgan | Maintain | Neutral | 2026-02-09 |
| RBC Capital | Maintain | Outperform | 2026-01-20 |
| Jefferies | Maintain | Buy | 2026-01-16 |
| Wolfe Research | Downgrade | Peer Perform | 2026-01-07 |
| B of A Securities | Downgrade | Neutral | 2026-01-07 |
| TD Cowen | Maintain | Buy | 2026-01-07 |
| Evercore ISI Group | Downgrade | In Line | 2026-01-06 |
| Barclays | Maintain | Equal Weight | 2026-01-05 |
| Keefe, Bruyette & Woods | Maintain | Market Perform | 2025-12-17 |
| Truist Securities | Downgrade | Hold | 2025-12-12 |
The overall trend sees several downgrades from Buy/Outperform to Neutral or Hold, signaling cautious sentiment. Nonetheless, a core group of analysts maintain Buy or Outperform ratings, reflecting mixed but balanced views.
Consumer Opinions
Consumer sentiment around M&T Bank Corporation reflects a blend of appreciation for service quality and frustration with certain operational aspects.
| Positive Reviews | Negative Reviews |
|---|---|
| Friendly and knowledgeable branch staff. | Slow online banking interface. |
| Reliable customer support with quick response. | Limited ATM network outside main regions. |
| Clear communication and transparent fees. | Occasional account processing delays. |
Overall, customers praise M&T Bank’s personalized service and transparency. However, digital experience and accessibility remain key areas for improvement.
Risk Analysis
Below is a table summarizing key risks facing M&T Bank Corporation, highlighting their likelihood and potential impact:
| Category | Description | Probability | Impact |
|---|---|---|---|
| Financial Stability | Altman Z-Score indicates distress zone, signaling elevated bankruptcy risk. | High | High |
| Liquidity | Very low current and quick ratios (0.32) suggest liquidity constraints. | High | Medium |
| Profitability & ROE | ROE (9.77%) below WACC (10.19%) reflects insufficient returns on equity. | Medium | Medium |
| Interest Coverage | Interest coverage ratio near 1.04 signals tight ability to cover debt costs. | Medium | High |
| Market Valuation | Price-to-book ratio unfavorable despite low P/E and solid dividend yield. | Medium | Low |
| Operational Efficiency | Extremely low asset turnover (0.06) and fixed asset turnover at zero. | Medium | Medium |
M&T’s most pressing risks are its financial stability and liquidity. The Altman Z-Score in distress zone is unusual for a bank of this size and signals caution. Coupled with poor liquidity ratios, these factors could pressure the bank during economic downturns. Profitability metrics like ROE failing to exceed WACC further constrain capital growth. Investors must weigh these risks against a strong Piotroski score and favorable dividend yield.
Should You Buy M&T Bank Corporation?
M&T Bank Corporation appears to be a company with moderate profitability but a deteriorating competitive moat, suggesting value destruction. Despite a manageable leverage profile and a very strong Piotroski score, its Altman Z-Score signals financial distress, resulting in an overall favorable A- rating.
Strength & Efficiency Pillars
M&T Bank Corporation shows robust operational margins, with a net margin of 23.16% and an EBIT margin near 30%. The Piotroski score of 8 signals very strong financial health. However, the return on invested capital (ROIC) at 6.75% falls below the weighted average cost of capital (WACC) at 10.19%, indicating the company is currently shedding value. Despite solid profitability, this gap suggests M&T struggles to generate returns above its capital costs, which is a key efficiency red flag.
Weaknesses and Drawbacks
M&T Bank is in financial distress, as indicated by a dangerously low Altman Z-Score of -0.43, placing it in the Distress Zone with a high bankruptcy risk. This solvency warning overrides other metrics. The company’s liquidity is weak, with a current ratio of 0.32 and interest coverage barely above 1. Debt-to-equity at 0.45 is moderate but insufficient to offset liquidity concerns. The unfavorable valuation metrics and declining ROIC trend compound the risk, demanding caution from investors.
Our Final Verdict about M&T Bank Corporation
Despite operational strengths and strong Piotroski health signals, M&T Bank’s Altman Z-Score in the Distress Zone makes the investment highly speculative. The solvency risk outweighs profitability and growth. This profile may appear too risky for conservative capital, and investors should prioritize risk management over potential upside until financial stability improves.
Disclaimer: This content is for informational purposes only and does not constitute financial, investment, or other professional advice. Investing in financial markets involves a significant risk of loss, and past performance is not indicative of future results.
Additional Resources
- Jaw-dropping images show Tom Brady’s $150M Miami fortress is complete, with space for a $6.5M speedboat – Yahoo (Feb 18, 2026)
- Rouble Nagi: The teacher who won $1m for turning India’s slums into open-air classrooms – BBC (Feb 19, 2026)
- 30 New BMW M Cars Coming in 30 Months, CEO Says, But the Stick Shift’s Days May Be Numbered – Road & Track (Feb 18, 2026)
- BMW M Says No to CS Versions of X3, X5, and X6 – Autoblog (Feb 18, 2026)
- BMW X5 M Competition Tested: Heavy Hitter – Car and Driver (Feb 18, 2026)
For more information about M&T Bank Corporation, please visit the official website: www3.mtb.com