Home > Analyses > Basic Materials > LyondellBasell Industries N.V.
LyondellBasell shapes the global chemical landscape by transforming raw materials into essential products that touch daily life worldwide. Its leadership in specialty chemicals spans six dynamic segments, including advanced polymers and refining, delivering innovation and quality that set industry standards. As the company navigates evolving markets and environmental pressures, I ask: do its robust fundamentals still justify its valuation and promise sustained growth in 2026?
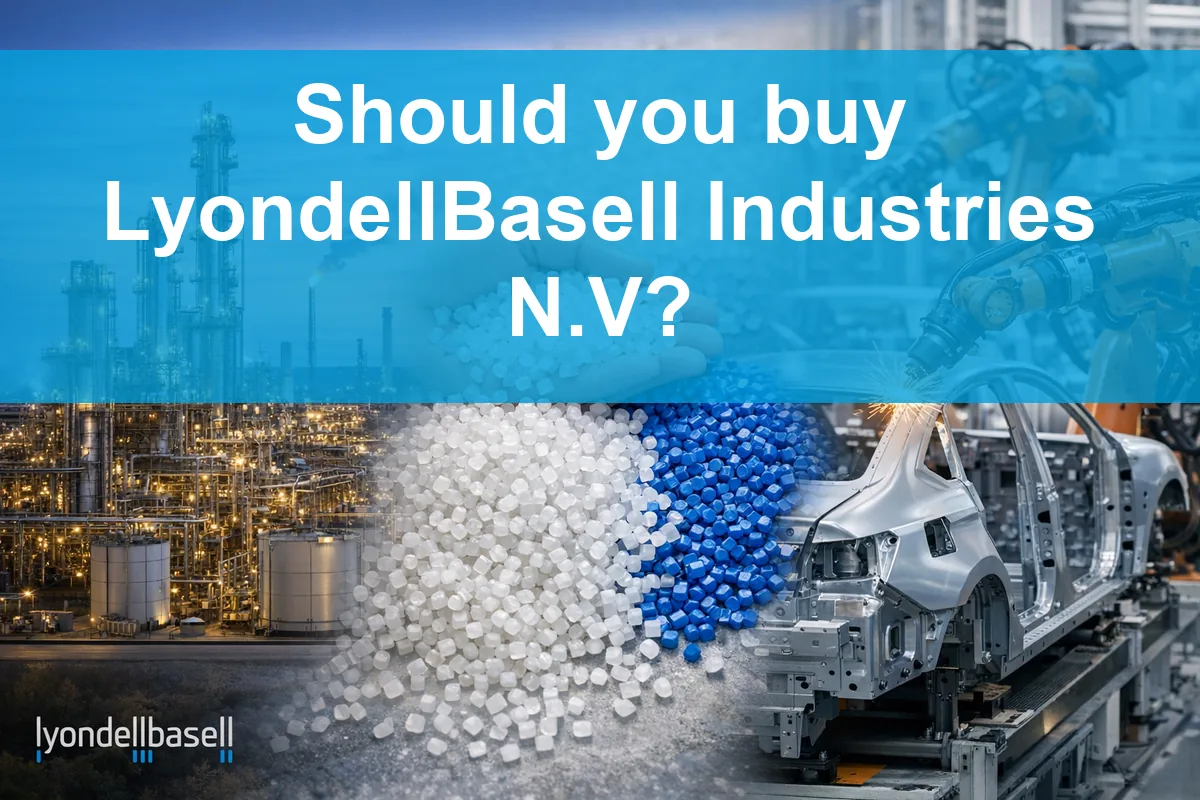
Table of contents
Business Model & Company Overview
LyondellBasell Industries N.V., founded in 2009 and headquartered in Houston, TX, stands as a global leader in specialty chemicals. Its core business weaves together olefins, polyolefins, and advanced polymers into a comprehensive ecosystem, serving industries worldwide. The company’s operations span six segments, reflecting a robust integration of refining, manufacturing, and technology development.
The company generates value through a balanced mix of commodity chemicals, advanced polymer solutions, and proprietary process technologies. Its revenue engine powers across the Americas, Europe, and Asia, capitalizing on diverse markets. I see its vertically integrated model and technology licensing as a formidable economic moat, anchoring LyondellBasell’s influence in the chemical sector’s future.
Financial Performance & Fundamental Metrics
I will analyze LyondellBasell Industries N.V.’s income statement, key financial ratios, and dividend payout policy to assess its core financial health and shareholder value.
Income Statement
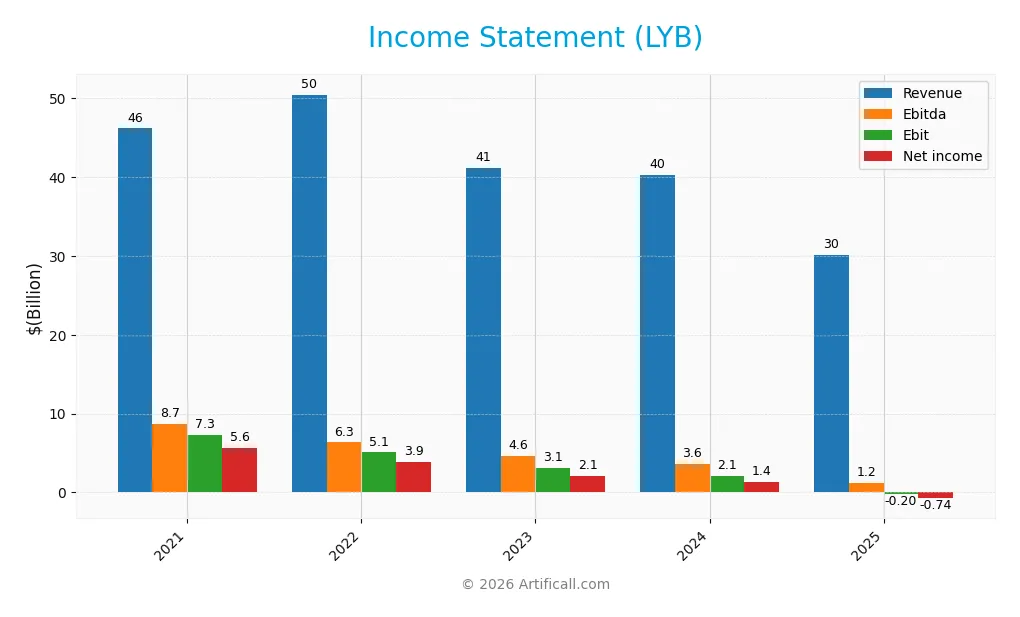
The table below summarizes LyondellBasell Industries N.V.’s key income statement figures for the last five fiscal years. Values are in USD.
| 2021 | 2022 | 2023 | 2024 | 2025 | |
|---|---|---|---|---|---|
| Revenue | 46.2B | 50.5B | 41.1B | 40.3B | 30.2B |
| Cost of Revenue | 37.4B | 43.8B | 35.8B | 35.7B | 27.4B |
| Operating Expenses | 2.0B | 1.5B | 2.2B | 2.7B | 3.0B |
| Gross Profit | 8.8B | 6.6B | 5.3B | 4.6B | 2.7B |
| EBITDA | 8.7B | 6.3B | 4.6B | 3.6B | 1.2B |
| EBIT | 7.3B | 5.1B | 3.1B | 2.1B | -0.2B |
| Interest Expense | 519M | 287M | 477M | 481M | 507M |
| Net Income | 5.6B | 3.9B | 2.1B | 1.4B | -0.7B |
| EPS | 16.75 | 11.84 | 6.48 | 4.16 | -2.35 |
| Filing Date | 2022-02-24 | 2023-02-23 | 2024-02-22 | 2025-02-27 | 2026-02-20 |
Income Statement Evolution
LyondellBasell’s revenue declined sharply by 25% in the past year, continuing a 35% drop since 2021. Gross profit fell 40% in 2025, compressing the gross margin to a neutral 9%. Operating expenses tracked with revenue declines, but the EBIT margin turned sharply negative, signaling erosion in core profitability. Net income reversed from gains to a -2.5% net margin.
Is the Income Statement Favorable?
In 2025, LyondellBasell reported a net loss of $745M and negative EBIT of $205M, reflecting operational and non-operating headwinds. Despite a modestly favorable interest expense ratio of 1.68%, the company’s fundamentals are broadly unfavorable. The steep declines in revenue, profitability, and earnings per share highlight significant challenges in sustaining profitability.
Financial Ratios
The following table presents key financial ratios for LyondellBasell Industries N.V. (LYB) over the fiscal years 2021 to 2025:
| Ratios | 2021 | 2022 | 2023 | 2024 | 2025 |
|---|---|---|---|---|---|
| Net Margin | 12.15% | 7.69% | 5.14% | 3.37% | -2.46% |
| ROE | 47.31% | 30.77% | 16.35% | 10.91% | -7.37% |
| ROIC | 18.57% | 13.53% | 7.94% | 5.15% | 5.90% |
| P/E | 5.49 | 6.99 | 14.62 | 17.75 | -18.77 |
| P/B | 2.60 | 2.15 | 2.39 | 1.94 | 1.38 |
| Current Ratio | 1.69 | 1.75 | 1.84 | 1.83 | 0 |
| Quick Ratio | 1.01 | 1.04 | 1.17 | 1.13 | 0 |
| D/E | 1.15 | 1.04 | 1.01 | 1.04 | 1.39 |
| Debt-to-Assets | 37.01% | 36.23% | 35.14% | 36.15% | 0% |
| Interest Coverage | 13.05 | 17.77 | 6.40 | 3.78 | -0.64 |
| Asset Turnover | 1.26 | 1.39 | 1.11 | 1.13 | 0 |
| Fixed Asset Turnover | 2.80 | 2.95 | 2.41 | 2.44 | 0 |
| Dividend Yield | 4.82% | 11.96% | 5.21% | 7.13% | 12.59% |
Evolution of Financial Ratios
From 2021 to 2025, LyondellBasell’s Return on Equity (ROE) sharply declined from 47.3% to -7.4%, signaling weakening profitability. The Current Ratio, stable around 1.7-1.8 through 2024, dropped to zero in 2025, indicating liquidity concerns. Debt-to-Equity ratio rose moderately from 1.15 to 1.39, reflecting increased leverage. Profit margins deteriorated significantly by 2025.
Are the Financial Ratios Favorable?
In 2025, profitability and liquidity ratios show unfavorable trends, with negative net margin (-2.46%) and zero current and quick ratios. Leverage is high (D/E 1.39), raising financial risk. However, the price-to-earnings (P/E) and price-to-book (P/B) ratios remain favorable, at -18.77 and 1.38 respectively. Return on invested capital (ROIC) is neutral, while interest coverage is negative, further stressing risk. Overall, the ratio profile is unfavorable.
Shareholder Return Policy
LyondellBasell Industries N.V. maintains a dividend payout despite negative net income in 2025, distributing $5.45 per share with a high yield of 12.6%. The payout ratio appears negative, signaling dividends may exceed net profits, a risk for sustainability.
The company supports shareholder returns through consistent dividends and engages in share buybacks. However, the negative earnings and modest operating margins suggest caution. This distribution policy may pressure free cash flow, posing long-term value risks if losses persist.
Score analysis
Here is a radar chart summarizing key valuation and financial performance scores for LyondellBasell Industries N.V.:
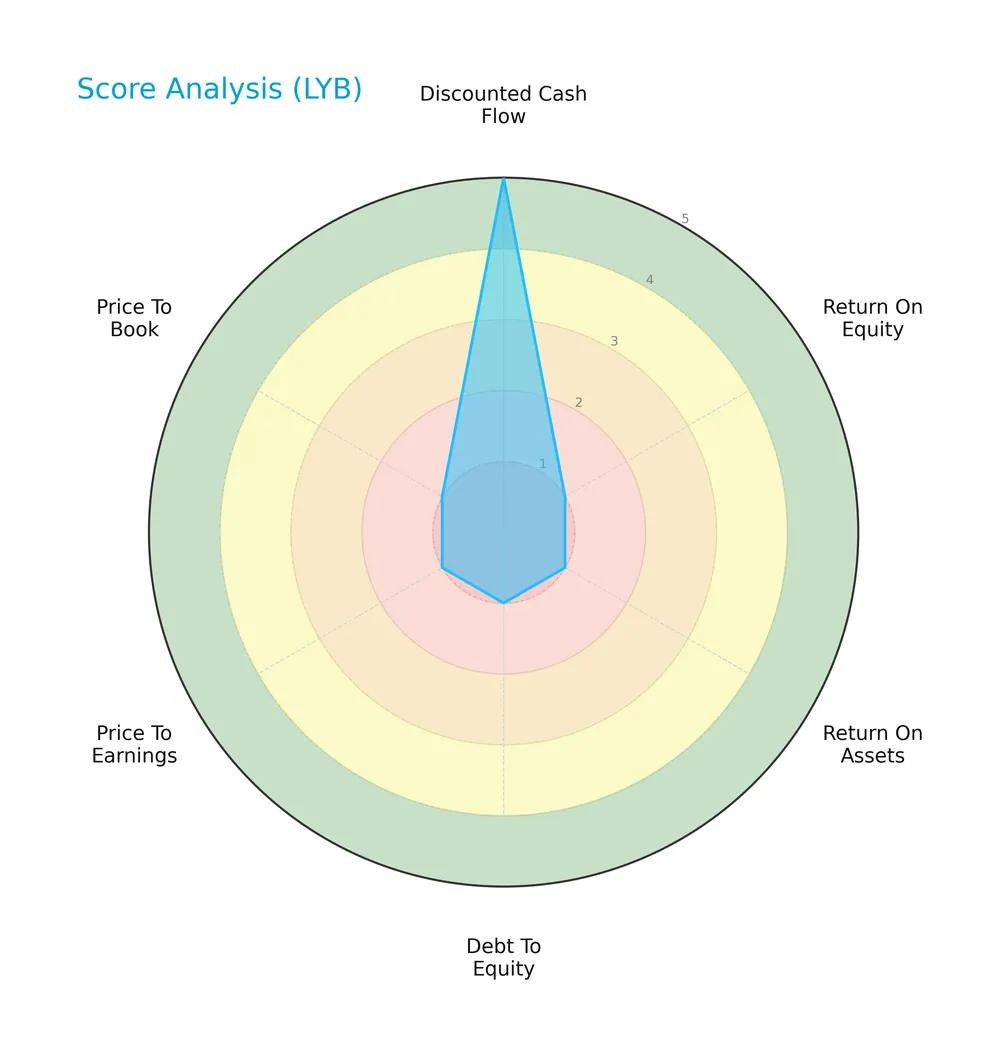
The discounted cash flow score stands out as very favorable at 5. However, profitability and leverage metrics, including return on equity, return on assets, and debt to equity, each score a very unfavorable 1. The price-to-book ratio shows a moderate score of 3, while price-to-earnings remains very unfavorable at 1. Overall, the scores reveal significant challenges in profitability and capital structure despite positive cash flow valuation.
Is the company in good financial health?
The Piotroski F-Score diagram below illustrates the company’s financial health assessment:
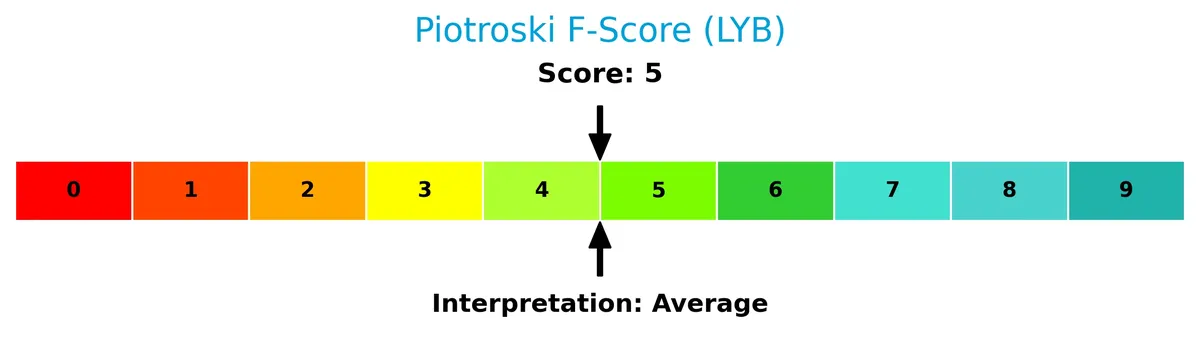
With a Piotroski score of 3, LyondellBasell’s financial strength rates as very weak. This low score indicates limited profitability, liquidity, and operational efficiency, raising concerns about its financial resilience and investment quality.
Competitive Landscape & Sector Positioning
This section examines LyondellBasell Industries N.V.’s strategic positioning, revenue segments, key products, and main competitors. I will assess whether the company holds a competitive advantage within the specialty chemicals sector.
Strategic Positioning
LyondellBasell maintains a diversified product portfolio across chemicals, polymers, refining, and technology segments. Its geographic exposure spans major markets including the US, Germany, Mexico, and China, reflecting a balanced global footprint that mitigates regional risks and leverages international demand.
Revenue by Segment
This pie chart displays LyondellBasell Industries’ revenue breakdown by product segment for the full fiscal year 2025. It highlights the relative contribution of each segment to total sales.
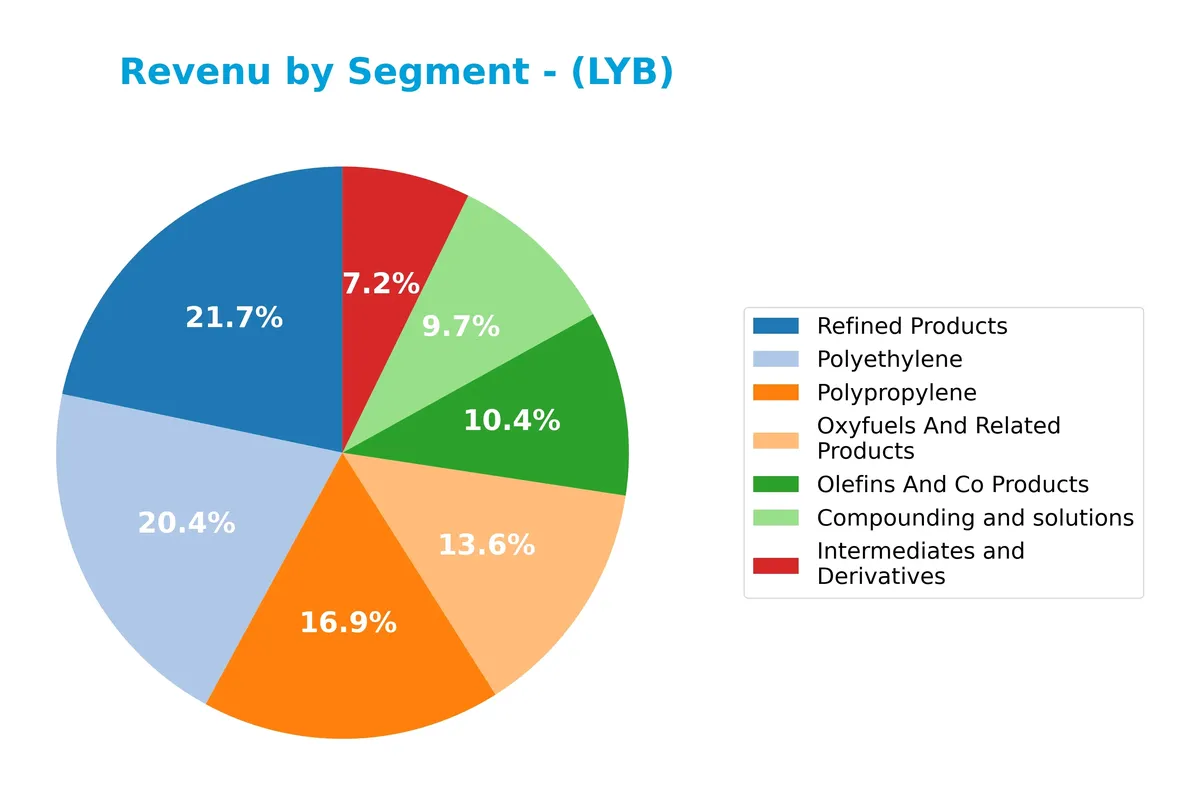
In 2025, Polyethylene leads with $7.2B, followed closely by Polypropylene at $5.8B. Oxyfuels and related products generated $4.8B, showing a slight decline from prior years. Olefins and co-products and compounding and solutions contribute $4.2B and $3.5B respectively. Intermediates and derivatives, at $1.9B, have notably contracted, signaling a shift away from this once significant segment. This spread suggests moderate diversification but rising concentration in core polymers.
Key Products & Brands
The table below outlines LyondellBasell’s key products and brands with concise descriptions:
| Product | Description |
|---|---|
| Olefins and Co Products | Olefins and related co-products used as chemical building blocks across various industries. |
| Polyethylene | High, low, and linear low-density polyethylene products for packaging, construction, and more. |
| Polypropylene | Homopolymers and copolymers serving diverse applications from automotive to consumer goods. |
| Intermediates and Derivatives | Chemicals including styrene monomers, acetyls, ethylene glycols, and derivatives. |
| Compounding and Solutions | Polypropylene compounds, engineered plastics, masterbatches, colors, and powders. |
| Oxyfuels and Related Products | Fuels and related chemical products derived from refining processes. |
| Refined Products | Gasoline and distillates produced by refining crude oil of varied types and sources. |
| Advanced Polymers | Specialty polymers designed for enhanced performance and niche applications. |
| Technology | Chemical and polyolefin process technologies developed and licensed by the company. |
LyondellBasell’s portfolio spans commodity chemicals, advanced polymers, and refined fuels. The company integrates production with proprietary technology licensing, supporting diverse industrial and consumer markets globally.
Main Competitors
There are 9 competitors in the Basic Materials sector, with the table listing the top 10 leaders by market capitalization:
| Competitor | Market Cap. |
|---|---|
| Linde plc | 200.4B |
| The Sherwin-Williams Company | 81.5B |
| Ecolab Inc. | 74.5B |
| Air Products and Chemicals, Inc. | 55.8B |
| PPG Industries, Inc. | 23.4B |
| International Flavors & Fragrances Inc. | 17.4B |
| DuPont de Nemours, Inc. | 17.1B |
| Albemarle Corporation | 16.9B |
| LyondellBasell Industries N.V. | 14.3B |
LyondellBasell ranks 9th among its competitors with a market cap just 9.1% of the leader, Linde plc. It stands below both the average market cap of the top 10 (55.7B) and the sector’s median (23.4B). The company trails its closest competitor by approximately 7.13%, indicating a narrow gap at the lower end of this competitive set.
Comparisons with competitors
Check out how we compare the company to its competitors:
Does LYB have a competitive advantage?
LYB currently lacks a competitive advantage, as it is shedding value with a declining ROIC below its WACC. The company’s profitability deteriorates, signaling inefficient capital use and value destruction.
Future opportunities include leveraging its broad geographic presence and diverse chemical segments. Expansion into new markets or innovative polymer solutions could improve its outlook if profitability stabilizes.
SWOT Analysis
This analysis highlights LyondellBasell Industries N.V.’s key strengths, weaknesses, opportunities, and threats to guide strategic decisions.
Strengths
- diversified global footprint
- strong market position in specialty chemicals
- favorable WACC relative to ROIC
Weaknesses
- declining profitability with negative net margin
- weak liquidity ratios (current and quick ratios at 0)
- high debt-to-equity ratio (1.39)
Opportunities
- rising demand for advanced polymers
- expansion in emerging markets
- technology licensing growth
Threats
- volatile raw material prices
- regulatory and environmental pressures
- intense sector competition
LyondellBasell possesses strong global scale and cost of capital advantages but faces significant profit and liquidity challenges. The company must leverage growth in advanced polymers and emerging markets while managing debt and operational risks prudently.
Stock Price Action Analysis
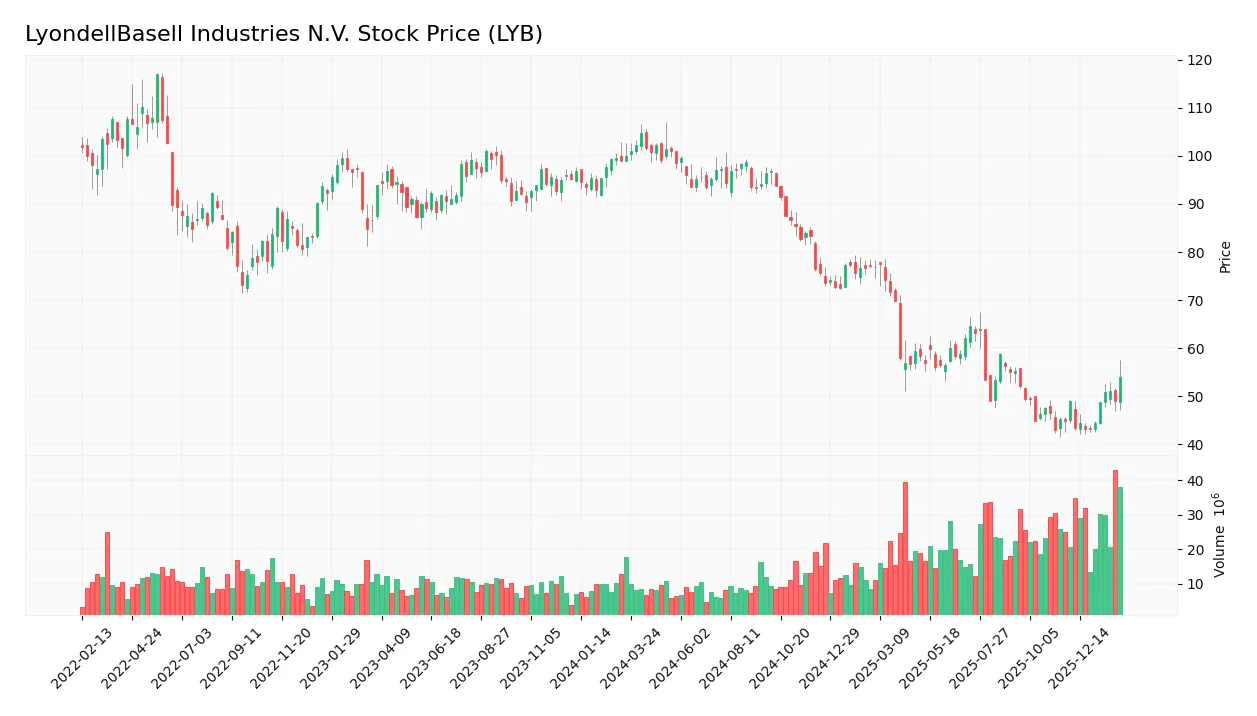
The weekly chart illustrates LyondellBasell Industries N.V. (LYB) stock price movements over the past 100 weeks, highlighting key fluctuations and recent momentum:
Trend Analysis
Over the past 100 weeks, LYB’s stock price declined sharply by 44.59%, indicating a bearish trend with acceleration. The price ranged between a high of 104.78 and a low of 43.02, reflecting significant volatility (std deviation 19.86). Notably, a recent 2.5-month period shows a 30.73% rebound, signaling a short-term positive slope (1.4).
Volume Analysis
Trading volume totals 1.89B shares, with a slight buyer volume edge at 49.9%. Volume is increasing overall. In the recent 2.5 months, buyer dominance strengthened to 61.3%, suggesting growing investor confidence and stronger market participation favoring upward price movement.
Target Prices
The analyst consensus for LyondellBasell Industries N.V. targets a moderate upside.
| Target Low | Target High | Consensus |
|---|---|---|
| 36 | 53 | 46.88 |
Analysts expect LYB to trade between $36 and $53, with a consensus near $47, reflecting cautious optimism in the chemical sector.

Don’t Let Luck Decide Your Entry Point
Optimize your entry points with our advanced ProRealTime indicators. You’ll get efficient buy signals with precise price targets for maximum performance. Start outperforming now!
Analyst & Consumer Opinions
This section examines the latest analyst ratings and consumer feedback regarding LyondellBasell Industries N.V. (LYB).
Stock Grades
Here are the latest verified grades from established financial institutions for LyondellBasell Industries N.V.:
| Grading Company | Action | New Grade | Date |
|---|---|---|---|
| Citigroup | Maintain | Neutral | 2026-02-03 |
| RBC Capital | Maintain | Sector Perform | 2026-02-03 |
| Wells Fargo | Maintain | Equal Weight | 2026-02-02 |
| RBC Capital | Maintain | Sector Perform | 2026-01-16 |
| Citigroup | Maintain | Neutral | 2026-01-15 |
| UBS | Maintain | Sell | 2025-12-23 |
| Wells Fargo | Downgrade | Equal Weight | 2025-12-19 |
| Citigroup | Maintain | Neutral | 2025-12-18 |
| BMO Capital | Downgrade | Underperform | 2025-12-15 |
| Mizuho | Maintain | Neutral | 2025-12-11 |
The consensus leans toward a cautious hold stance, with most firms maintaining neutral or sector perform ratings. Recent downgrades indicate some growing concerns, reflecting mixed sentiment among analysts.
Consumer Opinions
LyondellBasell Industries N.V. garners a mixed but generally favorable reception from its consumer base, reflecting its complex position in the chemical industry.
| Positive Reviews | Negative Reviews |
|---|---|
| Product quality is consistently reliable. | Customer service response times can lag. |
| Strong innovation in sustainable materials. | Pricing occasionally higher than competitors. |
| Efficient supply chain minimizes delays. | Some clients report variability in product specs. |
Overall, consumers praise LyondellBasell for its product reliability and innovation in sustainability. However, service responsiveness and pricing remain areas needing improvement to enhance customer satisfaction.
Risk Analysis
The following table summarizes LyondellBasell’s key risks based on financial and operational factors:
| Category | Description | Probability | Impact |
|---|---|---|---|
| Profitability | Negative net margin (-2.46%) signals weak profit generation | High | High |
| Liquidity | Current and quick ratios at 0 indicate critical short-term distress | High | High |
| Leverage | Debt-to-equity of 1.39 reflects elevated financial risk | Medium | Medium |
| Interest Coverage | Negative interest coverage (-0.4) raises bankruptcy concerns | Medium | High |
| Operational Efficiency | Asset turnover and fixed asset turnover at 0 imply poor utilization | High | Medium |
| Financial Health | Piotroski score of 3 indicates very weak financial condition | High | High |
| Market Valuation | Favorable P/B (1.38) but unfavorable P/E (-18.77) signals mixed signals | Medium | Medium |
Profitability and liquidity stand out as the most pressing risks. The firm’s negative margins and zero liquidity ratios are alarming in a cyclical chemical sector where cash flow stability is paramount. Additionally, poor interest coverage and a very weak Piotroski score highlight solvency challenges. Investors should weigh these against the company’s favorable WACC and dividend yield when considering exposure.
Should You Buy LyondellBasell Industries N.V.?
LyondellBasell appears to be grappling with declining profitability and a deteriorating competitive moat, evidenced by negative returns and value erosion. Despite a challenging leverage profile, its overall C+ rating suggests cautious investor interest amid operational headwinds.
Strength & Efficiency Pillars
LyondellBasell Industries N.V. shows operational resilience with a net margin of -2.46% and an EBIT margin of -0.68%, although both are unfavorable. Its return on invested capital (ROIC) stands at 5.9%, surpassing the weighted average cost of capital (WACC) at 5.31%, yet the company is shedding value due to declining profitability. Historically in this sector, maintaining ROIC above WACC signals value creation, but LYB’s shrinking margins temper this advantage, reflecting efficiency challenges amid market pressures.
Weaknesses and Drawbacks
The company faces significant financial strain. Despite an unavailable Altman Z-Score, LYB’s leverage is concerning, with a debt-to-equity ratio of 1.39 and negative interest coverage at -0.4, indicating difficulty servicing debt. Profitability metrics, including a negative ROE of -7.37%, and a bearish stock trend with a 44.6% price drop over the long term, elevate risk. Market dynamics show recent buyer dominance, but overall uncertainty remains, compounded by weak liquidity ratios (current and quick ratios at 0).
Our Final Verdict about LyondellBasell Industries N.V.
Without a definitive Altman Z-Score, LYB’s deteriorating profitability and weak leverage metrics suggest caution. Despite some recent buying interest and a slight ROIC advantage over WACC, the bearish long-term trend and financial stress imply the stock may appear too risky for conservative capital. Investors might consider a cautious stance, weighing operational improvements against solvency concerns before committing.
Disclaimer: This content is for informational purposes only and does not constitute financial, investment, or other professional advice. Investing in financial markets involves a significant risk of loss, and past performance is not indicative of future results.
Additional Resources
- Decoding LyondellBasell Industries NV (LYB): A Strategic SWOT In – GuruFocus (Feb 21, 2026)
- LyondellBasell Industries N.V. SEC 10-K Report – TradingView (Feb 20, 2026)
- LyondellBasell Industries N.V. (LYB): A Bull Case Theory – Yahoo Finance (Feb 04, 2026)
- LyondellBasell Slashes Dividend Amid ‘One Of The Longest Downturns In Chemical Industry’ – Benzinga (Feb 20, 2026)
- Cibc World Market Inc. Acquires 36,179 Shares of LyondellBasell Industries N.V. $LYB – InsuranceNewsNet (Feb 15, 2026)
For more information about LyondellBasell Industries N.V., please visit the official website: lyondellbasell.com