Home > Analyses > Consumer Cyclical > Lowe’s Companies, Inc.
Lowe’s shapes the very homes and neighborhoods where millions live and work every day. As a dominant force in the home improvement sector, it delivers a vast array of products and expert services that empower both DIY enthusiasts and professional contractors. Renowned for innovation and quality, Lowe’s commands a leading market position with nearly 2,000 stores nationwide. The key question now: does its strong brand and operational scale justify its current valuation and future growth prospects?

Table of contents
Business Model & Company Overview
Lowe’s Companies, Inc. operates as a leading home improvement retailer founded in 1921 and headquartered in Mooresville, North Carolina. The company commands a dominant market position with 1,971 stores across the US and internationally. Its ecosystem blends construction, repair, and decorating products with installation and repair services, serving homeowners, renters, and professionals alike. This integrated approach builds customer loyalty and brand strength in the competitive consumer cyclical sector.
Lowe’s revenue engine balances robust sales of appliances, tools, building materials, and decor with value-added services like extended protection plans and contractor installations. It leverages a multichannel presence through physical stores, e-commerce platforms, and mobile apps, targeting markets in the Americas, Europe, and Asia. This diversified footprint and service mix create a powerful economic moat, underpinning Lowe’s role as an industry shaper amid evolving consumer needs.
Financial Performance & Fundamental Metrics
I analyze Lowe’s Companies, Inc.’s income statement, key financial ratios, and dividend payout policy to assess its core financial health and shareholder value.
Income Statement
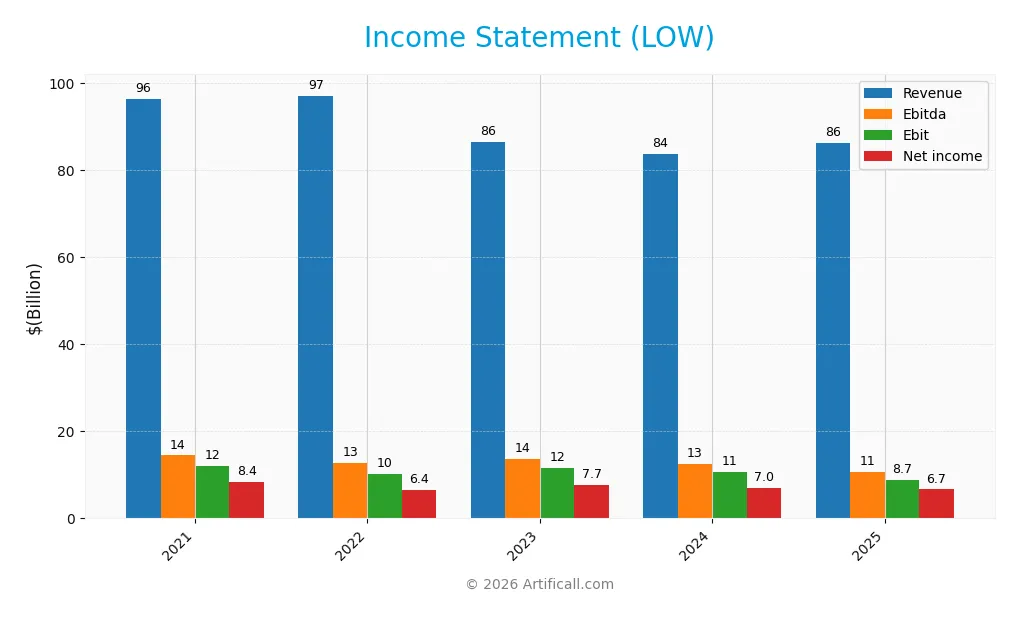
The table below summarizes Lowe’s Companies, Inc.’s key income statement metrics for fiscal years 2021 through 2025, reported in USD.
| 2021 | 2022 | 2023 | 2024 | 2025 | |
|---|---|---|---|---|---|
| Revenue | 96.3B | 97.1B | 86.4B | 83.7B | 86.3B |
| Cost of Revenue | 65.9B | 66.6B | 59.3B | 57.5B | 57.4B |
| Operating Expenses | 18.1B | 17.8B | 15.6B | 16.0B | 18.7B |
| Gross Profit | 30.4B | 30.5B | 27.1B | 26.1B | 28.9B |
| EBITDA | 14.5B | 12.7B | 13.6B | 12.6B | 10.7B |
| EBIT | 12.1B | 10.2B | 11.6B | 10.6B | 8.7B |
| Interest Expense | 0.9B | 1.1B | 1.5B | 1.5B | 1.4B |
| Net Income | 8.4B | 6.4B | 7.7B | 7.0B | 6.7B |
| EPS | 12.03 | 10.17 | 13.20 | 12.23 | 11.85 |
| Filing Date | 2022-03-21 | 2023-03-27 | 2024-03-25 | 2025-03-24 | 2026-03-23 |
Income Statement Evolution
Lowe’s revenue declined by 10.35% from 2021 to 2025, with a modest 3.12% increase in the latest year. Gross profit showed a favorable 10.47% growth last year, but EBIT and net income contracted by 17.65% and 21.18% over the overall period. Margins narrowed, reflecting pressure on profitability despite stable revenue.
Is the Income Statement Favorable?
In 2025, Lowe’s reported a 33.48% gross margin and a 7.71% net margin, both favorable compared to sector norms. However, EBIT fell 17.65% year-over-year, and net margin declined 7.25%, signaling rising costs or operational challenges. The company’s interest expense remains low at 1.63% of revenue, but overall fundamentals appear neutral to unfavorable given the declining profitability trends.
Financial Ratios
The following table summarizes key financial ratios for Lowe’s Companies, Inc. over the last five fiscal years:
| Ratios | 2021 | 2022 | 2023 | 2024 | 2025 |
|---|---|---|---|---|---|
| Net Margin | 8.8% | 6.6% | 8.9% | 8.3% | 7.7% |
| ROE | -175% | -45% | -51% | -49% | -67% |
| ROIC | 33% | 33% | 30% | 27% | 20% |
| P/E | 19.6 | 20.3 | 16.0 | 21.2 | 22.4 |
| P/B | -34.3 | -9.2 | -8.2 | -10.4 | -15.1 |
| Current Ratio | 1.02 | 1.10 | 1.23 | 1.09 | 1.08 |
| Quick Ratio | 0.12 | 0.15 | 0.14 | 0.16 | 0.19 |
| D/E | -6.1 | -2.7 | -2.7 | -2.8 | -0.7 |
| Debt-to-Assets | 63% | 84% | 93% | 89% | 13% |
| Interest Coverage | 14.3 | 11.1 | 7.8 | 6.9 | 7.2 |
| Asset Turnover | 2.08 | 2.14 | 1.99 | 1.88 | 1.59 |
| Fixed Asset Turnover | 4.15 | 4.60 | 4.04 | 3.91 | 3.81 |
| Dividend Yield | 1.20% | 1.81% | 2.04% | 1.74% | 1.77% |
All ratios are presented on a fiscal year basis ending January 31, except 2025 which ends January 30. Negative equity-related metrics reflect accounting or capital structure specifics.
Evolution of Financial Ratios
Return on Equity (ROE) for Lowe’s Companies, Inc. declined sharply, reaching -67.1% in 2025. The Current Ratio remained relatively stable, hovering near 1.08, signaling consistent liquidity. The Debt-to-Equity Ratio improved significantly to -0.72, indicating reduced reliance on equity financing. Profitability showed mixed trends with net margins steady around 7.7%, while operating margins slightly decreased.
Are the Financial Ratios Favorable?
In 2025, Lowe’s profitability presents a neutral net margin but an unfavorable ROE, reflecting challenges in equity returns. Liquidity ratios are mixed: a neutral current ratio contrasts with a weak quick ratio at 0.19. Leverage appears favorable, with a low debt-to-assets ratio of 13.3% and strong interest coverage at 6.22x. Efficiency metrics, including asset and fixed asset turnover, remain favorable. Overall, the ratios are slightly favorable, balancing strengths in leverage and efficiency against weak equity returns and liquidity.
Shareholder Return Policy
Lowe’s maintains a dividend payout ratio near 40%, with a steady dividend per share around $4.7 and a yield close to 1.77%. The company supports distributions with robust free cash flow, complemented by ongoing share buybacks.
This balanced approach appears sustainable, aligning dividend payments and buybacks with cash generation. It supports long-term shareholder value without risking over-distribution or excessive leverage.
Score analysis
Here is an overview of Lowe’s Companies, Inc. key valuation and financial performance scores:
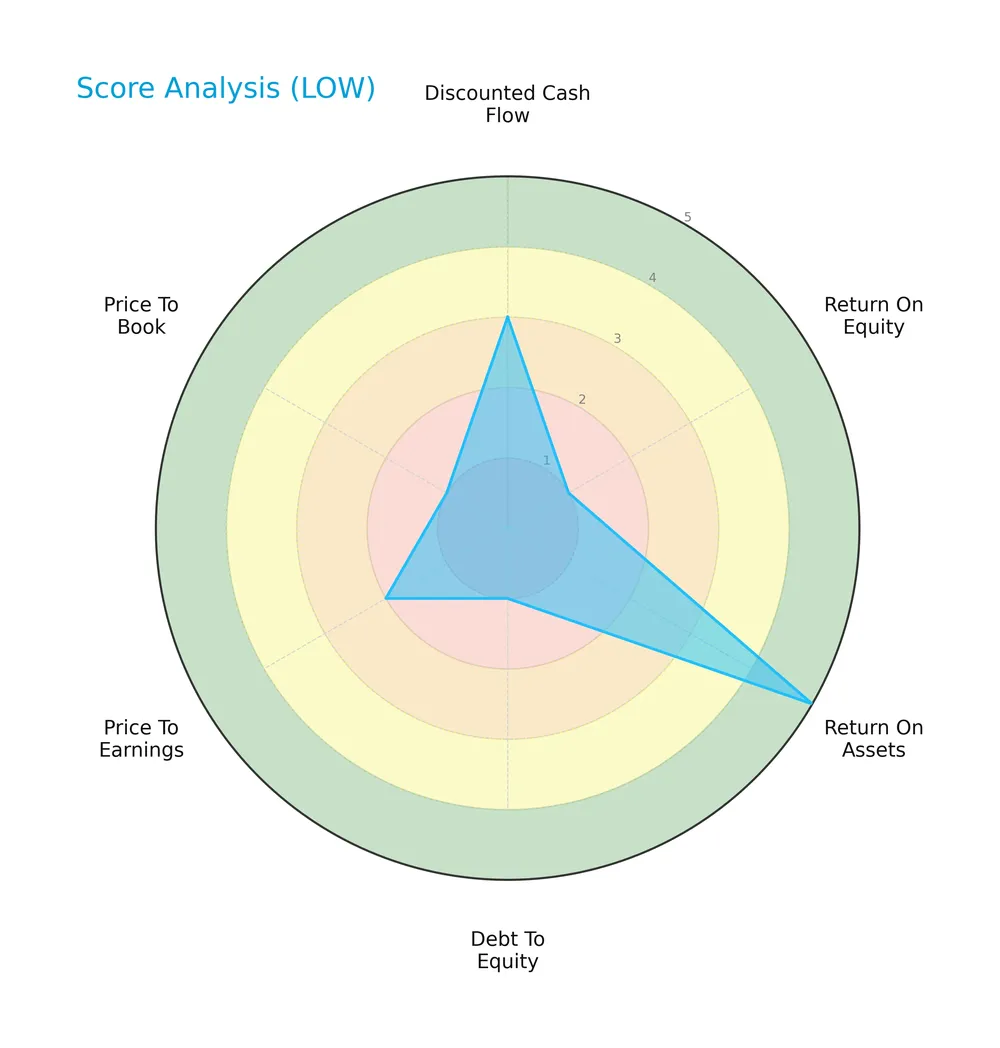
Lowe’s shows mixed financial strength with a moderate discounted cash flow score (3) and a very favorable return on assets score (5). However, it struggles with very unfavorable return on equity (1), debt-to-equity (1), and price-to-book scores (1), indicating structural challenges. Price-to-earnings is also unfavorable (2), reflecting valuation concerns.
Analysis of the company’s bankruptcy risk
The Altman Z-Score places Lowe’s comfortably in the safe zone, indicating a low risk of bankruptcy based on its current financial health:

Is the company in good financial health?
The Piotroski Score diagram highlights Lowe’s strong financial health status based on multiple profitability and efficiency criteria:

With a Piotroski Score of 7, Lowe’s demonstrates solid financial strength. This suggests good operational performance despite some valuation and leverage weaknesses.
Competitive Landscape & Sector Positioning
This sector analysis will examine Lowe’s strategic positioning, revenue streams, key products, and main competitors. I will assess whether Lowe’s holds a competitive advantage within the home improvement industry.
Strategic Positioning
Lowe’s concentrates its revenue in the U.S., generating $86.2B in 2025, with minimal international exposure ($61M). Its product portfolio is diversified across Building Products ($26.5B), Hardlines ($24.2B), and Home Decor ($31.5B), reflecting a broad home improvement focus.
Revenue by Segment
This pie chart illustrates Lowe’s revenue distribution by segment for the fiscal year 2025, highlighting the relative contribution of each business area.
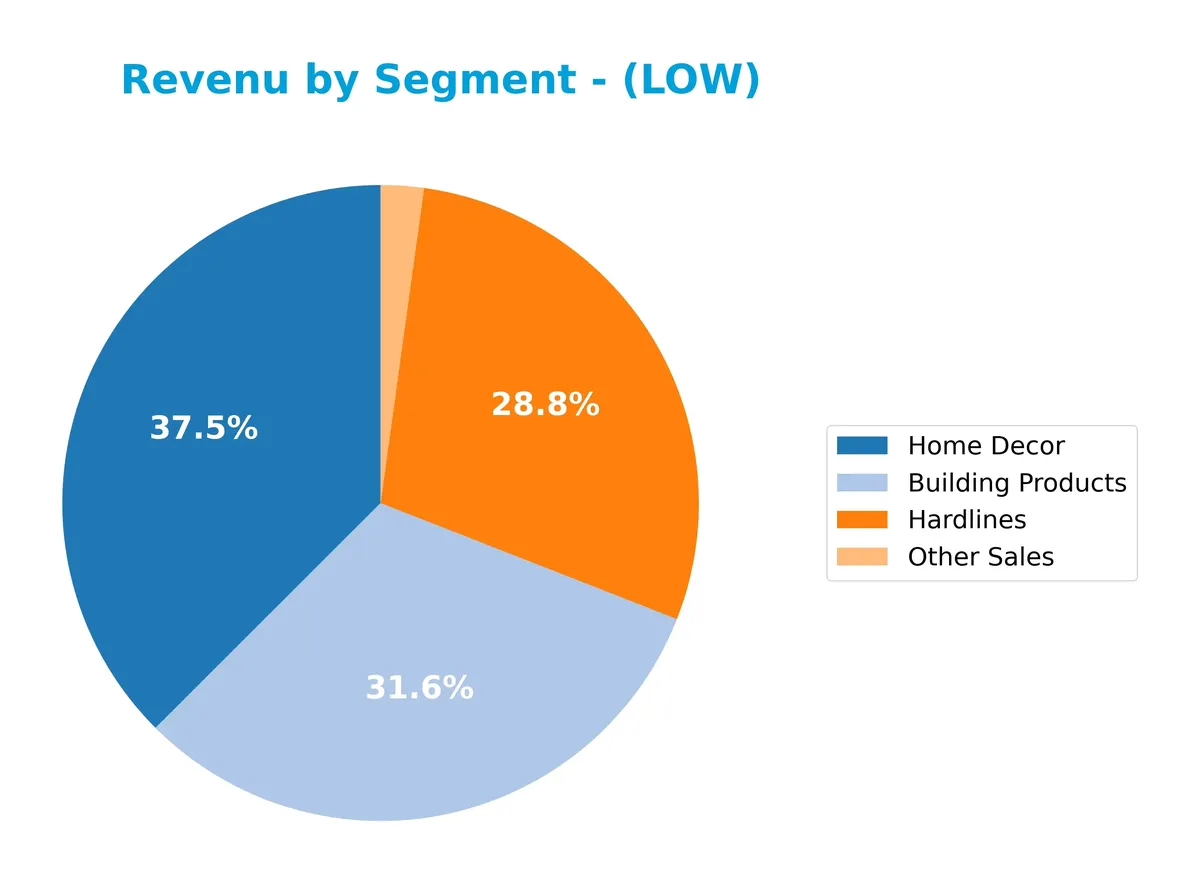
In 2025, Home Decor leads with $31.5B, closely followed by Building Products at $26.5B and Hardlines at $24.2B. Other Sales, at $1.8B, remains a minor contributor. The data shows a stable revenue mix with slight shifts favoring Home Decor, signaling a focus on consumer-centric products. This diversification reduces concentration risk while maintaining solid exposure to core building supplies.
Key Products & Brands
The table below summarizes Lowe’s key product categories and brand offerings based on recent fiscal data:
| Product | Description |
|---|---|
| Building Products | Includes materials for construction, maintenance, repair, and remodeling. |
| Hardlines | Comprises tools, hardware, electrical, plumbing, and related home improvement products. |
| Home Decor | Covers paint, lighting, flooring, millwork, and decorative items for interior design. |
| Other Sales | Encompasses installation services, protection plans, and repair services outside warranties. |
Lowe’s product mix focuses on home improvement essentials, spanning structural materials to decor. Its services segment complements merchandise with installation and repair, catering to both DIY consumers and professionals.
Main Competitors
There are 2 competitors in this sector; the table lists the top 10 leaders by market capitalization:
| Competitor | Market Cap. |
|---|---|
| The Home Depot, Inc. | 344B |
| Lowe’s Companies, Inc. | 138B |
Lowe’s ranks 2nd among its competitors with a market cap 37.5% the size of The Home Depot, the sector leader. It stands below both the average market cap of the top 10 and the median sector market cap. The company trails its closest rival by a substantial 166.5% margin.
Comparisons with competitors
Check out how we compare the company to its competitors:
Does LOW have a competitive advantage?
Lowe’s demonstrates a slight competitive advantage by generating returns on invested capital (ROIC) well above its weighted average cost of capital (WACC), indicating value creation. However, its ROIC has declined significantly over the past years, suggesting weakening profitability.
Looking ahead, Lowe’s maintains a broad product range and extensive store network, serving both U.S. and international markets. Opportunities exist in expanding installation services and e-commerce platforms, supporting potential growth despite recent margin pressures.
SWOT Analysis
This SWOT analysis identifies Lowe’s key internal and external factors to inform strategic decisions.
Strengths
- strong brand with 1,971 stores
- robust gross margin at 33.5%
- solid ROIC of 20.4% above WACC
Weaknesses
- declining ROIC trend
- weak quick ratio at 0.19 signals liquidity risk
- unfavorable net income growth over five years
Opportunities
- expanding e-commerce channels
- increasing demand for home improvement
- potential international market growth
Threats
- intense competition in retail sector
- economic downturns reduce discretionary spending
- supply chain disruptions impacting costs
Lowe’s maintains strong operational efficiency and brand presence, yet profitability erosion and liquidity concerns require attention. Growth depends on digital expansion and international sales, while economic and competitive pressures pose risks to sustain margins.
Stock Price Action Analysis
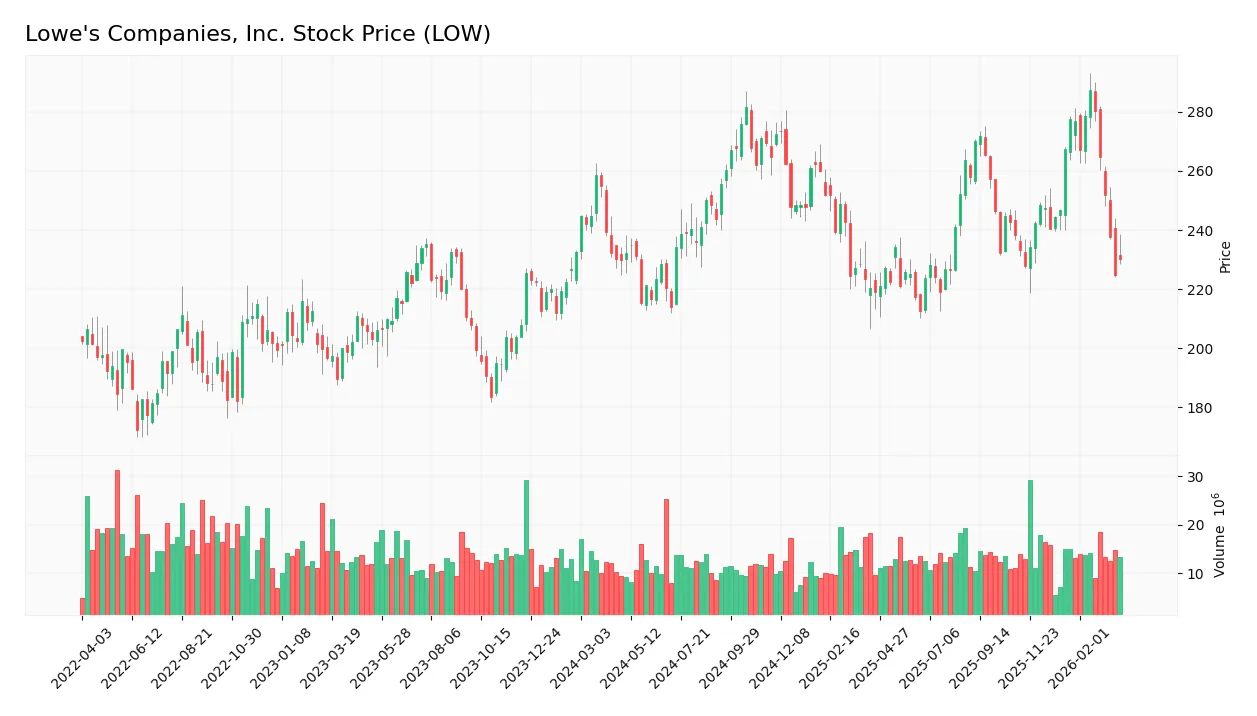
The weekly stock chart below displays Lowe’s Companies, Inc. (LOW) price movements over the past 100 weeks, highlighting key highs and lows with volatility insights:
Trend Analysis
Over the past 12 months, LOW’s stock price declined by 0.78%, signaling a bearish trend. The trend shows deceleration despite a high volatility level (std dev 18.94). The highest price reached 287.39, while the lowest dropped to 212.75, indicating notable price swings.
Volume Analysis
In the last three months, trading volume increased with seller dominance (57.2%). Buyer volume totaled 71.5M versus seller volume of 95.5M, reflecting cautious investor sentiment and stronger selling pressure. Market participation appears active but skewed toward exits.
Target Prices
Analysts present a solid target consensus for Lowe’s Companies, Inc. indicating strong upside potential.
| Target Low | Target High | Consensus |
|---|---|---|
| 230 | 325 | 288.25 |
The target range from 230 to 325 reflects optimistic market expectations. The consensus at 288.25 suggests confidence in Lowe’s growth trajectory.

Don’t Let Luck Decide Your Entry Point
Optimize your entry points with our advanced ProRealTime indicators. You’ll get efficient buy signals with precise price targets for maximum performance. Start outperforming now!
Analyst & Consumer Opinions
This section examines recent analyst ratings and consumer feedback related to Lowe’s Companies, Inc. (LOW).
Stock Grades
Here is the latest verified grading snapshot from established financial firms for Lowe’s Companies, Inc.:
| Grading Company | Action | New Grade | Date |
|---|---|---|---|
| Mizuho | Maintain | Outperform | 2026-02-27 |
| UBS | Maintain | Buy | 2026-02-26 |
| Evercore ISI Group | Maintain | In Line | 2026-02-26 |
| DA Davidson | Maintain | Neutral | 2026-02-26 |
| TD Cowen | Maintain | Hold | 2026-02-26 |
| Wells Fargo | Maintain | Overweight | 2026-02-26 |
| Piper Sandler | Maintain | Overweight | 2026-02-26 |
| Truist Securities | Maintain | Buy | 2026-02-26 |
| RBC Capital | Maintain | Sector Perform | 2026-02-26 |
| Bernstein | Maintain | Outperform | 2026-02-26 |
Most analysts maintain positive or neutral stances on Lowe’s, with a clear bias toward Outperform and Buy grades. The consensus signals a Buy, reflecting broad investor confidence tempered by some Hold and Neutral views.
Consumer Opinions
Lowe’s consistently earns praise for its product range and helpful staff, though some customers note issues with delivery speed and online ordering.
| Positive Reviews | Negative Reviews |
|---|---|
| Wide selection of home improvement items | Delays in delivery times |
| Knowledgeable and friendly store associates | Website navigation is confusing |
| Competitive prices on quality products | Occasional stock shortages |
Consumers appreciate Lowe’s strong in-store experience and value. However, e-commerce challenges and logistics remain areas for improvement. This mix reflects a retailer balancing robust physical operations with digital growing pains.
Risk Analysis
The table below summarizes key risks for Lowe’s Companies, Inc., focusing on likelihood and potential impact:
| Category | Description | Probability | Impact |
|---|---|---|---|
| Financial Health | Negative return on equity (-67.1%) signals weak shareholder returns | Medium | High |
| Liquidity | Low quick ratio (0.19) raises concerns about short-term cash flow | High | Medium |
| Market Volatility | Beta near 0.94 indicates moderate sensitivity to market swings | Medium | Medium |
| Valuation | Mixed signals from price-to-book (-15.05) and P/E (22.44) ratios | Medium | Medium |
| Debt Management | Favorable debt-to-assets (13.27%) and interest coverage (6.22) | Low | Low |
| Industry Cyclicality | Home improvement sector is sensitive to economic cycles | High | High |
Lowe’s faces notable risks from weak ROE and liquidity constraints. Despite a strong Altman Z-Score (3.18, safe zone), the low quick ratio warns of cash flow pressure. The home improvement sector’s cyclicality remains a key vulnerability, especially with slowing consumer demand in 2026. Investors must weigh these risks against stable debt levels and solid ROIC.
Should You Buy Lowe’s Companies, Inc.?
Lowe’s appears to be generating solid operational efficiency with a slightly favorable moat despite declining profitability. Its leverage profile seems manageable, supported by a safe-zone Altman Z-Score. Overall, the investment case could be seen as a cautious C+ rating.
Strength & Efficiency Pillars
Lowe’s Companies, Inc. demonstrates solid operational efficiency with a gross margin of 33.48% and an EBIT margin of 10.14%. The net margin stands at a respectable 7.71%. Despite a negative return on equity (-67.1%), the company’s return on invested capital (ROIC) of 20.42% exceeds its weighted average cost of capital (WACC) at 8.8%, signaling that Lowe’s remains a value creator. This efficiency suggests effective capital deployment, even as some profitability metrics show strain.
Weaknesses and Drawbacks
Lowe’s faces challenges despite its operational strengths. The price-to-earnings ratio at 22.44 is neutral but leans toward a premium valuation given recent earnings pressure. The quick ratio of 0.19 flags liquidity concerns, potentially limiting flexibility during downturns. The company’s bearish stock trend with a 13.81% price decline over the recent quarter, coupled with a slightly seller-dominant market (42.8% buyers), indicates near-term market headwinds. These factors warrant caution for investors seeking stability.
Our Final Verdict about Lowe’s Companies, Inc.
Lowe’s presents a fundamentally sound profile as a value creator with a strong Piotroski score of 7 and a safe Altman Z-Score of 3.18. However, despite these positives, recent bearish price action and seller dominance suggest the stock might appear risky in the short term. Investors may consider a wait-and-see approach for a more favorable entry, as the company’s operational strength contrasts with current market pressures.
Disclaimer: This content is for informational purposes only and does not constitute financial, investment, or other professional advice. Investing in financial markets involves a significant risk of loss, and past performance is not indicative of future results.
Additional Resources
- Dakota Wealth Management Acquires 6,915 Shares of Lowe’s Companies, Inc. $LOW – MarketBeat (Mar 28, 2026)
- Here is what to know beyond why Lowe’s Companies, Inc. (LOW) is a trending stock – MSN (Mar 25, 2026)
- Generate Investment Management Ltd Makes New Investment in Lowe’s Companies, Inc. $LOW – MarketBeat (Mar 28, 2026)
- LOWE’S COMPANIES, INC. DECLARES CASH DIVIDEND – PR Newswire (Mar 19, 2026)
- Lowe’s Companies Inc Stock (LOW) Moved Up by 4.46% on Mar 24: What Investors Need To Know – TradingKey (Mar 24, 2026)
For more information about Lowe’s Companies, Inc., please visit the official website: lowes.com