Home > Analyses > Financial Services > Loews Corporation
Loews Corporation powers everyday life by safeguarding businesses and communities with its diverse insurance solutions. It commands the property and casualty insurance sector with specialty products and risk management services that many depend on globally. Beyond insurance, Loews operates extensive natural gas pipelines and manufactures essential plastic containers, showcasing its industrial breadth. As innovation and market shifts accelerate, I question whether Loews’ robust fundamentals still warrant its current valuation and growth outlook.

Table of contents
Business Model & Company Overview
Loews Corporation, founded in 1969 and headquartered in New York City, commands a diversified industrial ecosystem spanning insurance, energy infrastructure, hospitality, and packaging. It dominates the Property & Casualty insurance sector with specialty coverages and risk management services, while also managing extensive natural gas pipelines and storage fields. Its multifaceted operations weave together to create a robust platform across various industries.
The company’s revenue engine balances recurring insurance premiums with steady cash flows from natural gas transportation and storage, complemented by earnings from a hotel chain and plastic container manufacturing. Loews leverages its presence in the Americas and key U.S. energy hubs, tapping into growing demand for infrastructure and specialty products. This diverse portfolio cultivates a durable economic moat rooted in scale, integrated assets, and cross-sector expertise.
Financial Performance & Fundamental Metrics
I analyze Loews Corporation’s income statement, key financial ratios, and dividend payout policy to assess its profitability, efficiency, and shareholder return strategy.
Income Statement
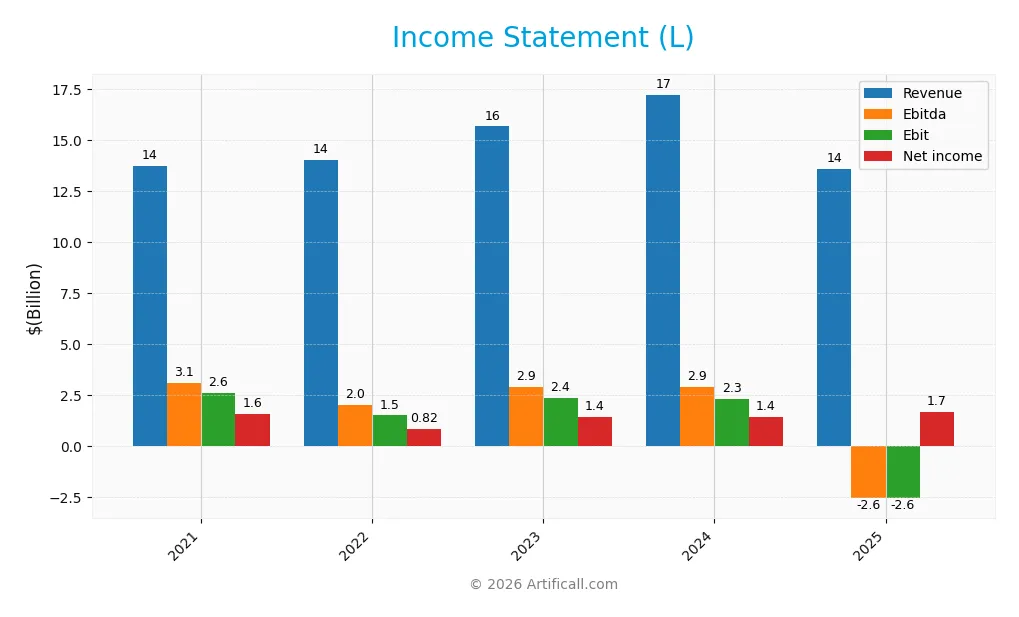
The following table summarizes Loews Corporation’s key income statement figures for fiscal years 2021 through 2025, reflecting revenue trends, profitability, and earnings per share.
| 2021 | 2022 | 2023 | 2024 | 2025 | |
|---|---|---|---|---|---|
| Revenue | 13.7B | 14.1B | 15.7B | 17.2B | 13.6B |
| Cost of Revenue | 7.8B | 8.1B | 8.7B | 9.5B | 0 |
| Operating Expenses | 3.8B | 4.8B | 5.0B | 5.8B | 0 |
| Gross Profit | 5.9B | 5.9B | 7.0B | 7.7B | 0 |
| EBITDA | 3.1B | 2.0B | 2.9B | 2.9B | -2.6B |
| EBIT | 2.6B | 1.5B | 2.4B | 2.3B | -2.6B |
| Interest Expense | 424M | 378M | 376M | 441M | 0 |
| Net Income | 1.6B | 822M | 1.4B | 1.4B | 1.7B |
| EPS | 6.02 | 3.39 | 6.30 | 6.42 | 7.97 |
| Filing Date | 2022-02-08 | 2023-02-07 | 2024-02-06 | 2025-02-11 | 2026-02-10 |
Income Statement Evolution
Between 2021 and 2025, Loews Corporation’s revenue declined slightly by 0.94%, with a sharper 21.12% drop in the last year. Net income, however, rose 6.72% overall, supported by a 7.73% increase in net margin. Gross margin turned unfavorable in 2025, reflecting zero reported gross profit, while net margin remained positive at 12.26%.
Is the Income Statement Favorable?
In 2025, Loews reported a net income of $1.67B on revenue of $13.6B, despite an operating loss of $2.57B. The company benefited from $4.86B in other income, offsetting negative operating results. Favorable factors include improved net margin and EPS growth, while declining revenue and negative EBIT margin pose risks. Overall, the income statement fundamentals appear generally favorable.
Financial Ratios
The table below presents key financial ratios for Loews Corporation from 2021 to 2025, illustrating profitability, valuation, liquidity, leverage, and efficiency metrics:
| Ratios | 2021 | 2022 | 2023 | 2024 | 2025 |
|---|---|---|---|---|---|
| Net Margin | 11.38% | 5.85% | 9.15% | 8.20% | 12.26% |
| ROE | 8.75% | 5.73% | 9.13% | 8.29% | 8.06% |
| ROIC | 18.12% | 1.04% | 1.43% | 298.80% | -4.39% |
| P/E | 9.60 | 17.23 | 11.04 | 13.19 | 13.21 |
| P/B | 0.84 | 0.99 | 1.01 | 1.09 | 1.06 |
| Current Ratio | 0 | 0 | 0 | 0 | 0 |
| Quick Ratio | 0 | 0 | 0 | 0 | 0 |
| D/E | 0.51 | 0.63 | 0.57 | 0.52 | 0.46 |
| Debt-to-Assets | 11.12% | 11.94% | 11.37% | 10.91% | 45.86% |
| Interest Coverage | 5.09 | 2.95 | 5.31 | 4.25 | 0 |
| Asset Turnover | 0.17 | 0.19 | 0.20 | 0.21 | 0.66 |
| Fixed Asset Turnover | 1.39 | 1.40 | 1.46 | 1.61 | 0 |
| Dividend Yield | 0.43% | 0.43% | 0.36% | 0.29% | 0.24% |
Evolution of Financial Ratios
Loews Corporation’s Return on Equity (ROE) displayed moderate fluctuation, peaking near 9% in 2023 and declining to 8.06% by 2025. The Current Ratio remained at zero throughout, indicating persistent liquidity concerns. The Debt-to-Equity Ratio improved slightly from 0.63 in 2022 to 0.46 in 2025, signaling a modest reduction in leverage. Profitability showed mixed trends, with net margins rising to 12.26% in 2025 despite operational margin volatility.
Are the Financial Ratios Fovorable?
In 2025, Loews’ profitability is favorable with a 12.26% net margin and a price-to-earnings ratio of 13.21. However, ROE and Return on Invested Capital (ROIC) are unfavorable, with ROIC deeply negative at -438.92%. Liquidity ratios like Current and Quick Ratio are zero, raising red flags. Leverage metrics are mixed: Debt-to-Equity is favorable at 0.46, but interest coverage is zero, indicating potential risk. Overall, the ratios lean slightly unfavorable.
Shareholder Return Policy
Loews Corporation maintains a consistent dividend payout ratio around 3-7%, with a stable dividend per share near $0.25 and an annual yield below 0.5%. The payout is modest relative to earnings, suggesting prudent coverage by free cash flow, though share buyback activity is not indicated.
This conservative distribution aligns with sustainable shareholder value creation, balancing income with capital retention. The low dividend yield and cautious payout ratio imply management prioritizes financial flexibility over aggressive returns, which supports long-term resilience amid market fluctuations.
Score analysis
The following radar chart outlines Loews Corporation’s key financial scores across valuation, profitability, and leverage metrics:
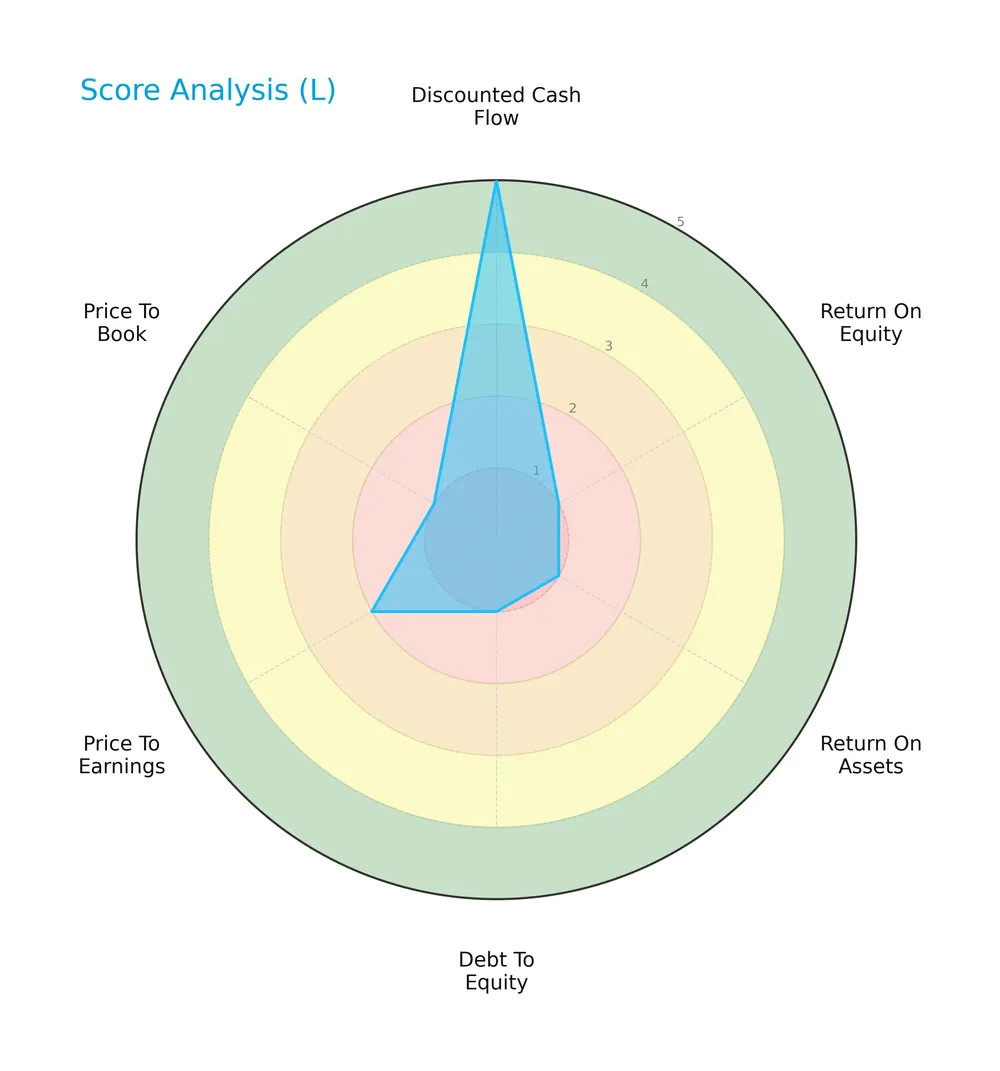
Loews shows a very favorable discounted cash flow score of 5. However, profitability metrics like ROE and ROA both score very unfavorably at 1. Leverage and valuation scores also remain weak, indicating overall financial challenges.
Analysis of the company’s bankruptcy risk
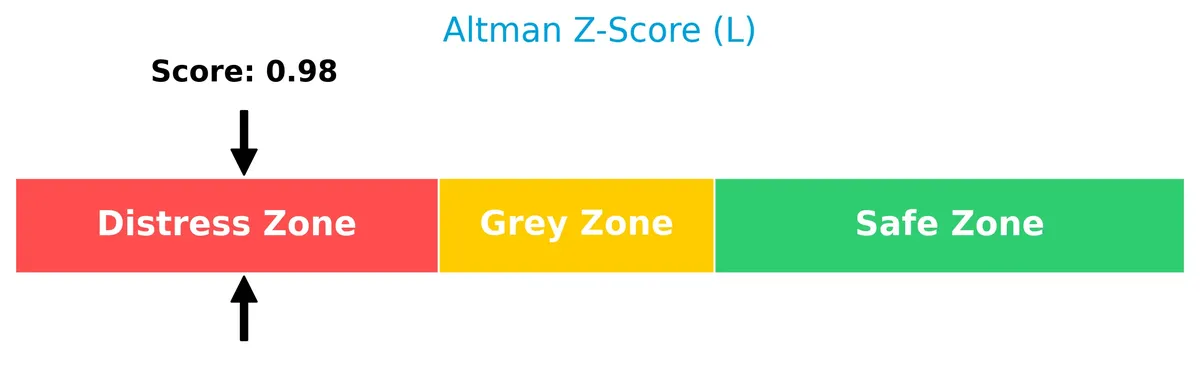
Loews Corporation’s Altman Z-Score places it in the distress zone, signaling a high risk of financial distress and potential bankruptcy:
Is the company in good financial health?
This Piotroski score diagram illustrates Loews Corporation’s financial strength based on nine key accounting criteria:
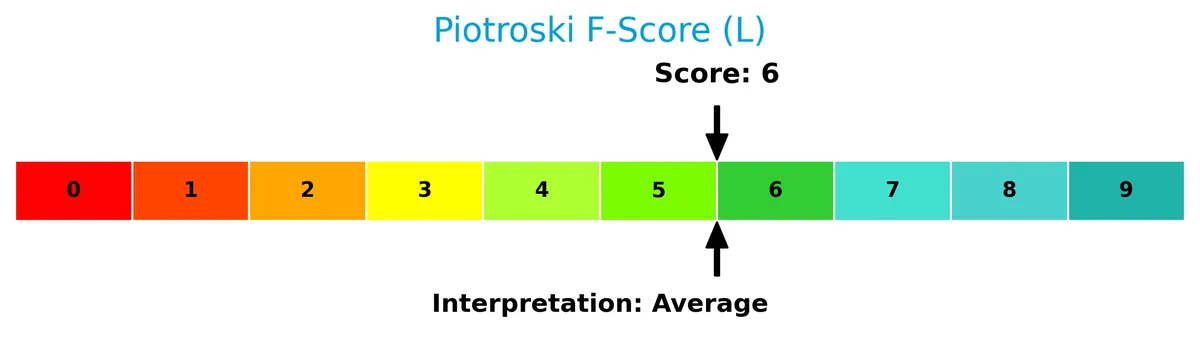
With a Piotroski Score of 6, Loews falls into the average category, suggesting moderate financial health but room for improvement in operational efficiency and profitability.
Competitive Landscape & Sector Positioning
This analysis examines Loews Corporation’s strategic positioning within the financial services sector. It explores its revenue composition, key products, and main competitors. I will assess whether Loews holds a competitive advantage over its industry peers.
Strategic Positioning
Loews Corporation maintains a diversified portfolio across insurance, energy infrastructure, and hospitality. CNA Financial dominates with $15B revenue in 2025, followed by Boardwalk Pipeline at $9.9B and Loews Hotels at $945M. Its geographic reach spans the US and international markets.
Revenue by Segment
This pie chart displays Loews Corporation’s revenue distribution across its main business segments for the fiscal year 2025.
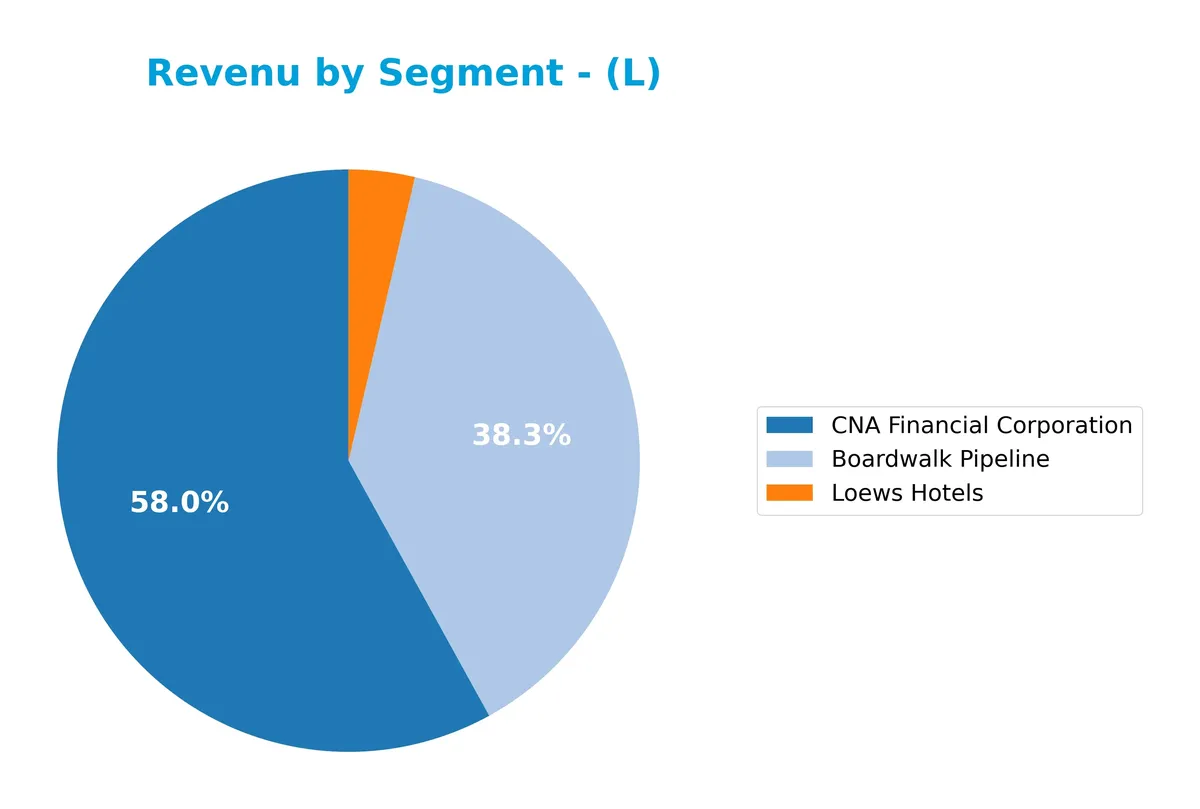
In 2025, CNA Financial Corporation remains the dominant revenue driver at 15B, reflecting consistent growth over recent years. Boardwalk Pipeline surged to 9.9B, marking a significant rebound from prior years’ lows. Loews Hotels contributed a smaller but steady 945M, showing resilience. The business continues to concentrate heavily in financial services, while pipeline operations demonstrate recent acceleration, signaling evolving segment dynamics.
Key Products & Brands
The table below summarizes Loews Corporation’s key products and brands with their core business descriptions:
| Product | Description |
|---|---|
| CNA Financial Corporation | Provides commercial property and casualty insurance, including specialty liability, property, marine, workers’ compensation, and more. |
| Boardwalk Pipeline | Operates natural gas and NGL transportation and storage through pipelines, underground storage fields, and brine infrastructure. |
| Loews Hotels | Manages a chain of 26 hotels, offering hospitality services across various locations. |
Loews derives most revenue from CNA Financial’s insurance products. Boardwalk Pipeline supports its energy infrastructure segment, while Loews Hotels contributes through hospitality operations. This diversified portfolio spans insurance, energy logistics, and lodging.
Main Competitors
There are 7 competitors in the Financial Services sector, with this table showing the top 7 leaders by market capitalization:
| Competitor | Market Cap. |
|---|---|
| The Progressive Corporation | 124.4B |
| Chubb Limited | 124.1B |
| The Travelers Companies, Inc. | 64.4B |
| The Allstate Corporation | 53.9B |
| W. R. Berkley Corporation | 26.4B |
| Cincinnati Financial Corporation | 25.2B |
| Loews Corporation | 21.6B |
Loews Corporation ranks 7th among its competitors with a market cap at 18.3% of the sector leader. It sits below both the average top 10 market cap of 62.9B and the sector median of 53.9B. Loews maintains an 11.0% market cap gap below its nearest competitor, indicating a smaller scale relative to peers.
Comparisons with competitors
Check out how we compare the company to its competitors:
Does Loews Corporation have a competitive advantage?
Loews Corporation currently lacks a competitive advantage, as it is destroying value with a sharply declining ROIC far below its WACC. This trend signals inefficient capital use and deteriorating profitability over recent years.
Looking ahead, Loews operates across diverse sectors including insurance, natural gas pipelines, plastics, and hospitality. Future growth opportunities may arise from expanding specialty insurance products and pipeline infrastructure, though value creation remains uncertain.
SWOT Analysis
This SWOT analysis highlights Loews Corporation’s key internal and external factors shaping its strategic outlook.
Strengths
- diversified business segments
- stable net margin of 12.3%
- strong market position in insurance and energy
Weaknesses
- declining ROIC indicates value destruction
- negative EBIT margin at -18.9%
- weak liquidity ratios signal financial stress
Opportunities
- expansion in natural gas infrastructure
- growth in specialty insurance markets
- leveraging recycled plastic products
Threats
- volatile commodity prices impacting energy segment
- increasing regulatory pressures
- competitive insurance market compressing margins
Loews faces significant value erosion despite solid net profitability. Strategic focus must prioritize operational efficiency and capital discipline to reverse declining returns and improve liquidity.
Stock Price Action Analysis
The weekly stock chart for Loews Corporation (ticker: L) illustrates price movements and volatility over the last 100 weeks:
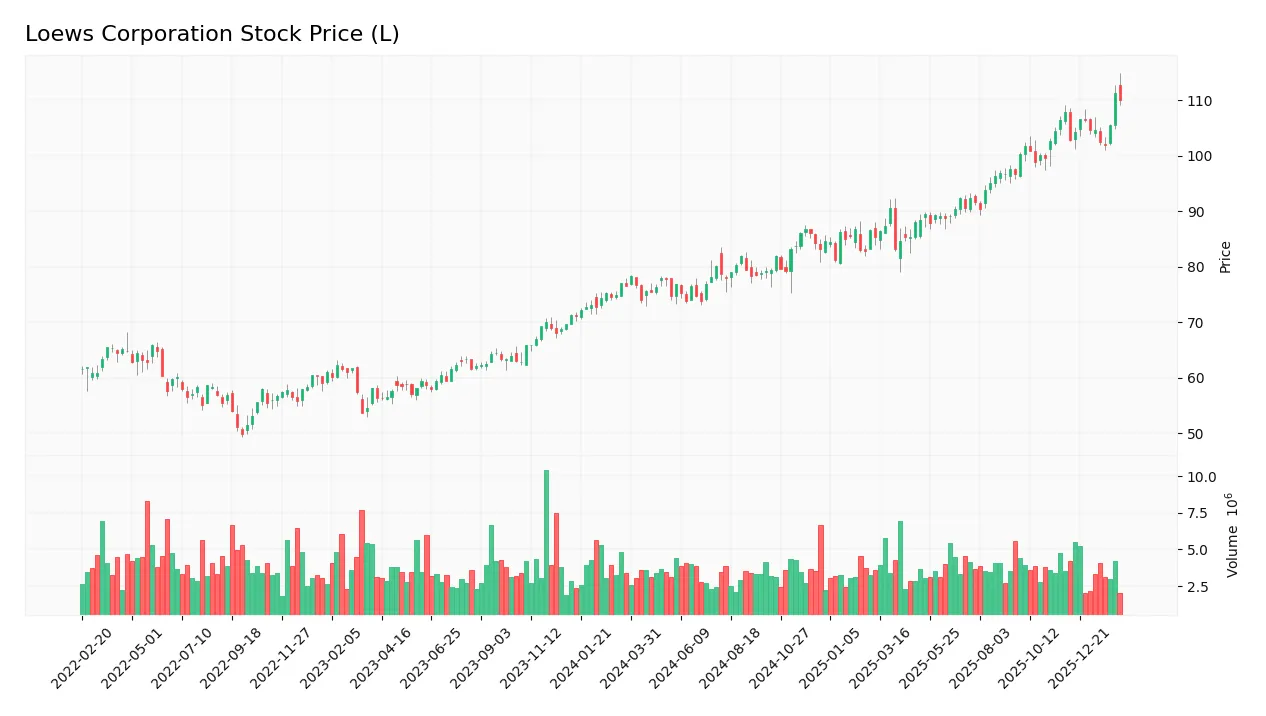
Trend Analysis
Over the past 12 months, Loews Corporation’s stock price rose by 43.83%, indicating a strong bullish trend. The price peaked at 111.27 and bottomed at 73.76. Volatility, measured by a 10.06 standard deviation, shows notable price swings. However, recent momentum shows deceleration despite positive gains.
Volume Analysis
Trading volume totals 441M shares, with buyers accounting for 58%, signaling buyer-driven activity overall. Volume is decreasing, reflecting reduced market participation. In the last three months, buyer dominance narrows to 50.65%, indicating neutral investor sentiment and balanced supply-demand dynamics.
Target Prices
No verified target price data is available from recognized analysts for Loews Corporation. Market sentiment remains mixed, reflecting uncertainty in the sector.

Don’t Let Luck Decide Your Entry Point
Optimize your entry points with our advanced ProRealTime indicators. You’ll get efficient buy signals with precise price targets for maximum performance. Start outperforming now!
Analyst & Consumer Opinions
This section examines Loews Corporation’s recent analyst ratings alongside consumer feedback trends and sentiment data.
Stock Grades
Here are the recent verified stock grades for Loews Corporation from leading financial institutions:
| Grading Company | Action | New Grade | Date |
|---|---|---|---|
| RBC Capital | maintain | Outperform | 2025-05-27 |
| Deutsche Bank | maintain | Hold | 2018-08-01 |
| Deutsche Bank | maintain | Hold | 2018-07-31 |
| Deutsche Bank | maintain | Hold | 2015-11-06 |
| Deutsche Bank | maintain | Hold | 2015-11-05 |
| JP Morgan | maintain | Hold | 2014-08-08 |
| JP Morgan | maintain | Hold | 2014-08-07 |
| Deutsche Bank | downgrade | Hold | 2014-03-24 |
| Deutsche Bank | downgrade | Hold | 2014-03-23 |
| Deutsche Bank | maintain | Buy | 2013-09-04 |
The consensus shows a cautious but generally positive outlook, with grades mostly holding at “Hold” and the latest from RBC Capital marking “Outperform.” This reflects moderate confidence without strong buy signals.
Consumer Opinions
Loews Corporation sparks diverse reactions from its consumer base, reflecting a mix of solid reliability and areas needing improvement.
| Positive Reviews | Negative Reviews |
|---|---|
| Reliable service and consistent performance | Customer support response times are slow |
| Strong reputation in energy and insurance | Pricing can be higher than competitors |
| Transparent communication during crises | Limited product innovation noted |
Overall, consumers praise Loews for its dependable services and transparency. However, slow support and pricing concerns appear regularly, indicating areas where the company must sharpen its competitive edge.
Risk Analysis
The table below outlines key risks Loews Corporation faces, with probability and impact estimates:
| Category | Description | Probability | Impact |
|---|---|---|---|
| Financial Distress | Altman Z-Score signals high bankruptcy risk; liquidity ratios at zero indicate cash flow risk | High | High |
| Profitability Weakness | Negative ROIC (-439%) despite favorable net margin suggests poor capital allocation | Medium | High |
| Debt and Leverage | Moderate debt-to-assets (46%) but unfavorable debt-to-equity and interest coverage ratios | Medium | Medium |
| Market Valuation | Low P/E (13.2) and P/B (~1.06) are positive but accompanied by unfavorable valuation scores | Low | Medium |
| Dividend Yield | Very low dividend yield (0.24%) may deter income-focused investors | Medium | Low |
Loews faces critical financial distress risks, notably a distress-zone Altman Z-score and zero liquidity ratios. This signals urgent attention to short-term solvency. Poor ROIC reflects inefficient capital use despite decent net margins. I see leverage as manageable but watch interest coverage closely. These risks overshadow the modest valuation appeal and low dividends.
Should You Buy Loews Corporation?
Loews Corporation appears to be shedding value with a declining profitability trend and a very unfavorable moat. Despite manageable leverage concerns, its overall rating of C suggests caution, supported by distress-level financial health and average operational efficiency.
Strength & Efficiency Pillars
Loews Corporation posts a net margin of 12.26%, signaling operational profitability despite challenges. However, the return on equity at 8.06% and return on invested capital (ROIC) at -438.92% reflect inefficiencies in capital utilization. With ROIC significantly below the weighted average cost of capital (WACC) at 5.43%, the company is not a value creator. Operational margins show some resilience, but the overall capital allocation fails to generate shareholder value.
Weaknesses and Drawbacks
The company is in financial distress, indicated by a critical Altman Z-Score of 0.98, placing it firmly in the Distress Zone and signaling a high bankruptcy risk. Leverage metrics show a mixed picture; debt-to-equity is reasonable at 0.46, but liquidity ratios are alarming, with both current and quick ratios at 0, flagging severe short-term solvency issues. Valuation appears modest with a P/E of 13.21 and P/B of 1.06, yet these do not offset the solvency concerns. Market pressure is neutral, but the distress status overshadows any positives.
Our Final Verdict about Loews Corporation
Despite a favorable net margin and some operational strengths, the company’s solvency risk, highlighted by its Altman Z-Score in the Distress Zone, renders the investment profile highly speculative. This financial fragility outweighs profitability and growth metrics, making Loews too risky for conservative capital. Investors might consider this a cautious watch rather than an immediate opportunity.
Disclaimer: This content is for informational purposes only and does not constitute financial, investment, or other professional advice. Investing in financial markets involves a significant risk of loss, and past performance is not indicative of future results.
Additional Resources
- Loews pays 6.25-cent dividend to shareholders on March 10 – Stock Titan (Feb 10, 2026)
- LOEWS CORP SEC 10-K Report – TradingView (Feb 10, 2026)
- Loews Corp files for senior notes offering, size not disclosed – marketscreener.com (Feb 10, 2026)
- LOEWS CORPORATION REPORTS NET INCOME OF $402 MILLION FOR THE FOURTH QUARTER OF 2025 AND $1,667 MILLION FOR THE FULL YEAR – Yahoo Finance (Feb 09, 2026)
- Loews reports higher Q4 and full-year profit – Proactive financial news (Feb 09, 2026)
For more information about Loews Corporation, please visit the official website: loews.com