Home > Analyses > Communication Services > Live Nation Entertainment, Inc.
Live Nation Entertainment transforms how millions experience live events, powering the heartbeat of global music culture. It commands the entertainment sector through its unrivaled concert promotions, ticketing platforms, and immersive sponsorships. Known for owning and operating premier venues worldwide, Live Nation sets industry standards in innovation and scale. As the live entertainment landscape evolves, I question whether Live Nation’s strong brand and expansive reach continue to justify its premium valuation and growth expectations.

Table of contents
Business Model & Company Overview
Live Nation Entertainment, Inc., founded in 2005 and headquartered in Beverly Hills, CA, dominates the live entertainment industry. It integrates concerts, ticketing, and sponsorship into a seamless ecosystem that drives global fan engagement. The company operates or leases 259 venues worldwide, orchestrates music festivals, and manages artist services, positioning itself as a key player in live events.
Its revenue engine balances hardware—venues and event production—with software and services via ticketing platforms, including Ticketmaster. Live Nation’s global footprint spans the Americas, Europe, and Asia, leveraging sponsorships and advertising to monetize its expansive audience. This multi-faceted approach builds a formidable economic moat, securing its leadership in shaping live entertainment’s future.
Financial Performance & Fundamental Metrics
I analyze Live Nation Entertainment, Inc.’s income statement, key financial ratios, and dividend payout policy to reveal its core profitability and shareholder value dynamics.
Income Statement
The table below summarizes Live Nation Entertainment, Inc.’s key income statement metrics for fiscal years 2021 through 2025, reflecting revenue growth and profitability trends.

| 2021 | 2022 | 2023 | 2024 | 2025 | |
|---|---|---|---|---|---|
| Revenue | 6.3B | 16.7B | 22.7B | 23.2B | 25.2B |
| Cost of Revenue | 4.4B | 12.3B | 17.3B | 17.3B | 19.4B |
| Operating Expenses | 2.3B | 3.6B | 4.4B | 5.0B | 4.3B |
| Gross Profit | 1.9B | 4.3B | 5.5B | 5.8B | 5.8B |
| EBITDA | 87M | 1.2B | 1.8B | 1.6B | 2.2B |
| EBIT | -329M | 769M | 1.3B | 1.1B | 1.5B |
| Interest Expense | 282M | 278M | 350M | 326M | 316M |
| Net Income | -651M | 266M | 557M | 896M | -55M |
| EPS | -3.09 | 0.66 | 1.35 | 2.77 | -0.24 |
| Filing Date | 2022-02-23 | 2023-02-23 | 2024-02-22 | 2025-02-21 | 2026-02-19 |
Income Statement Evolution
Live Nation’s revenue surged 302% from 2021 to 2025, with an 8.8% growth in the latest year. Gross profit remained stable, showing a slight 0.5% decline last year. EBIT grew 39.3% in 2025, reflecting margin expansion, while net income rose overall but dropped nearly 50% recently. Margins display mixed signals—gross margin steady, net margin declining.
Is the Income Statement Favorable?
The 2025 income statement reveals favorable revenue growth and improving EBIT margin near 5.9%, indicating operational efficiency gains. However, net margin contracted to 1.97%, and EPS turned negative at -0.24, signaling bottom-line pressure. Interest expense remains manageable at 1.25% of revenue. Overall, fundamentals skew favorable despite margin compression and net income challenges.
Financial Ratios
The table below presents key financial ratios for Live Nation Entertainment, Inc. from 2021 to 2025, illustrating profitability, liquidity, leverage, and market valuation metrics:
| Ratios | 2021 | 2022 | 2023 | 2024 | 2025 |
|---|---|---|---|---|---|
| Net Margin | -10.38% | 1.60% | 2.45% | 3.87% | 1.97% |
| ROE | 1.12% | -0.72% | -32.48% | 5.17% | 1.83% |
| ROIC | -5.04% | 6.18% | 8.07% | 7.71% | 7.87% |
| P/E | -39.94 | 58.84 | 38.43 | 33.25 | 66.61 |
| P/B | -44.62 | -42.65 | -1247.94 | 172.00 | 121.91 |
| Current Ratio | 0.97 | 0.98 | 0.96 | 0.99 | 1.00 |
| Quick Ratio | 0.97 | 0.98 | 0.95 | 0.99 | 1.00 |
| D/E | -12.80 | -20.94 | -492.06 | 47.74 | 45.91 |
| Debt-to-Assets | 51.80% | 46.77% | 44.24% | 42.12% | 54.30% |
| Interest Coverage | -1.48 | 2.59 | 3.10 | 2.53 | 4.70 |
| Asset Turnover | 0.44 | 1.01 | 1.19 | 1.18 | 1.10 |
| Fixed Asset Turnover | 2.38 | 5.45 | 6.13 | 5.70 | 4.77 |
| Dividend Yield | 0.00% | 0.00% | 0.00% | 0.00% | 0.00% |
Evolution of Financial Ratios
Return on Equity (ROE) surged sharply to 183.01% in 2025, signaling improved shareholder returns. The Current Ratio hovered near 1.0, indicating stable but tight liquidity. Debt-to-Equity Ratio remained high at 45.91, reflecting persistent leverage. Profitability showed mixed signals with net margin declining to 1.97%, despite ROE strength.
Are the Financial Ratios Favorable?
Profitability is mixed: ROE is favorable, but net margin and P/E ratio are unfavorable. Liquidity ratios (Current and Quick) are neutral to unfavorable, signaling limited short-term buffer. Leverage metrics, including Debt-to-Equity and Debt-to-Assets, are unfavorable due to high debt levels. Asset turnover and fixed asset turnover are favorable, showing efficient use of assets. Overall, the ratios suggest a slightly unfavorable financial profile in 2025.
Shareholder Return Policy
Live Nation Entertainment, Inc. does not pay dividends, reflecting a reinvestment strategy likely aimed at fueling growth or funding operations. The company engages in share buybacks, which may offer an alternative form of shareholder return.
This approach aligns with sustainable long-term value creation if reinvestments generate returns exceeding capital costs. However, the absence of dividends requires scrutiny of cash flow sufficiency and buyback discipline to avoid excessive capital deployment risks.
Score analysis
The following radar chart illustrates Live Nation Entertainment’s key financial scores across valuation, profitability, and leverage metrics:
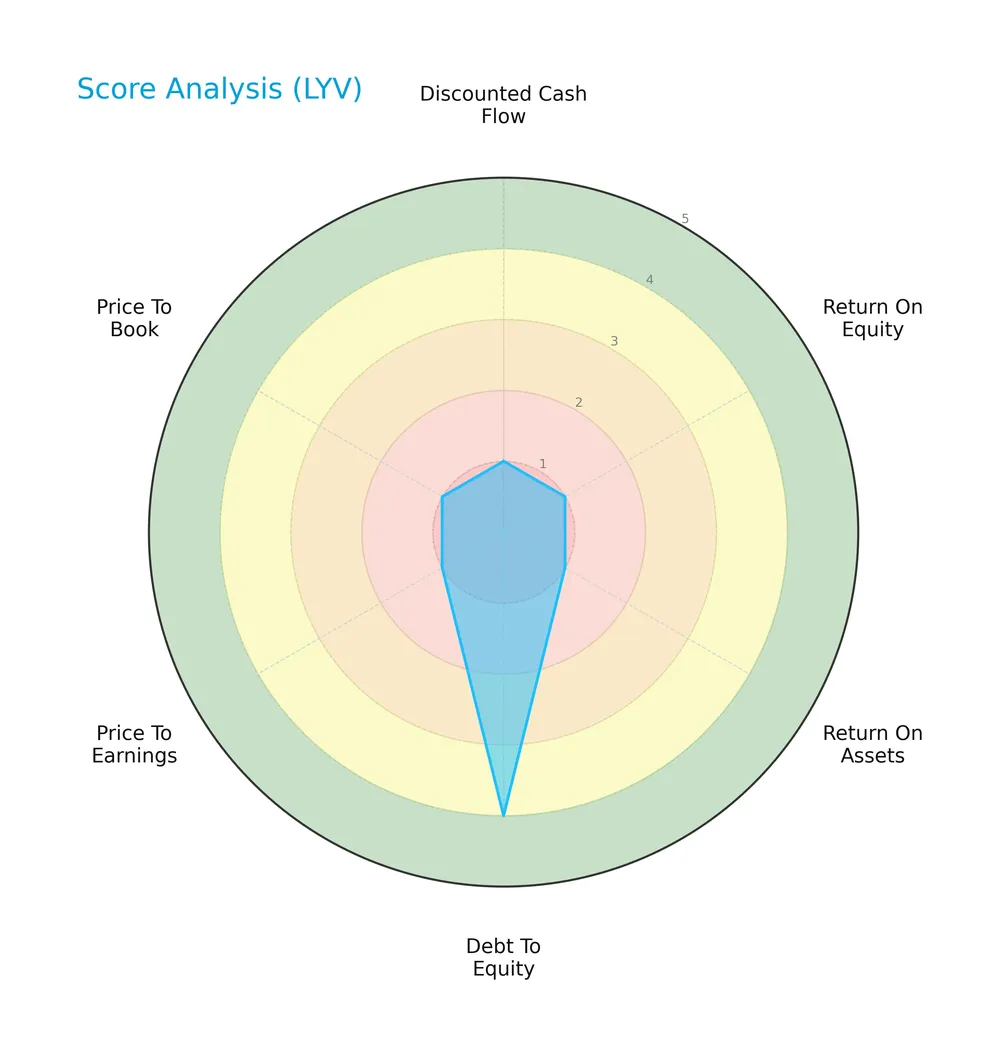
Live Nation scores very low in discounted cash flow, return on equity, return on assets, price-to-earnings, and price-to-book ratios, indicating unfavorable valuation and profitability. Its debt-to-equity score is comparatively favorable, reflecting prudent leverage management.
Analysis of the company’s bankruptcy risk
Live Nation’s Altman Z-Score places it in the grey zone, signaling moderate bankruptcy risk and financial uncertainty:

Is the company in good financial health?
The Piotroski Score diagram highlights Live Nation’s average financial health based on profitability, leverage, and liquidity criteria:

With a score of 5, Live Nation reflects moderate financial strength but lacks clear indicators of strong or weak performance.
Competitive Landscape & Sector Positioning
This analysis explores Live Nation Entertainment’s strategic role within the communication services sector. It examines revenue sources, key products, and major competitors. I will assess whether Live Nation holds a competitive advantage over its peers.
Strategic Positioning
Live Nation Entertainment concentrates its portfolio in live entertainment, with Concerts dominating revenue at $19B in 2025. It diversifies geographically, generating $14.3B domestically and $15.9B internationally, notably $5.8B from Europe, reflecting broad global exposure across its three core segments.
Revenue by Segment
This pie chart illustrates Live Nation Entertainment’s revenue distribution by segment for the fiscal year 2025, highlighting the relative contribution of each business line.

In 2025, Concerts generated $3.3B, Sponsorship and Advertising $1.7B, and Ticketing $205M. Concerts remain the dominant driver, though revenue sharply declined from previous years, signaling potential volatility or sector disruption. Sponsorships gained traction, now a significant secondary revenue source. Ticketing revenue contracted substantially, indicating a shift in business mix and concentration risk in live events. This uneven recovery warrants cautious optimism.
Key Products & Brands
Live Nation Entertainment’s main revenue streams and offerings include the following key products and brands:
| Product | Description |
|---|---|
| Concerts | Promotes live music events at owned, operated, or rented venues; manages venues; produces festivals; artist services. |
| Ticketing | Provides ticketing software and services via Live Nation and Ticketmaster websites; handles ticket resale. |
| Sponsorship & Advertising | Sells sponsorships and advertising across venues, events, and digital platforms; develops custom brand programs. |
Live Nation dominates live entertainment through its integrated model of concerts, ticketing, and sponsorship. Concerts generate the majority of revenue, supported by ticketing technology and advertising partnerships.
Main Competitors
Live Nation Entertainment, Inc. operates among 8 competitors in the Communication Services sector; the table lists the top 8 leaders by market capitalization:
| Competitor | Market Cap. |
|---|---|
| Netflix, Inc. | 385B |
| Warner Bros. Discovery, Inc. | 71B |
| Live Nation Entertainment, Inc. | 34B |
| Fox Corporation | 33B |
| TKO Group Holdings, Inc. | 17B |
| News Corporation | 17B |
| News Corporation | 15B |
| Paramount Skydance Corporation Class B Common Stock | 14B |
Live Nation ranks 3rd in market capitalization among its competitors. Its market cap equals 9.8% of Netflix’s, the sector leader. The company is below the average market cap of the top 10 (73B) but above the sector median (25B). It enjoys a significant 87% market cap gap over its closest rival above.
Comparisons with competitors
Check out how we compare the company to its competitors:
Does LYV have a competitive advantage?
Live Nation Entertainment, Inc. does not yet demonstrate a clear competitive advantage, as it currently sheds value with ROIC below WACC. However, its profitability is steadily improving, indicating potential for stronger returns.
The company’s future outlook includes expanding international venues and growing sponsorship and advertising opportunities. Continued innovation in ticketing technology and event management could further enhance its market presence.
SWOT Analysis
This SWOT analysis highlights Live Nation Entertainment’s key strategic factors impacting its competitive position and growth prospects.
Strengths
- Leading global live entertainment platform
- Strong venue ownership and management
- Diversified revenue streams across concerts, ticketing, and sponsorship
Weaknesses
- High debt levels constrain financial flexibility
- Low current ratio signals liquidity risk
- Elevated valuation multiples raise concerns
Opportunities
- Expanding international operations, especially in Europe
- Growing digital ticketing and advertising markets
- Rising demand for live events post-pandemic
Threats
- Economic downturns reducing discretionary spending
- Competition from emerging entertainment platforms
- Regulatory risks in ticketing and venue operations
Live Nation leverages its scale and diversified model to capture growth, but financial leverage and valuation risks warrant caution. Strategic focus should balance expansion with prudent capital management.
Stock Price Action Analysis
The following weekly chart illustrates Live Nation Entertainment’s stock price movements, highlighting key fluctuations and momentum shifts over the past 100 weeks:

Trend Analysis
Over the past 100 weeks, LYV’s stock price increased by 53.8%, indicating a strong bullish trend with accelerating momentum. The price ranged from a low of 88.75 to a high of 173.73, with volatility reflected in a 23.41 standard deviation, confirming significant price swings during this period.
Volume Analysis
Over the last three months, trading volume increased, driven predominantly by buyers who accounted for 60.25% of activity. This buyer dominance amid rising volume suggests growing investor confidence and heightened market participation in LYV’s shares.
Target Prices
The consensus target price for Live Nation Entertainment, Inc. reflects a bullish outlook from analysts.
| Target Low | Target High | Consensus |
|---|---|---|
| 155 | 198 | 181.2 |
Analysts expect the stock to appreciate, with a consensus target price suggesting a potential upside from current levels. This signals confidence in the company’s growth prospects and market position.

Don’t Let Luck Decide Your Entry Point
Optimize your entry points with our advanced ProRealTime indicators. You’ll get efficient buy signals with precise price targets for maximum performance. Start outperforming now!
Analyst & Consumer Opinions
This section examines ratings and consumer feedback related to Live Nation Entertainment, Inc. (LYV) to gauge market sentiment.
Stock Grades
Here are the latest verified analyst grades for Live Nation Entertainment, Inc., reflecting current market sentiment:
| Grading Company | Action | New Grade | Date |
|---|---|---|---|
| Evercore ISI Group | Maintain | Outperform | 2026-02-20 |
| JP Morgan | Maintain | Overweight | 2026-02-20 |
| B of A Securities | Maintain | Buy | 2026-02-20 |
| UBS | Maintain | Buy | 2026-02-20 |
| Jefferies | Downgrade | Hold | 2026-01-13 |
| Guggenheim | Maintain | Buy | 2025-11-18 |
Most analysts maintain a positive stance, predominantly issuing Buy or Outperform grades. Jefferies is a notable exception, having downgraded to Hold, indicating some caution in this consensus.
Consumer Opinions
Live Nation Entertainment sparks strong reactions from its audience, reflecting its powerful presence in live events.
| Positive Reviews | Negative Reviews |
|---|---|
| “Exceptional concert experiences and seamless ticketing.” | “Ticket prices are often too high for the average fan.” |
| “Wide variety of events and reliable customer service.” | “Long wait times on customer support during peak seasons.” |
| “Innovative use of technology enhances event engagement.” | “Fees and hidden charges make final prices unpredictable.” |
Overall, consumers praise Live Nation for its event diversity and technology integration. However, pricing strategies and customer service responsiveness remain consistent pain points.
Risk Analysis
Below is a summary of key risks facing Live Nation Entertainment, Inc., highlighting their likelihood and potential impact:
| Category | Description | Probability | Impact |
|---|---|---|---|
| Financial Leverage | High debt-to-assets at 54.3% increases financial risk, limiting flexibility in downturns. | High | High |
| Valuation | Elevated P/E of 66.6 and P/B of 121.9 suggest overvaluation, raising correction risk. | Medium | Medium |
| Liquidity | Current ratio of 1.0 signals tight liquidity, risking short-term cash flow challenges. | Medium | Medium |
| Profitability | Low net margin at 1.97% reduces buffer against economic shocks and operational risks. | Medium | High |
| Market Volatility | Beta of 1.14 indicates above-market price swings, demanding cautious trading strategies. | Medium | Medium |
| Bankruptcy Risk | Altman Z-Score of 2.31 places the company in a grey zone, indicating moderate bankruptcy risk. | Low | High |
The most pressing risks are the elevated leverage and razor-thin net margins. Debt at over half of assets constrains strategic moves during economic downturns. Meanwhile, profit margins under 2% limit resilience to cost inflation or revenue slumps. Despite a solid ROE of 183%, these weaknesses have kept the Altman Z-Score in a cautionary grey zone. Investors should weigh these financial constraints against Live Nation’s market position before committing capital.
Should You Buy Live Nation Entertainment, Inc.?
Live Nation Entertainment appears to have improving profitability and a slightly favorable moat, reflecting growing operational efficiency. Despite a manageable leverage profile, the overall C- rating and average financial strength suggest a cautious analytical interpretation of its value creation potential.
Strength & Efficiency Pillars
Live Nation Entertainment, Inc. posts a robust return on equity of 183.01%, signaling strong shareholder value generation. Its ROIC stands at 7.87%, slightly above its WACC of 7.44%, indicating the company may be a marginal value creator, though this margin is thin. Operationally, the firm maintains a solid gross margin of 23.01%, with favorable interest expense at 1.25%, supporting efficient cost management. Despite neutral EBIT and net margins, the overall income statement leans favorable, reflecting decent profitability and operational control.
Weaknesses and Drawbacks
The company resides in the Altman Z-Score grey zone at 2.31, indicating moderate financial distress risk that warrants caution. Valuation metrics appear stretched with a P/E of 66.61 and an extreme P/B of 121.91, signaling possible overvaluation relative to peers. Leverage is high with a debt-to-equity ratio of 45.91% and debt-to-assets at 54.3%, increasing solvency concerns. The current ratio of 1.0 signals limited short-term liquidity buffer, further elevating risk. These factors could pressure the stock despite recent buyer dominance.
Our Final Verdict about Live Nation Entertainment, Inc.
Live Nation’s profile suggests moderate fundamental strength with a bullish long-term trend and recent buyer dominance. However, the grey-zone Altman Z-Score and stretched valuation metrics inject caution. Despite operational improvements, the solvency risk and liquidity constraints might make the investment profile appear highly speculative, especially for conservative capital. Investors might consider waiting for clearer financial stability before committing.
Disclaimer: This content is for informational purposes only and does not constitute financial, investment, or other professional advice. Investing in financial markets involves a significant risk of loss, and past performance is not indicative of future results.
Additional Resources
- Live Nation Entertainment Full Year And Fourth Quarter 2025 Results – Live Nation (Feb 19, 2026)
- Live Nation beats quarterly revenue estimates on strong concert demand – Reuters (Feb 19, 2026)
- Entertainment Stock Pops as Ticket Sales Drive Q4 Beat – Schaeffer’s Investment Research (Feb 20, 2026)
- 4 Analysts Assess Live Nation Entertainment: What You Need To Know – Benzinga (Feb 20, 2026)
- Live Nation’s increased ticket sales and concert revenue narrows operating loss (LYV:NYSE) – Seeking Alpha (Feb 19, 2026)
For more information about Live Nation Entertainment, Inc., please visit the official website: livenationentertainment.com