Home > Analyses > Basic Materials > Linde plc
Linde plc powers industries and healthcare with essential gases that sustain life and fuel innovation worldwide. Its leadership in atmospheric and process gases spans sectors from aerospace to water treatment. Renowned for engineering turnkey plants, Linde blends cutting-edge technology with robust market influence. As global demand evolves, I ask: does Linde’s strong foundation continue to justify its premium valuation and growth outlook in 2026?
Table of contents
Business Model & Company Overview
Linde plc, founded in 1879 and headquartered in Woking, UK, stands as a global leader in the specialty chemicals sector. It operates an integrated ecosystem of industrial and process gases, including oxygen, nitrogen, helium, and hydrogen, serving diverse industries from healthcare to aerospace. With over 65K employees, Linde’s core mission centers on delivering essential gases and engineering solutions that power critical industrial processes worldwide.
Linde’s revenue engine balances sales of atmospheric and process gases with turnkey plant design and construction services. Its presence spans the Americas, Europe, the Middle East, Africa, and Asia Pacific, ensuring a diversified geographic footprint. This broad market reach, coupled with its technological expertise, creates a durable economic moat that shapes the future of industrial gas supply and process engineering.
Financial Performance & Fundamental Metrics
I analyze Linde plc’s income statement, key financial ratios, and dividend payout policy to assess its profitability, efficiency, and shareholder return strategy.
Income Statement
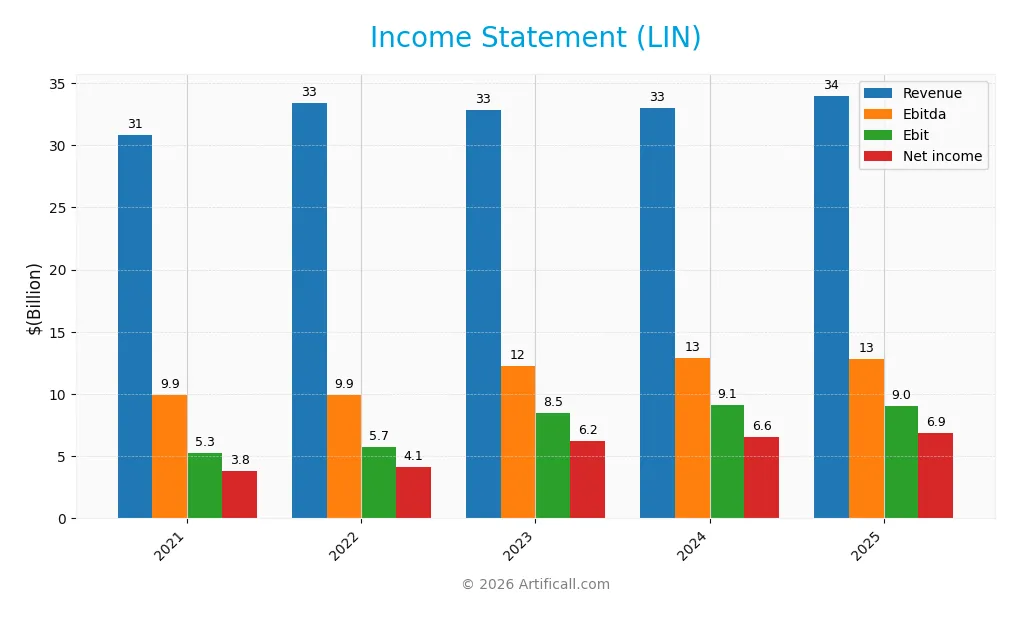
Below is Linde plc’s income statement summary for fiscal years 2021 through 2025, presented in USD with compact numeric formatting.
| 2021 | 2022 | 2023 | 2024 | 2025 | |
|---|---|---|---|---|---|
| Revenue | 30.8B | 33.4B | 32.9B | 33.0B | 34.0B |
| Cost of Revenue | 22.2B | 23.7B | 21.3B | 20.9B | 19.3B |
| Operating Expenses | 3.3B | 3.3B | 3.4B | 3.5B | 5.8B |
| Gross Profit | 8.6B | 9.7B | 11.5B | 12.1B | 14.7B |
| EBITDA | 9.9B | 9.9B | 12.3B | 12.9B | 12.9B |
| EBIT | 5.3B | 5.7B | 8.5B | 9.1B | 9.0B |
| Interest Expense | 159M | 192M | 488M | 572M | 212M |
| Net Income | 3.8B | 4.1B | 6.2B | 6.6B | 6.9B |
| EPS | 7.4 | 8.3 | 12.7 | 13.7 | 14.7 |
| Filing Date | 2022-02-28 | 2023-02-28 | 2024-02-28 | 2025-02-26 | 2026-02-25 |
Income Statement Evolution
From 2021 to 2025, Linde’s revenue grew 10.4% overall, with a slower 3% rise in the latest year. Net income surged 80%, reflecting improved profitability. Gross margin expanded significantly, reaching 43.3% in 2025, while EBIT margin remained strong at 26.6%. Net margin also improved, underscoring better cost control and operational efficiency.
Is the Income Statement Favorable?
In 2025, Linde posted $34B revenue and $6.9B net income, with a 20.3% net margin. Despite a slight EBIT decline last year, earnings per share grew 7.1%, signaling solid capital allocation. Interest expense stayed low at 0.62% of revenue. Overall, fundamentals appear favorable, supported by margin expansion and strong bottom-line growth.
Financial Ratios
The table below summarizes key financial ratios for Linde plc (LIN) over the fiscal years 2021 to 2025:
| Ratios | 2021 | 2022 | 2023 | 2024 | 2025 |
|---|---|---|---|---|---|
| Net Margin | 12% | 12% | 19% | 20% | 20% |
| ROE | 8.7% | 10.4% | 16.0% | 17.2% | 18.0% |
| ROIC | 5.6% | 7.0% | 8.8% | 9.2% | 9.0% |
| P/E | 47 | 39 | 32 | 31 | 29 |
| P/B | 4.1 | 4.1 | 5.0 | 5.3 | 5.2 |
| Current Ratio | 0.74 | 0.79 | 0.80 | 0.89 | 0.88 |
| Quick Ratio | 0.62 | 0.67 | 0.67 | 0.76 | 0.74 |
| D/E | 0.35 | 0.47 | 0.51 | 0.59 | 0.71 |
| Debt-to-Assets | 19% | 24% | 25% | 28% | 31% |
| Interest Coverage | 33 | 34 | 17 | 15 | 42 |
| Asset Turnover | 0.38 | 0.42 | 0.41 | 0.41 | 0.39 |
| Fixed Asset Turnover | 1.18 | 1.42 | 1.29 | 1.28 | 1.20 |
| Dividend Yield | 1.2% | 1.4% | 1.2% | 1.3% | 1.4% |
Evolution of Financial Ratios
From 2021 to 2025, Linde plc’s Return on Equity (ROE) steadily improved from 8.7% to 18.0%, signaling enhanced profitability. The Current Ratio remained below 1.0, indicating persistent liquidity constraints. The Debt-to-Equity Ratio increased from 0.35 to 0.71, reflecting moderate leverage growth. Profit margins expanded gradually, confirming stronger operational efficiency.
Are the Financial Ratios Fovorable?
In 2025, profitability metrics like net margin (20.3%) and ROE (18.0%) were favorable, supported by a WACC of 7.1%. Liquidity ratios, including Current (0.88) and Quick (0.74), were unfavorable, posing risk. Leverage ratios showed neutrality with debt-to-equity at 0.71. Market multiples, such as P/E (28.8) and P/B (5.2), were unfavorable, while interest coverage (42.6) was favorable. Overall, ratios appear slightly unfavorable.
Shareholder Return Policy
Linde plc maintains a consistent dividend payout ratio around 40%, with dividend per share rising from $4.23 in 2021 to $6.03 in 2025. The annual dividend yield hovers near 1.4%, supported by moderate free cash flow coverage and prudent capital expenditures.
The company also undertakes share buybacks, complementing dividends in returning capital. This balanced approach appears aligned with sustainable long-term value creation, considering steady profitability and manageable leverage ratios.
Score analysis
The following radar chart displays Linde plc’s key financial scores across valuation, profitability, and leverage metrics:
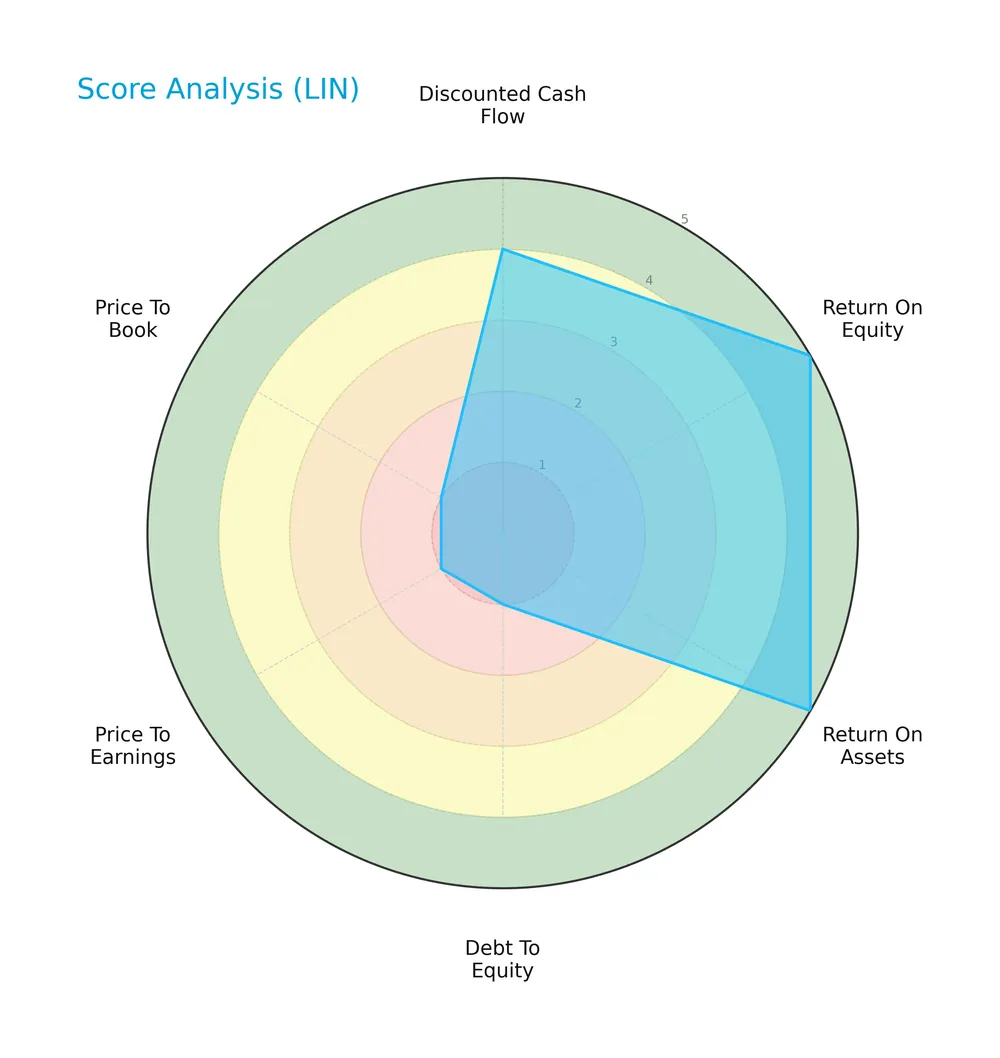
Linde scores very favorably on return on equity and assets, reflecting efficient capital use. Its discounted cash flow is favorable. However, debt-to-equity, price-to-earnings, and price-to-book scores are very unfavorable, indicating valuation concerns and high leverage risks.
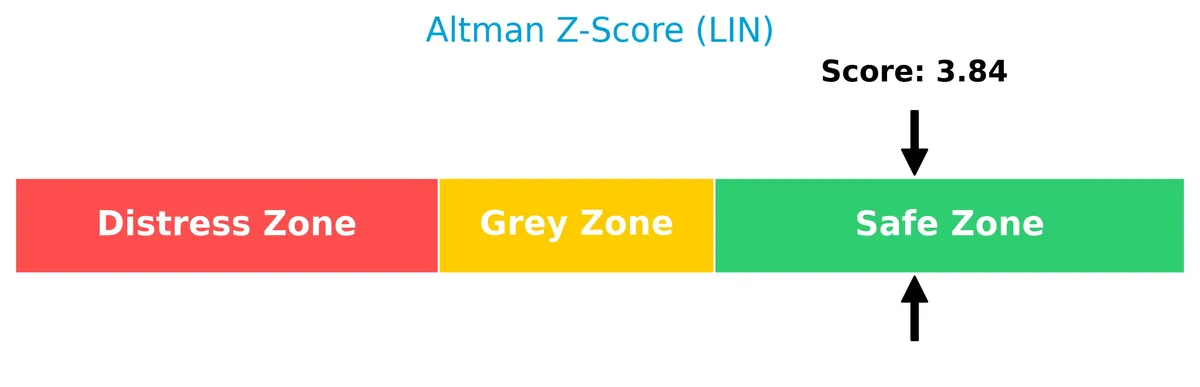
Analysis of the company’s bankruptcy risk
Linde’s Altman Z-Score at nearly 4 places it firmly in the safe zone, signaling low bankruptcy risk and robust financial stability:
Is the company in good financial health?
The Piotroski F-Score chart summarizes Linde’s financial strength based on nine key criteria:

With a score of 6, Linde demonstrates average financial health. This suggests moderate profitability and efficiency, but room remains for improvement in financial robustness.
Competitive Landscape & Sector Positioning
This analysis explores Linde plc’s sector positioning through strategic focus, revenue segmentation, products, and competitors. I will assess whether Linde holds a competitive advantage in its industry.
Strategic Positioning
Linde plc maintains a diversified product portfolio, balancing atmospheric and process gases with engineering services. Its geographic exposure spans North America, Europe, Asia-Pacific, and emerging markets, with the Americas leading revenue around $15B in 2025, reflecting broad global reach and sectoral balance.
Revenue by Segment
This pie chart displays Linde plc’s revenue distribution by segment for the fiscal year 2025, highlighting the main geographic and business units contributing to overall sales.
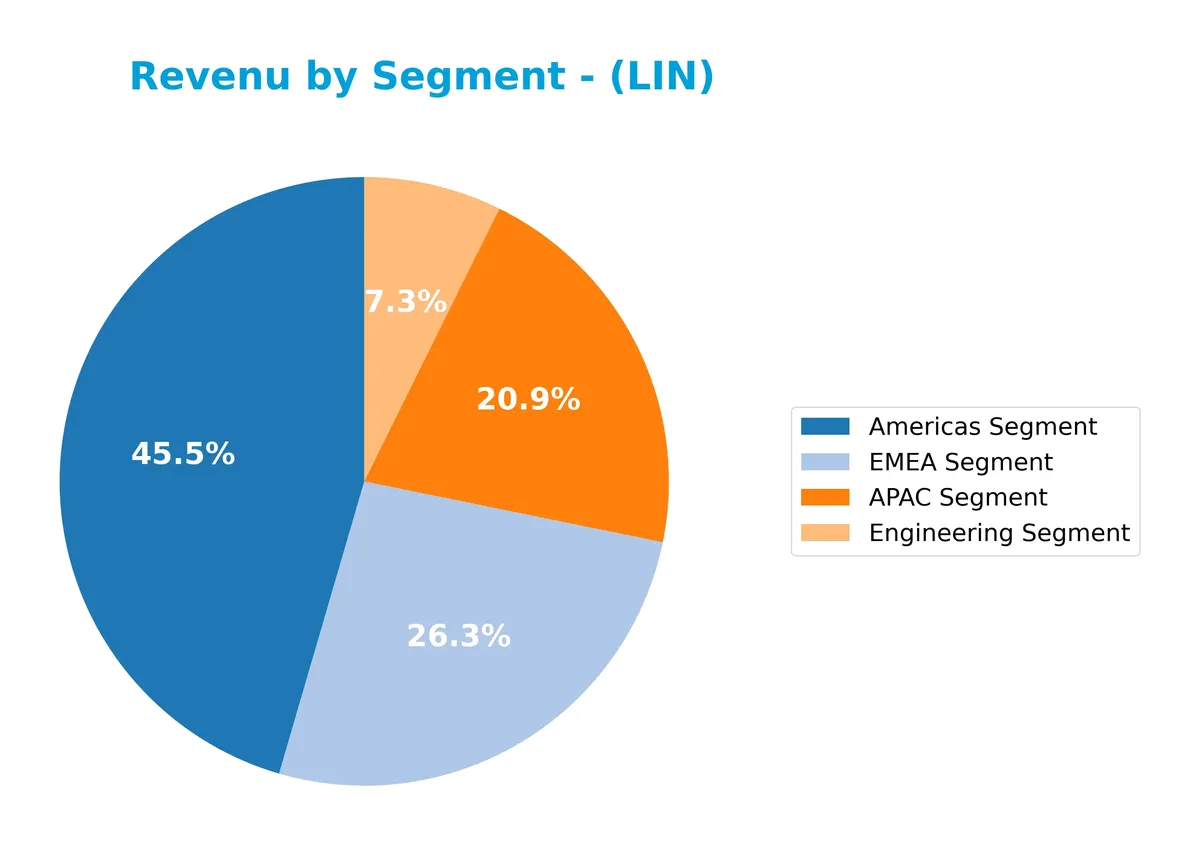
The Americas segment leads with $15.2B, followed by EMEA at $8.5B and APAC at $6.7B. Engineering contributes $2.7B. I observe steady growth across Americas and APAC, reflecting strong market demand and operational scale. Engineering’s rebound after a dip signals strategic recovery. The geographic spread reduces concentration risk, but the Americas segment remains the dominant revenue driver.
Key Products & Brands
The table below outlines Linde plc’s principal products, brands, and segments by description:
| Product | Description |
|---|---|
| Atmospheric Gases | Oxygen, nitrogen, argon, and rare gases supplied for industrial and medical uses. |
| Process Gases | Includes carbon dioxide, helium, hydrogen, electronic, specialty gases, and acetylene. |
| Engineering Segment | Designs and constructs turnkey process plants for gas production and other industries. |
| Americas Segment | Regional operations covering North and South America with industrial gas supply and services. |
| EMEA Segment | Operations in Europe, Middle East, and Africa supplying gases and engineering solutions. |
| APAC Segment | Asia Pacific regional business providing industrial and specialty gases and engineering. |
Linde’s product portfolio spans atmospheric and process gases, alongside engineering services. Its geographic segments—Americas, EMEA, and APAC—reflect a diversified global footprint centered on industrial gas supply and plant engineering.
Main Competitors
Linde plc operates among 9 main competitors in the Chemicals – Specialty industry; the table below lists the top 10 leaders by market capitalization:
| Competitor | Market Cap. |
|---|---|
| Linde plc | 200B |
| The Sherwin-Williams Company | 81B |
| Ecolab Inc. | 74B |
| Air Products and Chemicals, Inc. | 56B |
| PPG Industries, Inc. | 23B |
| International Flavors & Fragrances Inc. | 17B |
| DuPont de Nemours, Inc. | 17B |
| Albemarle Corporation | 17B |
| LyondellBasell Industries N.V. | 14B |
Linde plc ranks 1st among its 9 competitors with a market cap 18% above the next biggest player. It stands well above both the average market cap of the top 10 (56B) and the sector median (23B). The gap to the next competitor below is substantial at -191%, underscoring Linde’s dominant market position.
Comparisons with competitors
Check out how we compare the company to its competitors:
Does Linde have a competitive advantage?
Linde does not yet demonstrate a clear competitive advantage, as its ROIC remains slightly below the cost of capital, indicating value is being shed. However, the company shows a growing ROIC trend, reflecting improving profitability.
Looking ahead, Linde’s broad geographic reach and diverse industrial gas portfolio position it well for expansion. Opportunities in emerging markets and new process plant designs could support future growth despite recent revenue growth softness.
SWOT Analysis
This SWOT analysis highlights Linde plc’s key internal and external factors shaping its competitive position.
Strengths
- Strong global footprint
- High gross margin (43.3%)
- Robust net margin (20.3%)
Weaknesses
- Low current and quick ratios (0.88, 0.74)
- High price multiples (PE 28.8, PB 5.2)
- Moderate debt-to-equity ratio (0.71)
Opportunities
- Expansion in emerging markets
- Growing demand for industrial gases in energy transition
- Increasing ROIC trend (+59%)
Threats
- Economic slowdown risks
- Rising raw material costs
- Intense competition in specialty chemicals
Linde’s strengths in profitability and global reach support a solid foundation. However, liquidity constraints and valuation risks require caution. The company’s strategy should leverage growth in energy and emerging markets while managing financial leverage prudently.
Stock Price Action Analysis
The weekly stock chart reveals Linde plc’s price movements and volatility over the past 12 months:
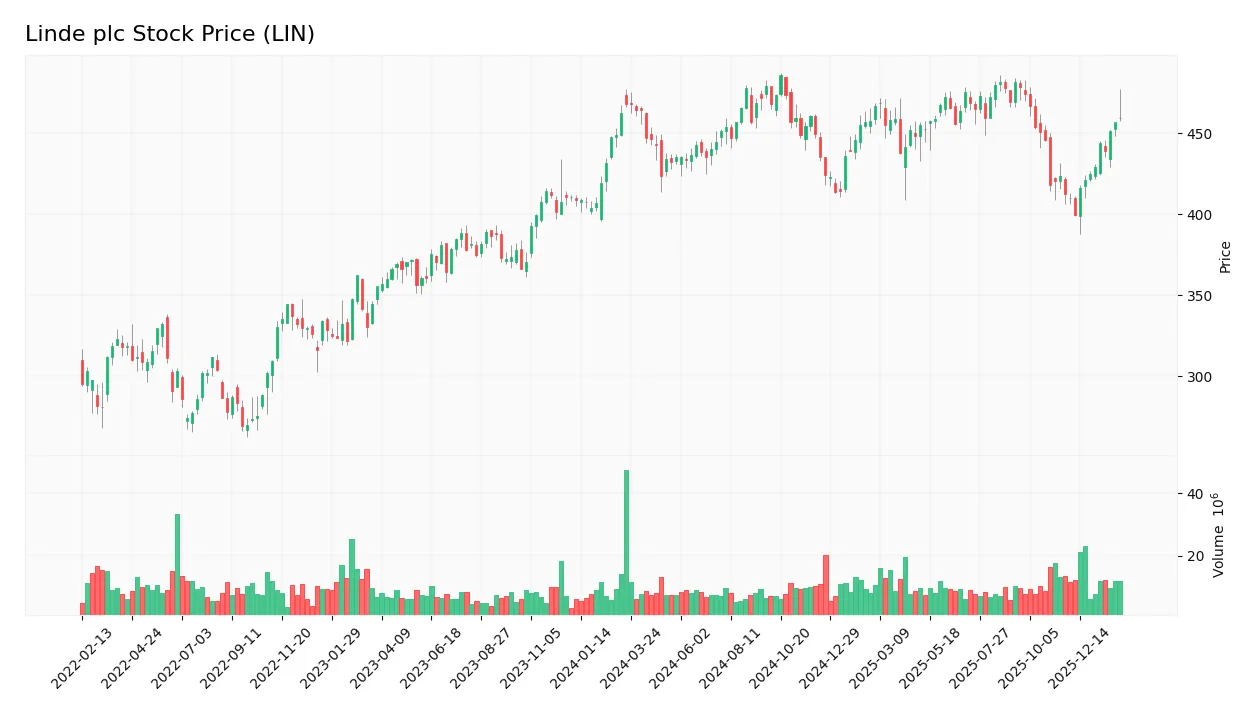
Trend Analysis
Over the past year, Linde plc’s stock price increased by 9.38%, indicating a bullish trend. The price showed acceleration with a high of 508.27 and low of 399.57. The standard deviation of 20.4 points to notable volatility in this upward movement.
Volume Analysis
Trading volume over the last three months is increasing, with buyers dominating 82.28% of activity. Buyer volume surged to 127M versus 27M sellers, signaling strong buyer-driven momentum and heightened investor participation.
Target Prices
Analysts maintain a bullish consensus on Linde plc, reflecting confidence in its resilient industrial gas franchise.
| Target Low | Target High | Consensus |
|---|---|---|
| 490 | 550 | 516 |
The target range between 490 and 550 suggests modest upside from current levels, indicating steady growth expectations in line with sector norms.

Don’t Let Luck Decide Your Entry Point
Optimize your entry points with our advanced ProRealTime indicators. You’ll get efficient buy signals with precise price targets for maximum performance. Start outperforming now!
Analyst & Consumer Opinions
This section examines analyst ratings and consumer feedback to provide a balanced view of Linde plc’s market perception.
Stock Grades
Here is the latest summary of Linde plc’s stock ratings from leading financial institutions as of early 2026:
| Grading Company | Action | New Grade | Date |
|---|---|---|---|
| JP Morgan | Downgrade | Neutral | 2026-02-06 |
| Citigroup | Maintain | Buy | 2026-02-06 |
| UBS | Maintain | Buy | 2026-02-06 |
| Citigroup | Maintain | Buy | 2026-01-21 |
| RBC Capital | Maintain | Outperform | 2025-12-12 |
| UBS | Upgrade | Buy | 2025-11-11 |
| RBC Capital | Maintain | Outperform | 2025-11-06 |
| Citigroup | Maintain | Buy | 2025-11-03 |
| Seaport Global | Upgrade | Buy | 2025-11-03 |
| JP Morgan | Maintain | Overweight | 2025-11-03 |
The consensus leans strongly toward a Buy rating with 23 out of 28 analysts endorsing it, despite JP Morgan’s recent downgrade to Neutral. Most firms maintain or upgrade their outlook, signaling steady confidence in Linde’s prospects.
Consumer Opinions
Linde plc consistently earns respect for its reliable industrial gas solutions, yet some customers express concerns about service responsiveness.
| Positive Reviews | Negative Reviews |
|---|---|
| “Linde delivers high-quality gases with great purity.” | “Customer support can be slow during peak times.” |
| “Their safety standards exceed industry norms.” | “Pricing is occasionally higher than competitors.” |
| “Equipment reliability and uptime are impressive.” | “Delivery schedules sometimes face delays.” |
Overall, consumers praise Linde’s product quality and safety leadership. However, service speed and pricing remain areas needing improvement to enhance customer satisfaction.
Risk Analysis
Below is a summary of key risks facing Linde plc, including their likelihood and potential impact on the business:
| Category | Description | Probability | Impact |
|---|---|---|---|
| Valuation Risk | Elevated P/E (28.82) and P/B (5.2) ratios suggest overvaluation. | High | High |
| Liquidity Risk | Current ratio (0.88) and quick ratio (0.74) below 1 indicate tight short-term liquidity. | Moderate | Moderate |
| Debt Risk | Debt-to-equity score very unfavorable; leverage ratio moderate (0.71). | Moderate | Moderate |
| Market Volatility | Beta of 0.847 signals lower sensitivity but exposure to market swings remains. | Moderate | Low |
| Operational Risk | Asset turnover (0.39) is weak, indicating lower efficiency. | Moderate | Moderate |
| Financial Health | Altman Z-Score near 4 places company in safe zone; Piotroski score average at 6. | Low | Low |
I see valuation risk as the most pressing. The company trades with stretched multiples well above sector averages, increasing downside if growth disappoints. Liquidity ratios below 1 pose a red flag, especially in volatile markets. However, strong interest coverage (42.6) cushions debt concerns. The firm’s safe Altman Z-Score reassures on bankruptcy risk, but operational inefficiencies warrant caution. Investors should weigh these risks relative to Linde’s solid market position and favorable profitability metrics.
Should You Buy Linde plc?
Linde plc appears to be a profitable company with improving operational efficiency and a slightly favorable moat, reflecting growing ROIC but shedding value relative to WACC. Despite a manageable leverage profile, valuation metrics seem unfavorable, suggesting a moderate-risk profile rated B overall.
Strength & Efficiency Pillars
Linde plc demonstrates solid operational efficiency with a net margin of 20.3% and a return on equity (ROE) of 18.04%. The company’s return on invested capital (ROIC) stands at 8.97%, modestly above its weighted average cost of capital (WACC) at 7.11%, confirming it as a value creator. This margin of difference suggests Linde efficiently generates returns exceeding its capital costs. Its strong interest coverage ratio of 42.6 further underscores robust earnings relative to debt expenses, supporting sustainable profitability.
Weaknesses and Drawbacks
Despite operational strengths, Linde faces valuation and liquidity headwinds. Its price-to-earnings ratio of 28.82 and price-to-book ratio of 5.2 indicate a premium valuation compared to sector averages, which could limit upside. The current ratio at 0.88 and quick ratio of 0.74 raise red flags on short-term liquidity, suggesting potential cash flow constraints. Although debt-to-equity is moderate at 0.71, these leverage metrics combined with elevated valuations warrant caution, particularly in volatile market conditions.
Our Final Verdict about Linde plc
Linde’s financial profile appears attractive for long-term exposure, supported by a safe Altman Z-Score of 3.98 and a bullish stock trend with accelerating momentum. Strong buyer dominance at 82.28% in the recent period reinforces positive market sentiment. However, elevated valuation multiples and liquidity concerns may suggest a more cautious entry point, particularly for investors prioritizing near-term stability over growth potential.
Disclaimer: This content is for informational purposes only and does not constitute financial, investment, or other professional advice. Investing in financial markets involves a significant risk of loss, and past performance is not indicative of future results.
Additional Resources
- Decoding Linde PLC (LIN): A Strategic SWOT Insight – GuruFocus (Feb 26, 2026)
- Top Superinvestors Are Buying Linde plc (LIN) – The Acquirer’s Multiple (Feb 24, 2026)
- Linde PLC (NASDAQ:LIN) Raises Dividend to $1.60 Per Share – MarketBeat (Feb 25, 2026)
- First Week of October 16th Options Trading For Linde (LIN) – Nasdaq (Feb 23, 2026)
- LINDE PLC SEC 10-K Report – TradingView (Feb 25, 2026)
For more information about Linde plc, please visit the official website: linde.com