Home > Analyses > Industrials > Lincoln Electric Holdings, Inc.
Lincoln Electric Holdings powers the backbone of global manufacturing with its advanced welding and cutting technologies. Renowned for precision and durability, its products serve industries from automotive to shipbuilding. The company’s innovation in robotic welding and automation cements its leadership and influence in industrial fabrication. As market dynamics shift, I question whether Lincoln Electric’s robust fundamentals continue to support its premium valuation and growth trajectory.

Table of contents
Business Model & Company Overview
Lincoln Electric Holdings, Inc., founded in 1895 and headquartered in Cleveland, Ohio, dominates the manufacturing sector for welding, cutting, and brazing products. Its core business integrates arc welding power sources, robotic welding packages, and consumables into a powerful ecosystem serving diverse industries such as automotive, construction, and shipbuilding. With 12K employees, the company’s legacy blends innovation with manufacturing excellence to meet global industrial demand.
The company’s revenue engine balances hardware sales—plasma cutters, gas regulators—and recurring consumables sales, which create steady cash flow. Lincoln Electric operates through three segments: Americas Welding, International Welding, and The Harris Products Group, serving markets across the Americas, Europe, and Asia. This competitive advantage in global reach and product integration establishes a durable economic moat, shaping the future of industrial fabrication worldwide.
Financial Performance & Fundamental Metrics
I analyze Lincoln Electric Holdings, Inc.’s income statement, key financial ratios, and dividend payout policy to reveal its profitability, efficiency, and shareholder returns.
Income Statement
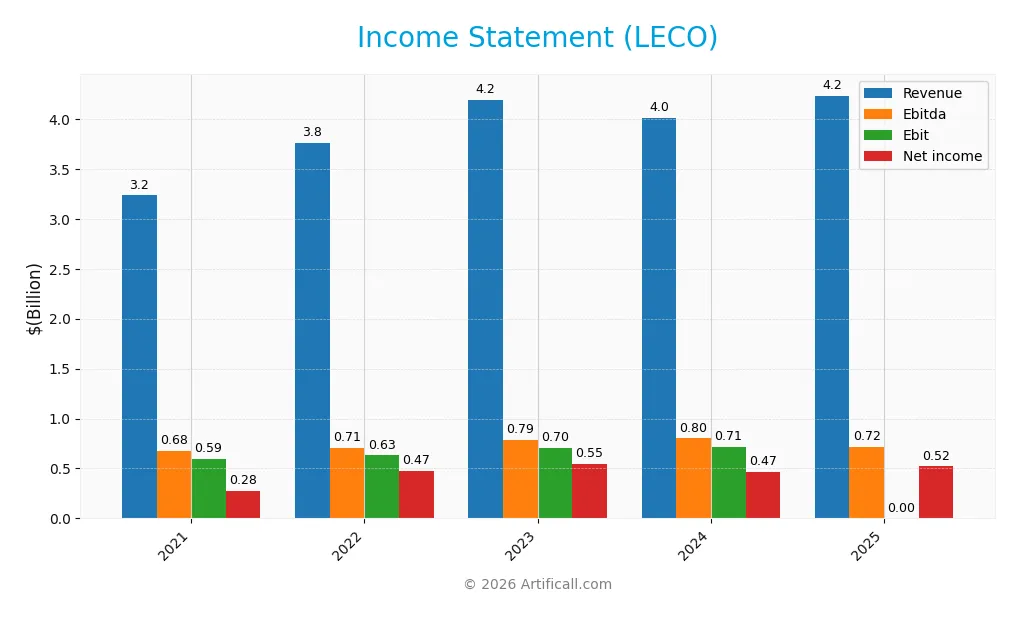
The table below summarizes Lincoln Electric Holdings, Inc.’s key income statement figures over the past five fiscal years, providing a clear view of its financial performance.
| 2021 | 2022 | 2023 | 2024 | 2025 | |
|---|---|---|---|---|---|
| Revenue | 3.23B | 3.76B | 4.19B | 4.01B | 4.23B |
| Cost of Revenue | 2.17B | 2.48B | 2.71B | 2.53B | 2.69B |
| Operating Expenses | 607M | 668M | 760M | 841M | 795M |
| Gross Profit | 1.07B | 1.28B | 1.48B | 1.48B | 1.54B |
| EBITDA | 675M | 708M | 789M | 801M | 843M |
| EBIT | 594M | 630M | 703M | 712M | 744M |
| Interest Expense | 22M | 30M | 44M | 43M | 52M |
| Net Income | 277M | 472M | 545M | 466M | 521M |
| EPS | 4.66 | 8.14 | 9.51 | 8.23 | 9.39 |
| Filing Date | 2022-02-18 | 2023-02-21 | 2024-02-27 | 2025-02-26 | 2026-02-25 |
Income Statement Evolution
Lincoln Electric Holdings, Inc. grew revenue by 31% from 2021 to 2025, with a 5.6% increase in 2025 alone. Net income surged 88% over five years, reflecting stronger profitability. Gross margin remained stable around 36%, while net margin improved to 12.3%, signaling better cost control and margin expansion.
Is the Income Statement Favorable?
In 2025, fundamentals appear favorable. The company posted a 5.6% revenue increase and a 14.4% EPS rise, outpacing EBIT growth at 4.5%. Operating expenses grew in line with revenue, supporting margin stability. Interest expense is modest at 1.2% of revenue. Overall, the income statement shows disciplined capital allocation and solid earnings quality.
Financial Ratios
The table below summarizes key financial ratios for Lincoln Electric Holdings, Inc. (LECO) over recent fiscal years, illustrating profitability, liquidity, leverage, and efficiency trends:
| Ratios | 2021 | 2022 | 2023 | 2024 | 2025 |
|---|---|---|---|---|---|
| Net Margin | 8.6% | 12.6% | 13.0% | 11.6% | 12.3% |
| ROE | 32.0% | 45.7% | 41.7% | 35.1% | 35.4% |
| ROIC | 20.7% | 20.1% | 21.6% | 18.1% | 19.3% |
| P/E | 29.9 | 17.8 | 22.9 | 22.8 | 25.5 |
| P/B | 9.6 | 8.1 | 9.5 | 8.0 | 9.0 |
| Current Ratio | 1.71 | 1.83 | 2.24 | 1.87 | 1.82 |
| Quick Ratio | 0.99 | 1.05 | 1.50 | 1.25 | 1.16 |
| D/E | 0.95 | 1.21 | 0.89 | 0.99 | 0.88 |
| Debt-to-Assets | 31.6% | 39.3% | 34.3% | 37.4% | 34.3% |
| Interest Coverage | 20.8 | 20.8 | 16.2 | 14.9 | 14.4 |
| Asset Turnover | 1.25 | 1.18 | 1.24 | 1.14 | 1.12 |
| Fixed Asset Turnover | 5.78 | 6.38 | 6.67 | 6.47 | 6.02 |
| Dividend Yield | 1.47% | 1.56% | 1.19% | 1.53% | 1.27% |
Evolution of Financial Ratios
Return on Equity (ROE) remained strong, peaking at 41.66% in 2023 before settling at 35.42% in 2025, indicating solid profitability. The Current Ratio showed slight fluctuations but held steady around 1.8, reflecting stable liquidity. Debt-to-Equity Ratio declined modestly from 1.21 in 2022 to 0.88 in 2025, signaling improved leverage management.
Are the Financial Ratios Favorable?
In 2025, profitability ratios like ROE (35.42%) and net margin (12.3%) were favorable, underpinned by efficient asset use (asset turnover 1.12). Liquidity ratios (current 1.82, quick 1.16) also appeared strong. Leverage metrics were neutral, with debt-to-equity at 0.88. Market valuation ratios like P/E (25.51) and P/B (9.03) were unfavorable, tempering the overall positive financial profile.
Shareholder Return Policy
Lincoln Electric Holdings, Inc. maintains a consistent dividend policy with a payout ratio around 32-44% and a dividend yield near 1.2-1.5%. Dividends are well-covered by free cash flow, supported by a healthy coverage ratio exceeding 2x, indicating sustainable distributions.
The company also engages in share buybacks, enhancing shareholder value beyond dividends. This balanced approach between dividends and buybacks appears aligned with sustaining long-term shareholder returns, assuming stable operating cash flows and moderate leverage are maintained.
Score analysis
Here is a radar chart summarizing Lincoln Electric Holdings, Inc.’s key financial metric scores:
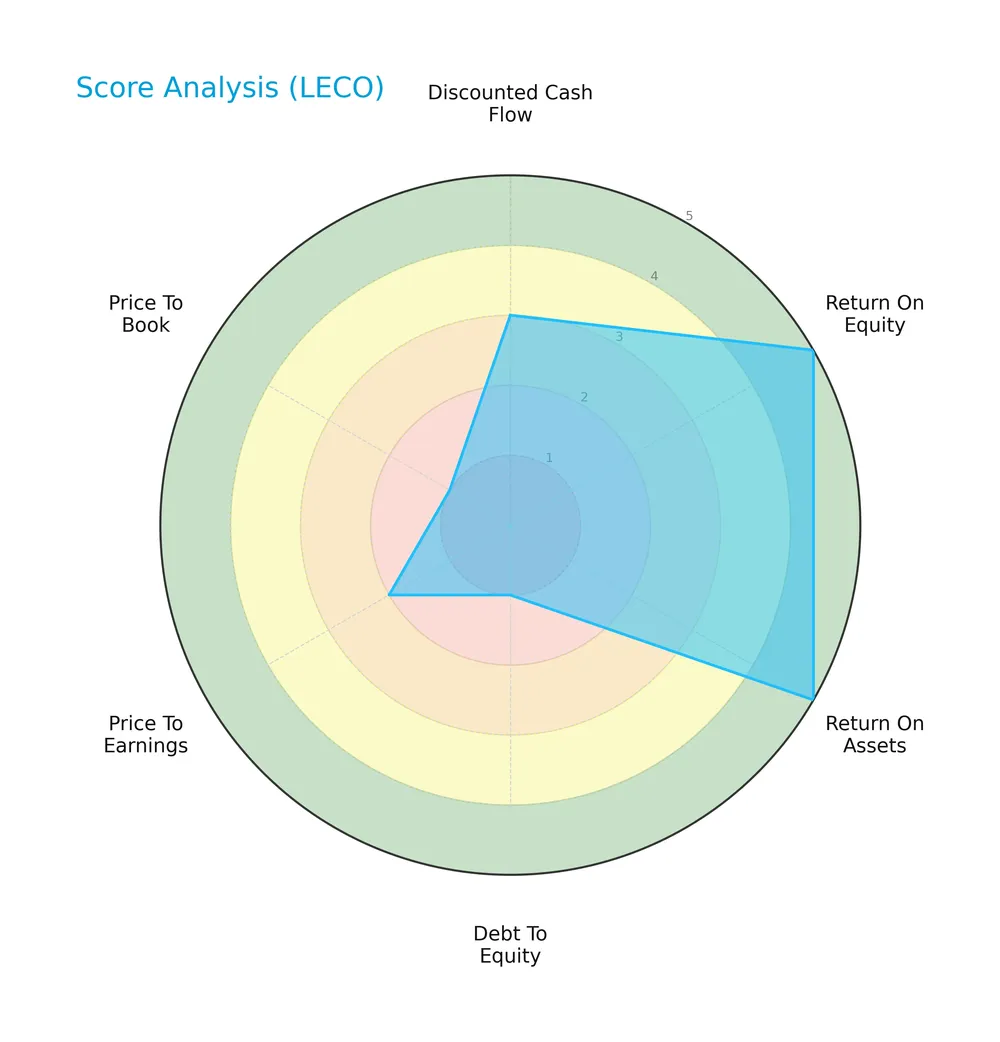
The company scores very favorably in return on equity and assets, showing strong profitability. However, debt-to-equity, price-to-earnings, and price-to-book ratios indicate weaker valuation and leverage metrics. The discounted cash flow score sits at a moderate level.
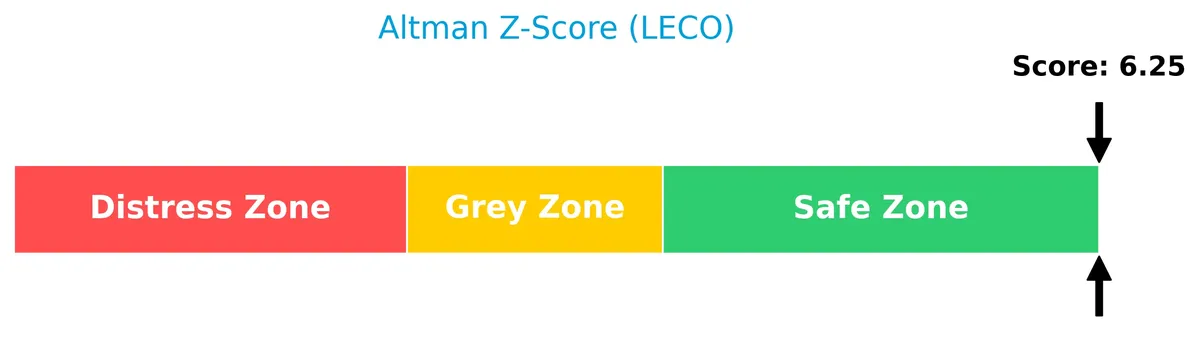
Analysis of the company’s bankruptcy risk
Lincoln Electric Holdings, Inc. is positioned well within the safe zone, indicating a low risk of bankruptcy based on its Altman Z-Score:
Is the company in good financial health?
The following Piotroski Score diagram illustrates the company’s financial health metrics:

With a Piotroski Score of 6, Lincoln Electric Holdings, Inc. demonstrates average financial strength, suggesting some solid fundamentals but room for improvement compared to stronger peers.
Competitive Landscape & Sector Positioning
This section analyzes Lincoln Electric Holdings, Inc.’s strategic positioning, key products, and revenue segments within the industrial tools sector. I will assess whether Lincoln Electric holds a competitive advantage over its main competitors.
Strategic Positioning
Lincoln Electric Holdings, Inc. maintains a focused product portfolio centered on welding, cutting, and brazing products across three segments. Geographically, it balances exposure, generating approximately 62% of revenue from the U.S. and 38% internationally, highlighting moderate diversification across mature and emerging markets.
Revenue by Segment
The pie chart illustrates Lincoln Electric Holdings, Inc.’s revenue breakdown by segment for fiscal year 2025, highlighting the contribution of each business unit to total sales.
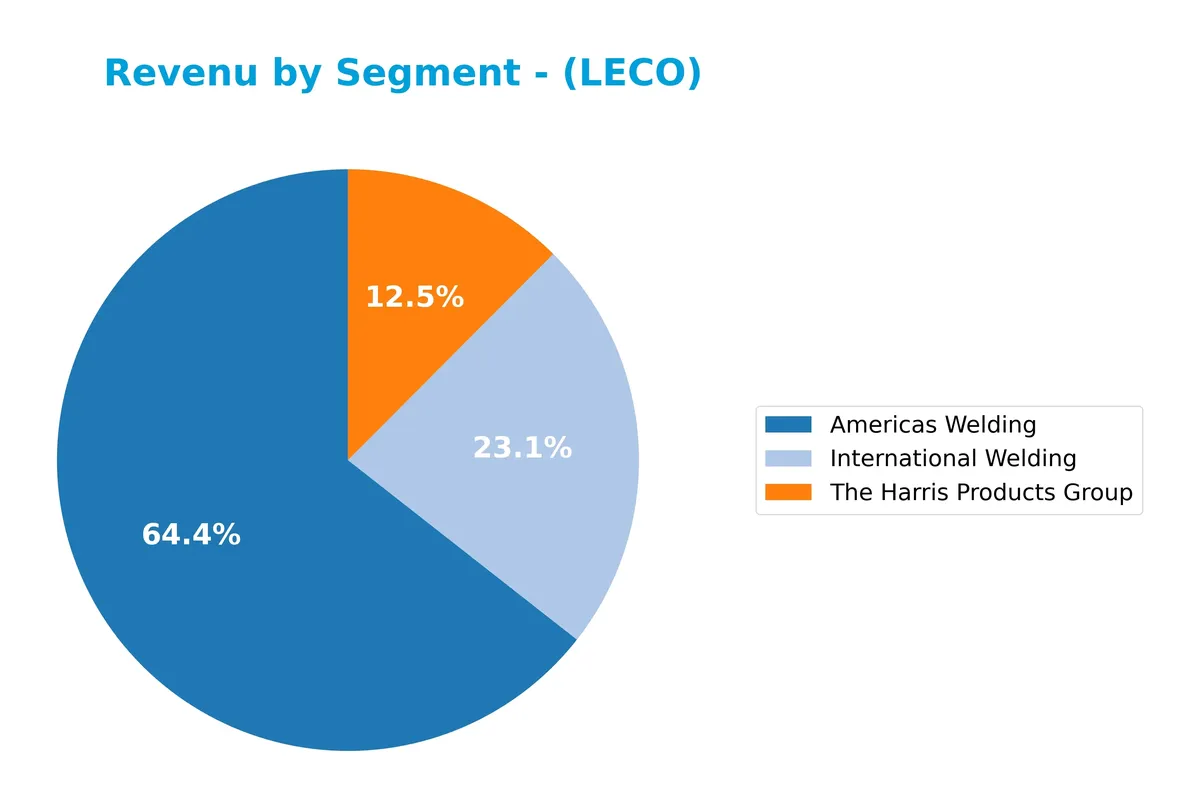
In 2025, Americas Welding dominates with $2.85B, reflecting steady growth from $1.96B in 2021. International Welding contributes $961M, slightly down from prior years, signaling a mild slowdown. The Harris Products Group shows robust expansion, reaching $594M, up from $469M in 2021. Negative aggregation adjustments at -$174M suggest some internal eliminations or accounting reclassifications. The business remains heavily concentrated in Americas Welding, underscoring geographic risk.
Key Products & Brands
The table below summarizes Lincoln Electric Holdings, Inc.’s main product segments and brand offerings:
| Product | Description |
|---|---|
| Americas Welding | Welding products including arc welding power sources, wire feeders, robotic welding, and consumables. |
| International Welding | Similar welding equipment and consumables offered outside the Americas region. |
| The Harris Products Group | Cutting systems, regulators, torches for oxy-fuel welding, brazing, soldering alloys, and HVAC components. |
Lincoln Electric’s diversified product portfolio spans advanced welding and cutting equipment globally. The Americas Welding segment dominates revenue, supported by complementary international operations and The Harris Products Group’s specialized industrial tools.
Main Competitors
The sector includes 3 competitors, with the table listing the top 3 leaders by market capitalization:
| Competitor | Market Cap. |
|---|---|
| Snap-on Incorporated | 18.3B |
| Lincoln Electric Holdings, Inc. | 13.2B |
| Stanley Black & Decker, Inc. | 11.8B |
Lincoln Electric Holdings, Inc. ranks 2nd among its 3 main competitors. Its market cap is 86.22% of the leader Snap-on Incorporated. The company stands above both the average market cap of the top 10 (14.5B) and the median in the sector (13.2B). It maintains a 15.98% gap to the next competitor above, showing a solid position in its industry.
Comparisons with competitors
Check out how we compare the company to its competitors:
Does LECO have a competitive advantage?
Lincoln Electric Holdings, Inc. exhibits a slight competitive advantage, consistently creating value with ROIC exceeding WACC by 10.2%. However, its profitability trend shows a decline, signaling caution.
Future growth may come from expanding its welding and cutting product lines globally. Opportunities lie in automation systems and international market penetration, supporting long-term revenue diversification.
SWOT Analysis
This SWOT analysis distills Lincoln Electric Holdings, Inc.’s core strategic factors to guide investment decisions.
Strengths
- strong ROIC at 19.34% exceeding WACC
- robust net margin of 12.3%
- diversified product portfolio across welding and HVAC sectors
Weaknesses
- declining ROIC trend signals profitability pressure
- high P/B ratio at 9.03 indicates possible overvaluation
- moderate debt-to-equity ratio of 0.88 could limit financial flexibility
Opportunities
- expanding international markets with growing non-US revenue
- automation and robotic welding technologies
- rising infrastructure investments globally
Threats
- cyclical manufacturing demand sensitive to economic swings
- competition from lower-cost producers abroad
- raw material price volatility impacting margins
Lincoln Electric’s solid profitability and product diversification create a resilient base. However, its declining ROIC and valuation multiples require caution. Growth through automation and global expansion aligns well with market trends but needs vigilance against economic cyclicality and input cost risks.
Stock Price Action Analysis
The weekly chart below illustrates Lincoln Electric Holdings, Inc. (LECO) stock price movements over the past 12 months, highlighting key highs and lows:
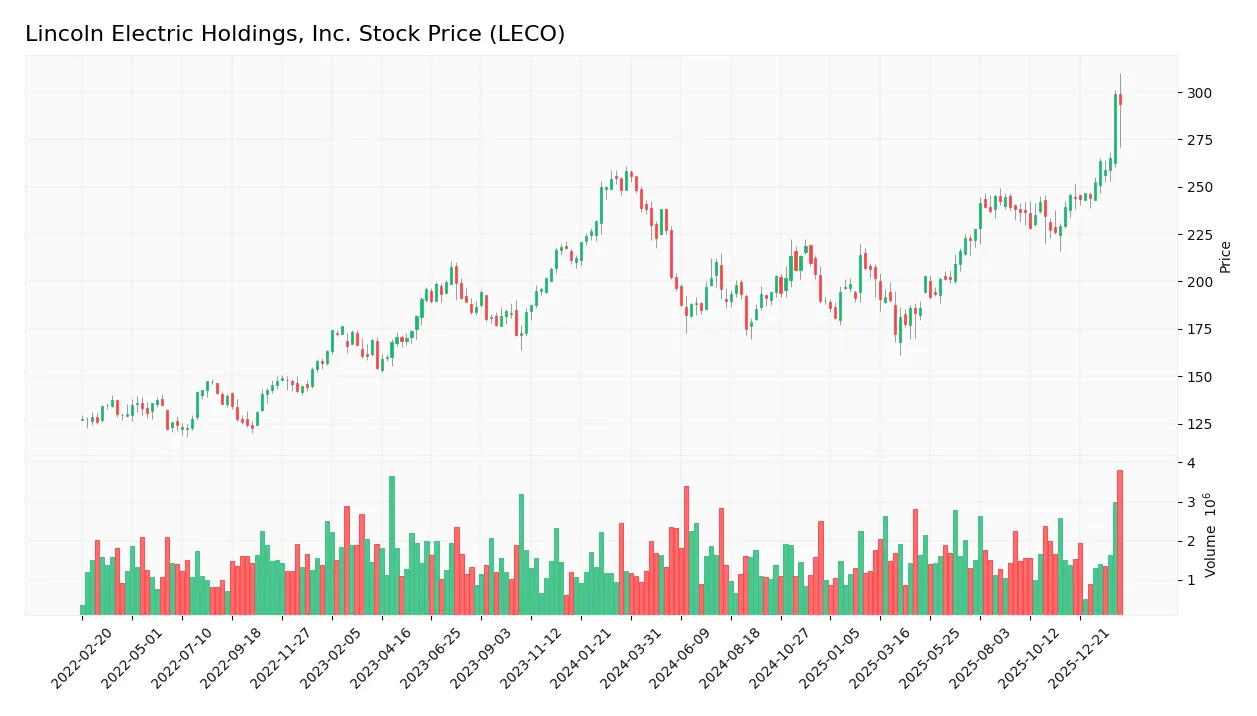
Trend Analysis
Over the past 12 months, LECO’s stock price gained 15.91%, indicating a bullish trend with accelerating momentum. The price moved between a low of 172.02 and a high near 298.88, with notable volatility reflected by a 27.94 standard deviation.
Volume Analysis
Trading volume for LECO increased overall, with buyer volume slightly surpassing sellers at 50.35%. However, the recent three-month period shows seller dominance at 55.18%, suggesting cautious investor sentiment amid rising volume and mixed market participation.
Target Prices
Analysts set a firm target consensus for Lincoln Electric Holdings, Inc., reflecting solid confidence in its growth potential.
| Target Low | Target High | Consensus |
|---|---|---|
| 240 | 340 | 305.29 |
The target range suggests analysts expect LECO to outperform typical industrial benchmarks. The consensus near 305 signals strong upside from current levels.

Don’t Let Luck Decide Your Entry Point
Optimize your entry points with our advanced ProRealTime indicators. You’ll get efficient buy signals with precise price targets for maximum performance. Start outperforming now!
Analyst & Consumer Opinions
I will examine Lincoln Electric Holdings, Inc.’s recent analyst grades and consumer feedback to provide balanced insights.
Stock Grades
Here are the recent stock grades for Lincoln Electric Holdings, Inc. from recognized financial firms:
| Grading Company | Action | New Grade | Date |
|---|---|---|---|
| Stifel | Maintain | Hold | 2026-02-13 |
| Keybanc | Maintain | Overweight | 2026-02-13 |
| Barclays | Maintain | Overweight | 2026-02-13 |
| Roth Capital | Maintain | Buy | 2026-02-03 |
| Barclays | Maintain | Overweight | 2026-01-23 |
| Stifel | Maintain | Hold | 2026-01-23 |
| Morgan Stanley | Maintain | Underweight | 2026-01-12 |
| Stifel | Maintain | Hold | 2025-12-16 |
| Stifel | Maintain | Hold | 2025-10-31 |
| Barclays | Maintain | Overweight | 2025-10-20 |
The consensus reflects a stable outlook with most firms maintaining their positions. Overweight and Hold ratings dominate, signaling moderate confidence with limited recent shifts.
Consumer Opinions
Lincoln Electric Holdings, Inc. (LECO) enjoys a solid reputation among its customers, reflecting the company’s commitment to quality and innovation.
| Positive Reviews | Negative Reviews |
|---|---|
| Excellent welding equipment with reliable performance | Higher price point compared to competitors |
| Durable products that withstand heavy usage | Limited customer service responsiveness |
| Innovative technology enhances productivity | Occasional delays in product availability |
Overall, consumers praise Lincoln Electric for durable, high-performance products that boost productivity. However, pricing and customer service remain areas for improvement, posing potential risks for customer loyalty.
Risk Analysis
Below is a summary table of key risks facing Lincoln Electric Holdings, Inc. as of 2026:
| Category | Description | Probability | Impact |
|---|---|---|---|
| Valuation Risk | Elevated P/E (25.5) and P/B (9.03) ratios suggest overvaluation. | Medium | High |
| Debt Risk | Debt-to-equity ratio of 0.88 signals moderate leverage. | Medium | Medium |
| Market Volatility | Beta of 1.27 indicates higher sensitivity to market swings. | High | Medium |
| Operational Risk | Dependence on cyclical manufacturing sectors exposes to demand fluctuations. | Medium | High |
| Dividend Yield Risk | Modest 1.27% yield limits income appeal during downturns. | Low | Low |
The most significant risks lie in valuation and cyclical exposure. The rich valuation multiples heighten downside risk amid market corrections. Meanwhile, demand volatility in manufacturing tools could pressure margins despite solid ROIC of 19.3%. The company’s Altman Z-Score firmly places it in the safe zone, mitigating bankruptcy concerns. However, investors should watch market cycles closely given the firm’s beta above 1.2.
Should You Buy Lincoln Electric Holdings, Inc.?
Lincoln Electric Holdings appears to be a company with robust profitability and value creation, supported by a slightly favorable moat despite declining ROIC. While its leverage profile shows some concerns, the overall rating of B+ suggests a generally very favorable financial health profile.
Strength & Efficiency Pillars
Lincoln Electric Holdings, Inc. demonstrates solid profitability with a net margin of 12.3% and a return on equity (ROE) of 35.42%. The return on invested capital (ROIC) stands at 19.34%, comfortably above the weighted average cost of capital (WACC) at 9.11%, confirming the company as a clear value creator. Operational efficiency is further supported by a favorable gross margin of 36.36% and an EBIT margin of 17.58%. These metrics highlight strong operational control and effective capital allocation.
Weaknesses and Drawbacks
Despite its strengths, Lincoln Electric faces valuation headwinds with a high price-to-earnings ratio of 25.51 and an elevated price-to-book ratio of 9.03, both flagged as unfavorable. These multiples suggest a premium valuation, raising concerns about potential market overextension. Leverage metrics show a debt-to-equity ratio of 0.88, rated neutral but worth monitoring amid market volatility. Recent trading volume reveals a slight seller dominance at 44.82% buyer participation, indicating short-term selling pressure that could dampen near-term price gains.
Our Final Verdict about Lincoln Electric Holdings, Inc.
Lincoln Electric presents a fundamentally sound and value-creative profile, with profitability metrics and capital returns well above market costs. Despite a bullish long-term trend, recent slight seller dominance suggests a cautious approach. Investors might consider waiting for a more favorable entry point, as current valuation premiums and moderate market pressure could temper upside in the near term.
Disclaimer: This content is for informational purposes only and does not constitute financial, investment, or other professional advice. Investing in financial markets involves a significant risk of loss, and past performance is not indicative of future results.
Additional Resources
- Is It Too Late To Consider Lincoln Electric (LECO) After Its Strong Multi‑Year Run? – Yahoo Finance (Feb 26, 2026)
- Lincoln Electric Holdings, Inc. (NASDAQ:LECO) Given Average Recommendation of “Moderate Buy” by Brokerages – MarketBeat (Feb 26, 2026)
- Decoding Lincoln Electric Holdings Inc (LECO): A Strategic SWOT Insight – GuruFocus (Feb 26, 2026)
- LINCOLN ELECTRIC HOLDINGS INC SEC 10-K Report – TradingView (Feb 25, 2026)
- Lincoln Electric Holdings (LECO) Price Target Increased by 13.75% to 313.08 – Nasdaq (Feb 25, 2026)
For more information about Lincoln Electric Holdings, Inc., please visit the official website: lincolnelectric.com