Home > Analyses > Industrials > Lennox International Inc.
Lennox International shapes the comfort and safety of millions through cutting-edge climate control solutions. As a dominant force in heating, ventilation, air conditioning, and refrigeration, it delivers industry-leading products across residential, commercial, and refrigeration markets. Known for innovation and reliability, Lennox drives efficiency and sustainability worldwide. Yet, as market dynamics evolve, I ask: does Lennox’s current valuation fully reflect its growth potential and operational strength?

Table of contents
Business Model & Company Overview
Lennox International Inc., founded in 1895 and headquartered in Richardson, Texas, leads the heating, ventilation, air conditioning, and refrigeration sectors. Its core business integrates residential, commercial, and refrigeration solutions into a unified ecosystem, serving diverse markets across the Americas, Europe, and Asia. With 14,200 employees, it holds a commanding position in construction-related climate control.
The company’s revenue engine blends durable hardware—furnaces, chillers, and compressors—with software-enabled controls and recurring services such as installation and maintenance. This multi-segment approach fuels steady cash flow and global reach. Lennox’s competitive advantage lies in its comprehensive product range and deep market penetration, creating a robust economic moat that shapes the future of environmental comfort and preservation.
Financial Performance & Fundamental Metrics
I analyze Lennox International Inc.’s income statement, key financial ratios, and dividend payout policy to evaluate its core financial health and shareholder returns.
Income Statement
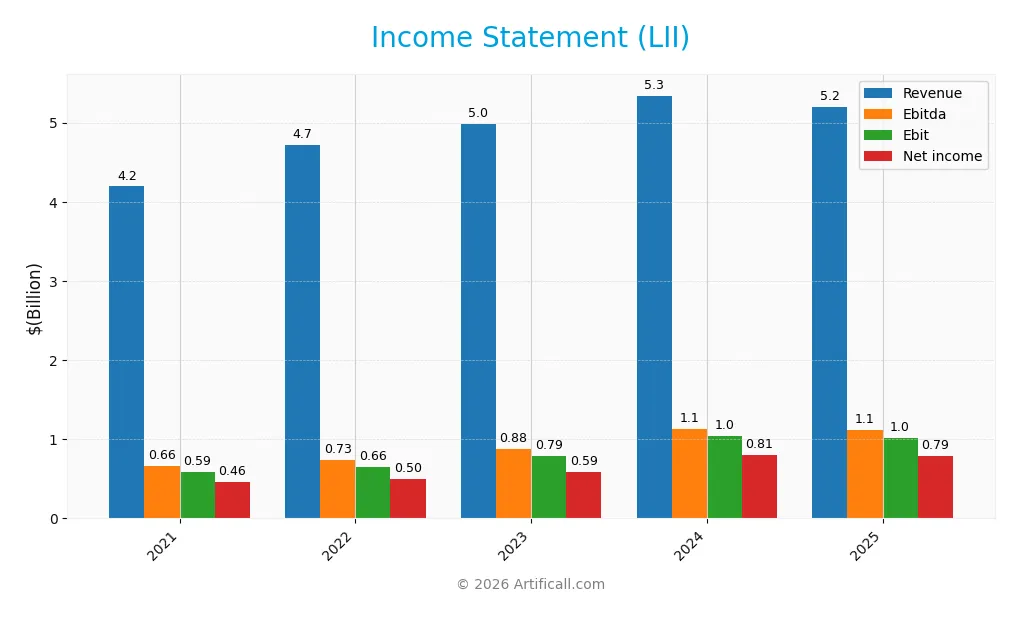
This table summarizes Lennox International Inc.’s key income statement figures for the fiscal years 2021 through 2025, providing a clear view of revenue, expenses, and profitability trends.
| 2021 | 2022 | 2023 | 2024 | 2025 | |
|---|---|---|---|---|---|
| Revenue | 4.19B | 4.72B | 4.98B | 5.34B | 5.20B |
| Cost of Revenue | 3.01B | 3.43B | 3.43B | 3.57B | 3.48B |
| Operating Expenses | 598.1M | 628.5M | 757.7M | 737.1M | 699.7M |
| Gross Profit | 1.19B | 1.28B | 1.55B | 1.77B | 1.72B |
| EBITDA | 658.5M | 733.5M | 879.5M | 1.13B | 1.12B |
| EBIT | 586.1M | 655.6M | 793.5M | 1.04B | 1.01B |
| Interest Expense | 26.0M | 39.8M | 56.0M | 44.1M | 40.9M |
| Net Income | 464.0M | 497.1M | 590.1M | 806.9M | 786.2M |
| EPS | 12.47 | 13.92 | 16.62 | 22.67 | 22.31 |
| Filing Date | 2022-02-15 | 2023-02-21 | 2024-02-13 | 2025-02-11 | 2026-02-17 |
Income Statement Evolution
Lennox International’s revenue grew 24% from 2021 to 2025 but declined 2.7% in 2025 alone. Net income rose 69% overall, with a slight dip last year. Gross and EBIT margins remained stable around 33% and 19%, respectively, indicating consistent operational efficiency despite recent top-line softness.
Is the Income Statement Favorable?
In 2025, Lennox posted $5.2B revenue and $786M net income, yielding a 15.1% net margin. Interest expenses stayed low at 0.8% of revenue, supporting profitability. Despite a minor revenue and EPS contraction last year, the income statement’s fundamentals reflect strong margin control and solid bottom-line growth, resulting in a generally favorable evaluation.
Financial Ratios
The following table presents key financial ratios for Lennox International Inc. over the last five fiscal years:
| Ratios | 2021 | 2022 | 2023 | 2024 | 2025 |
|---|---|---|---|---|---|
| Net Margin | 11.1% | 10.5% | 11.8% | 15.1% | 15.1% |
| ROE | -172% | -245% | 207% | 95% | 68% |
| ROIC | 35% | 30% | 32% | 33% | 26% |
| P/E | 26.0 | 17.2 | 26.9 | 26.9 | 21.6 |
| P/B | -44.9 | -42.1 | 55.7 | 25.5 | 14.6 |
| Current Ratio | 1.42 | 0.94 | 1.41 | 1.43 | 1.60 |
| Quick Ratio | 0.80 | 0.47 | 0.72 | 0.90 | 0.63 |
| D/E | -5.34 | -8.62 | 5.35 | 1.75 | 1.77 |
| Debt-to-Assets | 66.2% | 68.2% | 54.6% | 42.9% | 50.6% |
| Interest Coverage | 22.7 | 16.5 | 14.1 | 23.5 | 24.8 |
| Asset Turnover | 1.93 | 1.84 | 1.78 | 1.54 | 1.27 |
| Fixed Asset Turnover | 5.90 | 6.14 | 5.33 | 4.74 | 4.18 |
| Dividend Yield | 1.05% | 1.66% | 0.97% | 0.74% | 1.02% |
Evolution of Financial Ratios
From 2021 to 2025, Lennox International’s Return on Equity (ROE) showed significant improvement, rising from negative territory to a robust 67.6% in 2025. The Current Ratio increased steadily, indicating enhanced liquidity, reaching 1.6 in 2025. Meanwhile, the Debt-to-Equity Ratio remained high and unfavorable, peaking near 1.77 in 2025, signaling sustained leverage levels despite improving profitability.
Are the Financial Ratios Fovorable?
In 2025, profitability metrics like net margin (15.13%) and ROE (67.6%) are favorable, outperforming typical industry benchmarks. Liquidity presents a mixed picture: the Current Ratio is strong at 1.6, but the Quick Ratio is weak at 0.63. Leverage ratios, including Debt-to-Equity (1.77) and Debt-to-Assets (50.57%), are unfavorable, raising potential risk concerns. Market valuation metrics appear neutral to unfavorable, with a high Price-to-Book ratio of 14.57. Overall, the financial ratios are slightly favorable.
Shareholder Return Policy
Lennox International Inc. maintains a consistent dividend payout ratio near 22%, with dividend per share rising from $3.40 in 2021 to $4.96 in 2025. The annual dividend yield averaged around 1%, supported by free cash flow coverage above 80%, indicating prudent distribution management.
The company also conducts share buybacks, complementing its dividend payments. This balanced approach aligns with sustainable long-term shareholder value, as distributions remain well-covered by cash flow without excessive repurchases that could threaten financial stability.
Score analysis
The following radar chart illustrates Lennox International Inc.’s key financial metric scores for investor evaluation:
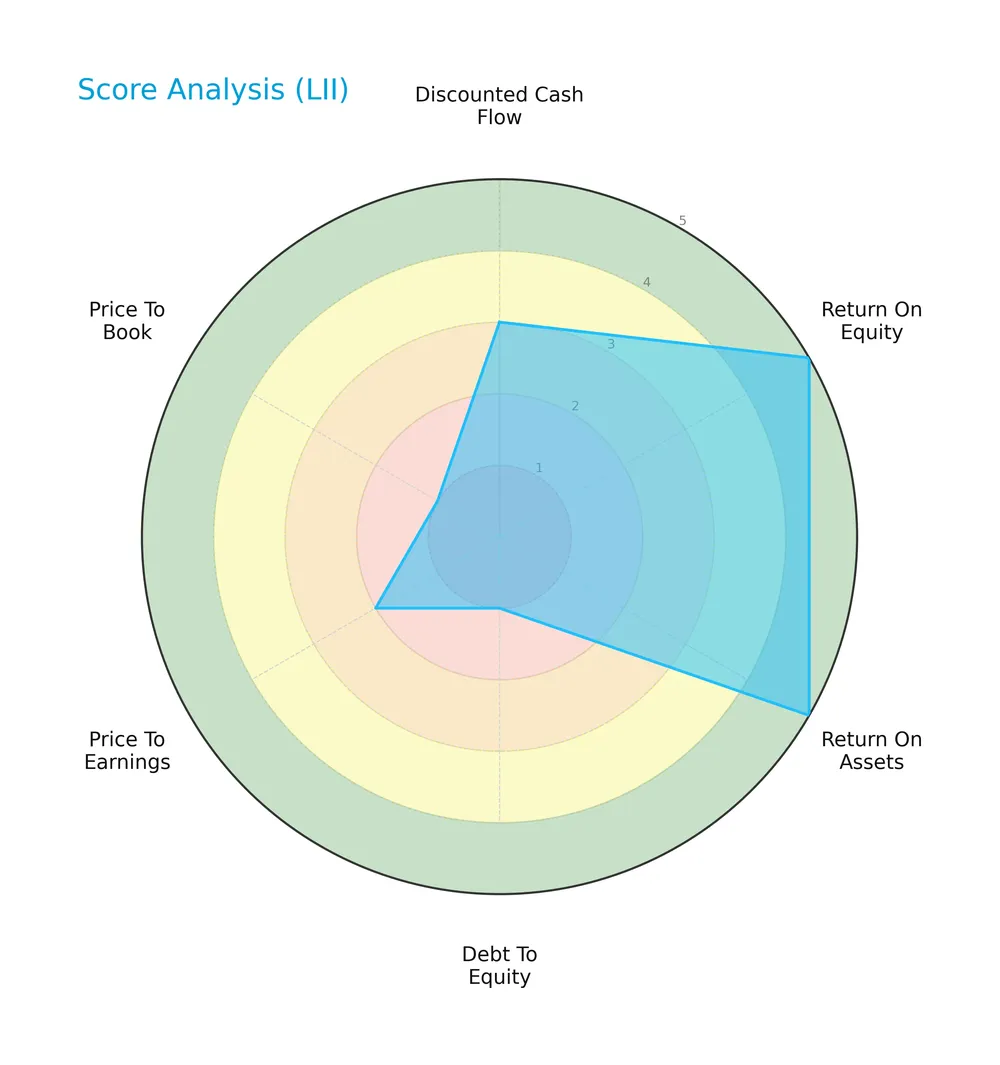
Lennox International scores very favorably on return on equity and assets (both 5), showing strong profitability. However, debt-to-equity (1), price-to-earnings (2), and price-to-book (1) scores indicate unfavorable valuation and leverage concerns. The discounted cash flow score is moderate at 3.
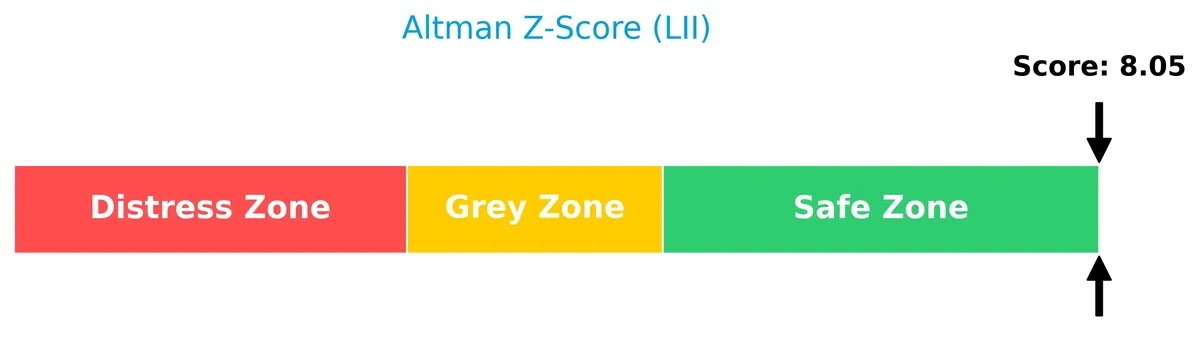
Analysis of the company’s bankruptcy risk
Lennox International’s Altman Z-Score places it well within the safe zone, indicating a low risk of bankruptcy:
Is the company in good financial health?
The Piotroski Score diagram below summarizes the company’s current financial health status:

With a Piotroski Score of 5, Lennox International exhibits average financial health, reflecting moderate strength but room for improvement in profitability, leverage, and efficiency metrics.
Competitive Landscape & Sector Positioning
This analysis explores Lennox International Inc.’s strategic positioning within the industrials sector. I will examine its revenue segments, key products, and main competitors. I will also assess whether Lennox International holds a competitive advantage over its peers.
Strategic Positioning
Lennox International focuses on a concentrated product portfolio within heating, cooling, and refrigeration. Its revenue derives primarily from Residential (3.34B) and Commercial Heating & Cooling (1.85B), with limited international exposure around 250M, signaling a US-centric geographic stance.
Revenue by Segment
This pie chart displays Lennox International Inc.’s revenue breakdown by product segment for fiscal year 2025, illustrating the relative contributions of its heating and cooling divisions.
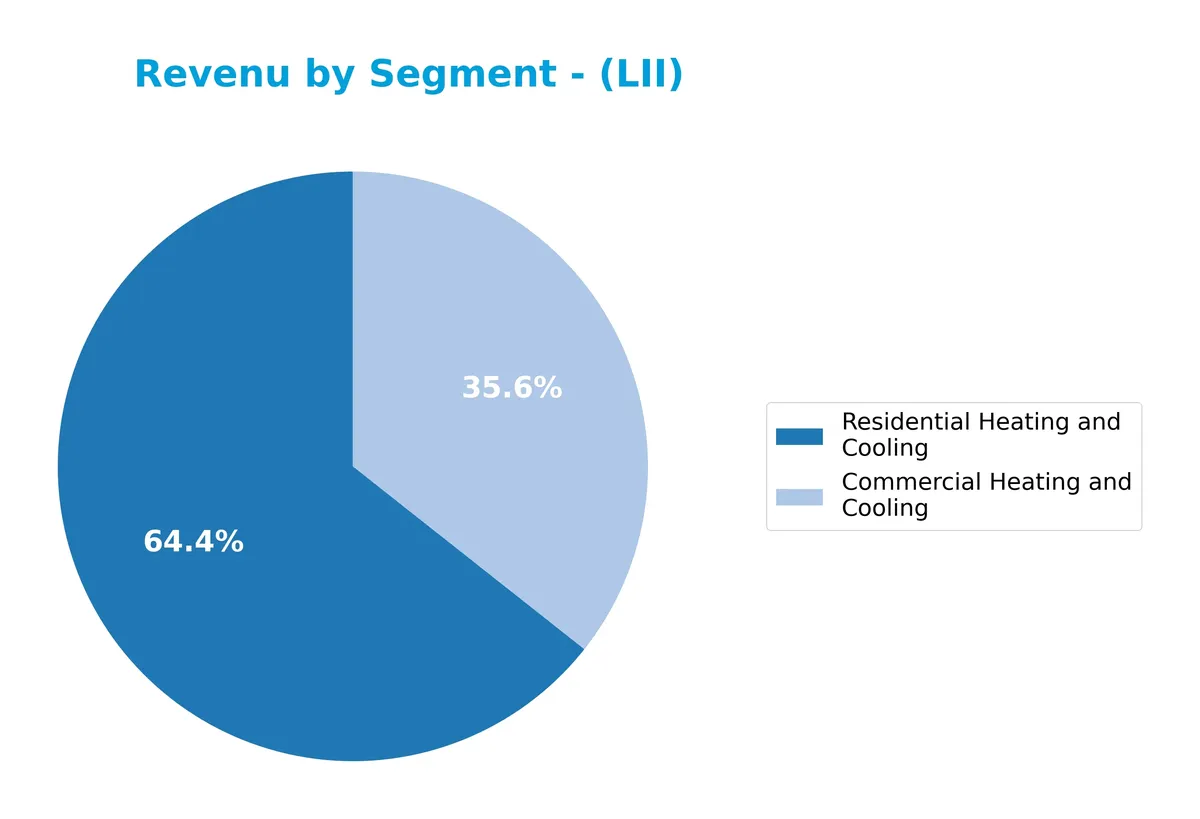
Residential Heating and Cooling remains the dominant segment at $3.34B, followed by Commercial Heating and Cooling at $1.85B. Compared to 2024, residential revenue declined slightly from $3.58B, while commercial heating grew modestly from $1.76B. The business continues to rely heavily on heating and cooling, with a recent mild shift toward commercial solutions, signaling a potential rebalancing of its revenue base.
Key Products & Brands
The table below outlines Lennox International’s main products and brands across its core business segments:
| Product | Description |
|---|---|
| Residential Heating & Cooling | Furnaces, air conditioners, heat pumps, packaged systems, indoor air quality equipment, controls, and replacement parts. |
| Commercial Heating & Cooling | Unitary heating and air conditioning equipment, applied systems, controls, installation, service, and variable refrigerant flow products. |
| Refrigeration | Condensing units, unit coolers, fluid coolers, air cooled condensers, air handlers, refrigeration rack systems, and industrial chillers. |
Lennox International focuses on three primary segments: residential HVAC, commercial HVAC, and refrigeration. These categories cover a broad range of climate control and refrigeration solutions for diverse markets, including residential, commercial, and industrial applications.
Main Competitors
There are 6 main competitors in the Industrials sector, with the table listing the top 6 leaders by market capitalization:
| Competitor | Market Cap. |
|---|---|
| Trane Technologies plc | 88.3B |
| Johnson Controls International plc | 80.0B |
| Carrier Global Corporation | 45.1B |
| Lennox International Inc. | 17.5B |
| Masco Corporation | 13.4B |
| Builders FirstSource, Inc. | 11.6B |
Lennox International Inc. ranks 4th among these competitors. Its market cap stands at 22.47% of the leader, Trane Technologies plc. The company sits below both the average market cap of the top 10 (42.6B) and the median market cap in the sector (31.3B). Lennox shows a significant gap of +127.27% to its next competitor above, Carrier Global Corporation.
Comparisons with competitors
Check out how we compare the company to its competitors:
Does LII have a competitive advantage?
Lennox International Inc. demonstrates a slight competitive advantage with a ROIC exceeding WACC by 16.9%, indicating value creation despite a declining ROIC trend. Its gross margin of 33.0% and net margin of 15.1% remain favorable compared to industry peers.
Looking ahead, Lennox leverages opportunities in residential and commercial heating and cooling markets, alongside refrigeration segments, supported by steady international exposure. The company’s focus on new products and market expansion could help offset recent revenue declines and sustain growth momentum.
SWOT Analysis
This analysis highlights Lennox International’s internal capabilities and external environment to guide strategic decisions.
Strengths
- strong ROIC well above WACC
- robust EBIT margin near 20%
- diversified product segments across residential, commercial, refrigeration
Weaknesses
- declining ROIC trend
- high debt-to-equity ratio at 1.77
- weak quick ratio at 0.63 signals liquidity pressure
Opportunities
- expanding HVAC demand in new construction
- potential growth in international markets
- technological advances in energy-efficient systems
Threats
- raw material cost volatility
- competition from low-cost manufacturers
- economic slowdown impacting construction sector
Lennox International’s solid profitability and product diversification provide a competitive edge. However, rising leverage and liquidity concerns require cautious capital management. Growth initiatives should focus on international expansion and innovation while mitigating supply chain and market risks.
Stock Price Action Analysis
The weekly price chart for Lennox International Inc. (LII) shows notable upward momentum with accelerating gains over the past year:
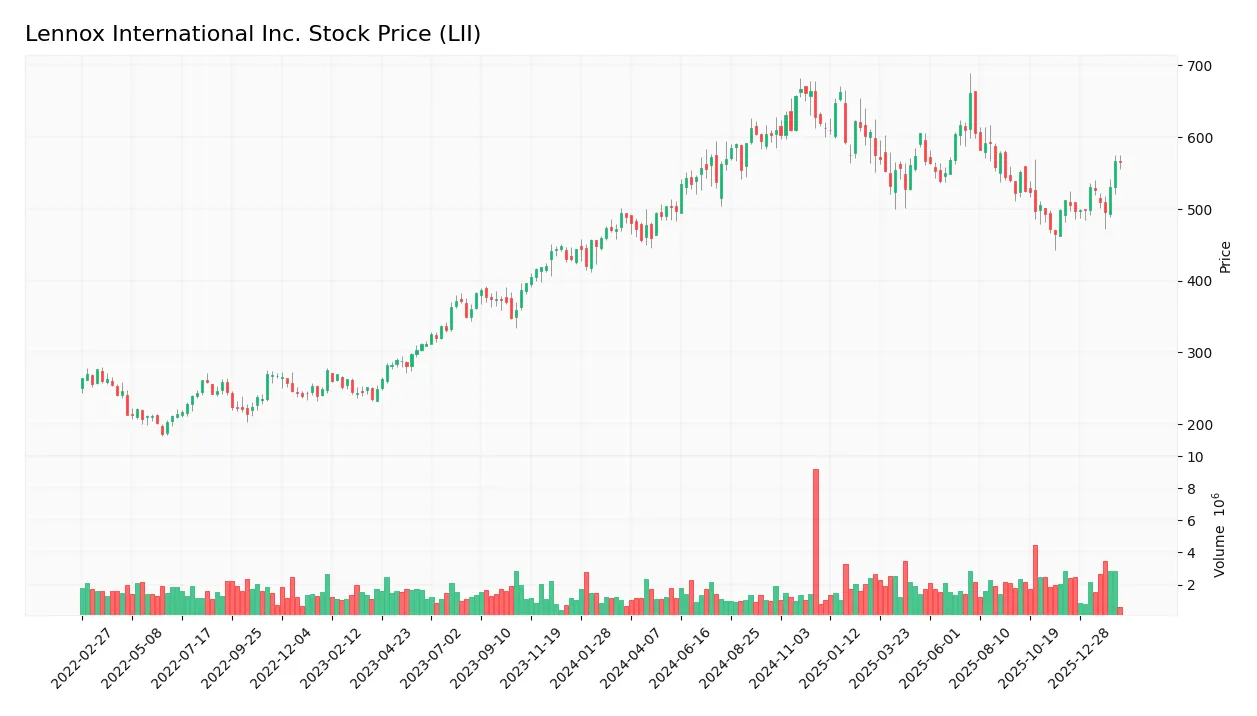
Trend Analysis
Over the past 12 months, LII’s stock price rose 15.7%, signaling a clear bullish trend. The upward movement accelerated, with prices ranging from a low of 457.15 to a high of 667.13. Price volatility is high, reflected by a standard deviation of 52.05, indicating active trading and significant price swings.
Volume Analysis
Trading volume for LII is increasing, with total volume reaching 206M shares. Sellers slightly dominate recent activity, with 52% of volume, though buyer participation remains nearly balanced at 48%. This suggests cautious investor sentiment and balanced market engagement in the past three months.
Target Prices
Analysts set a consensus target price reflecting moderate upside potential for Lennox International Inc.
| Target Low | Target High | Consensus |
|---|---|---|
| 450 | 667 | 555 |
The target range from 450 to 667 shows analysts expect Lennox to appreciate, with a consensus near 555 indicating confident, yet measured growth expectations.

Don’t Let Luck Decide Your Entry Point
Optimize your entry points with our advanced ProRealTime indicators. You’ll get efficient buy signals with precise price targets for maximum performance. Start outperforming now!
Analyst & Consumer Opinions
This section examines recent analyst ratings and consumer feedback related to Lennox International Inc. (LII).
Stock Grades
Here is a summary of recent analyst grades for Lennox International Inc., reflecting a range of opinions from industry leaders:
| Grading Company | Action | New Grade | Date |
|---|---|---|---|
| Morgan Stanley | Maintain | Underweight | 2026-02-02 |
| Wells Fargo | Maintain | Equal Weight | 2026-01-29 |
| RBC Capital | Maintain | Sector Perform | 2026-01-29 |
| JP Morgan | Maintain | Underweight | 2026-01-16 |
| Barclays | Maintain | Overweight | 2026-01-07 |
| Barclays | Maintain | Overweight | 2025-12-11 |
| Wells Fargo | Maintain | Equal Weight | 2025-12-04 |
| Wolfe Research | Upgrade | Peer Perform | 2025-11-13 |
| UBS | Maintain | Neutral | 2025-10-27 |
| RBC Capital | Maintain | Sector Perform | 2025-10-23 |
The grades show a balanced mix of ratings, with multiple firms maintaining neutral to moderate positions. Notably, Wolfe Research upgraded its rating, suggesting selective optimism amid generally cautious sentiment.
Consumer Opinions
Lennox International Inc. enjoys a generally favorable consumer sentiment, driven by product reliability and customer service.
| Positive Reviews | Negative Reviews |
|---|---|
| “Excellent HVAC systems that last for years.” | “Repair costs are higher than expected.” |
| “Responsive customer support and helpful technicians.” | “Installation delays disrupted my schedule.” |
| “Energy-efficient products that reduce utility bills.” | “Limited availability of certain replacement parts.” |
Overall, consumers praise Lennox for durable, efficient products and solid support. However, repair expenses and service timing issues remain recurring concerns.
Risk Analysis
Below is a summary table highlighting key risks Lennox International Inc. faces, including their likelihood and potential impact:
| Category | Description | Probability | Impact |
|---|---|---|---|
| Debt Levels | High debt-to-equity ratio (1.77) increases financial risk. | High | Moderate |
| Liquidity | Low quick ratio (0.63) signals potential short-term strain. | Moderate | Moderate |
| Valuation | Elevated price-to-book ratio (14.57) suggests overvaluation. | Moderate | Moderate |
| Market Volatility | Beta of 1.19 indicates above-market price swings risk. | Moderate | Moderate |
| Competitive Pressure | Intense competition in HVAC and refrigeration sectors. | Moderate | High |
Lennox’s biggest red flags are its high leverage and weak quick ratio, which could stress liquidity during downturns. Despite a strong Altman Z-Score (8.05, safe zone), debt remains a vulnerability. The company’s premium valuation also warrants caution amid cyclical risks in construction and industrial markets.
Should You Buy Lennox International Inc.?
Lennox International appears to be delivering robust value creation supported by a slightly favorable moat, evidenced by positive ROIC exceeding WACC despite a declining trend. While operational efficiency seems strong, the leverage profile remains substantial, resulting in a moderate B rating.
Strength & Efficiency Pillars
Lennox International Inc. displays robust operational efficiency with a net margin of 15.13% and an impressive return on equity of 67.6%. Its return on invested capital (ROIC) stands at 25.51%, significantly exceeding the weighted average cost of capital (WACC) at 8.64%. This gap confirms the company as a clear value creator. Strong asset turnover (1.27) and fixed asset turnover (4.18) further underscore efficient capital deployment. Despite a declining ROIC trend, the firm maintains solid profitability and operational discipline.
Weaknesses and Drawbacks
The company’s valuation signals caution, with a high price-to-book ratio of 14.57 considered very unfavorable, suggesting the stock trades at a premium relative to book value. Although the price-to-earnings ratio of 21.56 is neutral, Lennox International carries elevated leverage, reflected in a debt-to-equity ratio of 1.77 and a debt-to-assets ratio above 50%, both unfavorable. The quick ratio of 0.63 raises liquidity concerns despite a healthy current ratio of 1.6. These factors increase financial risk and reduce margin for error in a downturn.
Our Final Verdict about Lennox International Inc.
Lennox International may appear attractive for long-term exposure given its strong profitability and value-creating capacity. The overall bullish trend and acceleration in price (+15.7%) support positive momentum. However, recent neutral buyer dominance (46%) and elevated leverage advise prudence. Investors might consider a measured approach, as the premium valuation and financial structure suggest sensitivity to market shifts. The profile balances operational strength with notable risks, making it suitable for those with moderate risk tolerance.
Disclaimer: This content is for informational purposes only and does not constitute financial, investment, or other professional advice. Investing in financial markets involves a significant risk of loss, and past performance is not indicative of future results.
Additional Resources
- When Should You Buy Lennox International Inc. (NYSE:LII)? – Yahoo Finance (Feb 12, 2026)
- Lennox International, Inc. $LII Shares Bought by Prescott Group Capital Management L.L.C. – MarketBeat (Feb 13, 2026)
- LII: Low inventory, new tech, and cost controls set the stage for growth and margin stability – TradingView (Feb 17, 2026)
- Lennox International Inc. (NYSE:LII) Q4 2025 earnings call transcript – MSN (Jan 28, 2026)
- Lennox International shares slide after Q4 earnings and revenue miss (LII:NYSE) – Seeking Alpha (Jan 28, 2026)
For more information about Lennox International Inc., please visit the official website: lennoxinternational.com