Home > Analyses > Consumer Cyclical > Lennar Corporation
Lennar Corporation constructs the homes where millions build their lives. As one of the largest U.S. homebuilders, it shapes residential communities across key regions. Lennar’s integrated model spans single-family homes, multifamily rentals, and financial services, demonstrating innovation in both construction and customer financing. With a reputation for quality and market influence, I ask: do Lennar’s fundamentals still support its premium valuation and growth prospects in today’s housing market?

Table of contents
Business Model & Company Overview
Lennar Corporation, founded in 1954 and headquartered in Miami, Florida, stands as a leading force in the residential construction sector. It operates a cohesive ecosystem across Homebuilding East, Central, Texas, and West segments, delivering single-family homes and multifamily rental properties. Lennar serves a broad spectrum of buyers, from first-time to luxury homeowners, integrating development, construction, and property management under one roof.
The company’s revenue engine balances homebuilding with financial services, including mortgage financing and title insurance—a strategic blend that enhances customer value. While primarily U.S.-focused, Lennar’s diverse operations reflect strong positioning across multiple regions. Its competitive advantage lies in integrating construction with financing, creating a durable economic moat that shapes the future of American homebuilding.
Financial Performance & Fundamental Metrics
I analyze Lennar Corporation’s income statement, key financial ratios, and dividend payout policy to assess its profitability, efficiency, and shareholder returns.
Income Statement
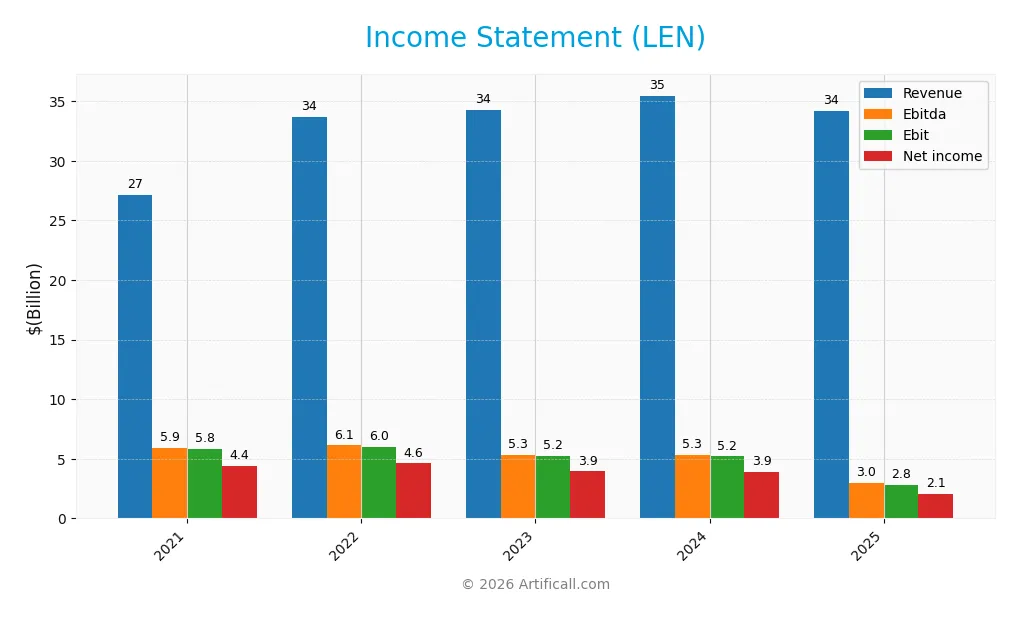
This table summarizes Lennar Corporation’s key income statement figures for fiscal years 2021 through 2025, all values in USD.
| 2021 | 2022 | 2023 | 2024 | 2025 | |
|---|---|---|---|---|---|
| Revenue | 27.14B | 33.71B | 34.29B | 35.48B | 34.19B |
| Cost of Revenue | 19.80B | 24.50B | 26.06B | 27.46B | 28.12B |
| Operating Expenses | 2.25B | 2.45B | 2.81B | 3.21B | 3.32B |
| Gross Profit | 7.34B | 9.20B | 8.23B | 8.01B | 6.07B |
| EBITDA | 5.93B | 6.12B | 5.33B | 5.32B | 2.96B |
| EBIT | 5.84B | 6.03B | 5.22B | 5.20B | 2.83B |
| Interest Expense | 20.14M | 19.13M | 15.43M | 18.77M | 13.87M |
| Net Income | 4.43B | 4.61B | 3.94B | 3.93B | 2.06B |
| EPS | 14.28 | 15.74 | 13.73 | 14.31 | 7.98 |
| Filing Date | 2022-01-28 | 2023-01-26 | 2024-01-26 | 2025-01-23 | 2026-01-28 |
Income Statement Evolution
Lennar’s revenue grew 26% from 2021 to 2025 but declined 3.6% in the latest year. Net income dropped sharply by over 50% across the period, with a 45.7% fall in the last year. Gross and EBIT margins remained mostly stable but narrowed recently, reflecting margin pressure amid lower profits.
Is the Income Statement Favorable?
In 2025, Lennar posted $34.2B revenue and $2.06B net income, translating to a 6.02% net margin, considered favorable. However, the 45% year-over-year declines in EBIT and net income reveal weakening fundamentals. Interest expense remained low at 0.04% of revenue, a positive, but overall income trends suggest an unfavorable stance on profitability.
Financial Ratios
The table below presents key financial ratios for Lennar Corporation over the last five fiscal years, reflecting its profitability, valuation, liquidity, leverage, and efficiency metrics:
| Ratios | 2021 | 2022 | 2023 | 2024 | 2025 |
|---|---|---|---|---|---|
| Net Margin | 16% | 14% | 11% | 11% | 6% |
| ROE | 21% | 19% | 15% | 14% | 9% |
| ROIC | 13% | 15% | 12% | 10% | 7% |
| P/E | 7.3x | 5.5x | 9.2x | 12.1x | 16.3x |
| P/B | 1.55x | 1.06x | 1.36x | 1.70x | 1.53x |
| Current Ratio | 5.1 | 4.8 | 4.0 | 3.4 | 3.1 |
| Quick Ratio | 0.92 | 1.10 | 1.23 | 0.85 | 0.96 |
| D/E | 0.31 | 0.26 | 0.19 | 0.16 | 0.29 |
| Debt-to-Assets | 20% | 17% | 13% | 11% | 18% |
| Interest Coverage | 253x | 353x | 351x | 256x | 198x |
| Asset Turnover | 0.82 | 0.89 | 0.87 | 0.86 | 0.99 |
| Fixed Asset Turnover | 55x | 67x | 62x | 45x | 37x |
| Dividend Yield | 1.0% | 1.5% | 1.2% | 1.2% | 1.6% |
Evolution of Financial Ratios
Return on Equity (ROE) declined steadily from 21.3% in 2021 to 9.4% in 2025, signaling reduced profitability. The Current Ratio also decreased from 5.06 to 3.12, indicating lower liquidity but remaining above 1. Debt-to-Equity Ratio improved from 0.31 to 0.29, reflecting a modest reduction in leverage. Profit margins shrank notably, with net margin dropping from 16.3% to 6.0%.
Are the Financial Ratios Favorable?
In 2025, Lennar’s profitability ratios appear mixed: ROE is unfavorable due to a decline below the 10% threshold, while net margin and ROIC remain neutral relative to sector norms. Liquidity shows some concern as the Current Ratio is marked unfavorable despite a neutral Quick Ratio. Leverage metrics are favorable, with low debt-to-equity and strong interest coverage above 200x. Efficiency is neutral, supported by near 1x asset turnover. Market valuation ratios like P/E and P/B are neutral, suggesting a balanced investor perception overall.
Shareholder Return Policy
Lennar Corporation maintains a dividend payout ratio around 10-25%, with a dividend yield near 1.5% in 2025. Dividends per share have steadily increased from $1.01 in 2021 to $2.02 in 2025. The company supports payouts with positive free cash flow coverage, though the price-to-free cash flow ratio spikes notably in 2025.
Lennar also engages in share buybacks, complementing dividends as part of capital return. While distributions appear sustainable given earnings and cash flow trends, the elevated free cash flow price ratio in 2025 could signal caution. Overall, the policy aligns with prudent long-term value creation, balancing shareholder returns against operational liquidity.
Score analysis
The following radar chart illustrates Lennar Corporation’s key financial scores across valuation, profitability, and leverage metrics:
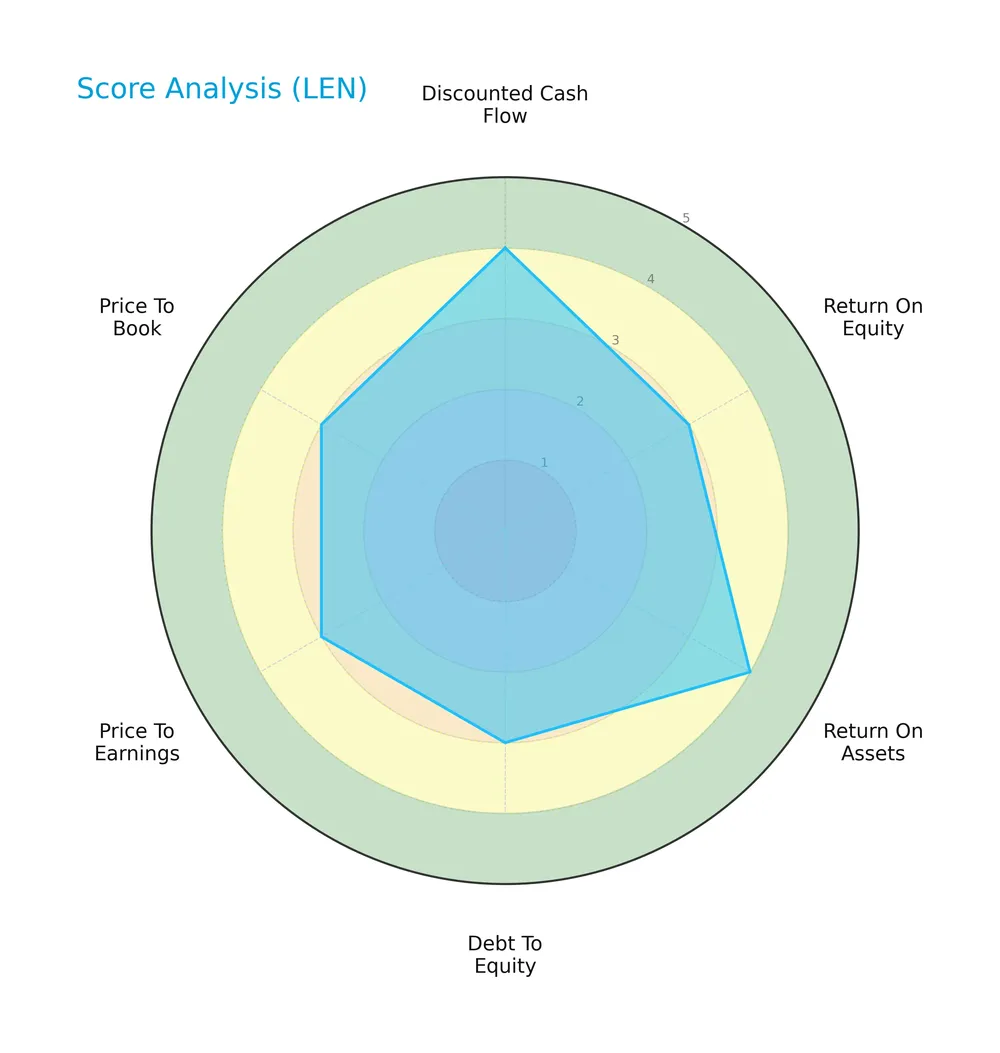
Lennar posts favorable discounted cash flow and return on assets scores at 4 each. Return on equity, debt to equity, price to earnings, and price to book show moderate scores of 3, reflecting balanced strengths and some caution areas.
Analysis of the company’s bankruptcy risk
Lennar’s Altman Z-Score places it firmly in the safe zone, signaling low bankruptcy risk and solid financial stability:

Is the company in good financial health?
This Piotroski diagram displays Lennar’s current financial health as measured by key operational and profitability factors:

With a Piotroski Score of 5 categorized as average, Lennar demonstrates moderate financial strength but leaves room for improvement to reach strong health status.
Competitive Landscape & Sector Positioning
This analysis examines Lennar Corporation’s strategic positioning, revenue segments, key products, main competitors, and competitive advantages. I will assess whether Lennar holds a sustainable competitive advantage over its peers in residential construction.
Strategic Positioning
Lennar Corporation concentrates on residential construction across multiple U.S. regions, with over $32B in homebuilding revenue in 2025. It diversifies within housing types and financial services, including mortgages and multifamily properties, offering a broad but domestic-focused portfolio.
Revenue by Segment
The pie chart depicts Lennar Corporation’s revenue distribution by segment for fiscal year 2025, illustrating the relative contribution of each business line during this period.
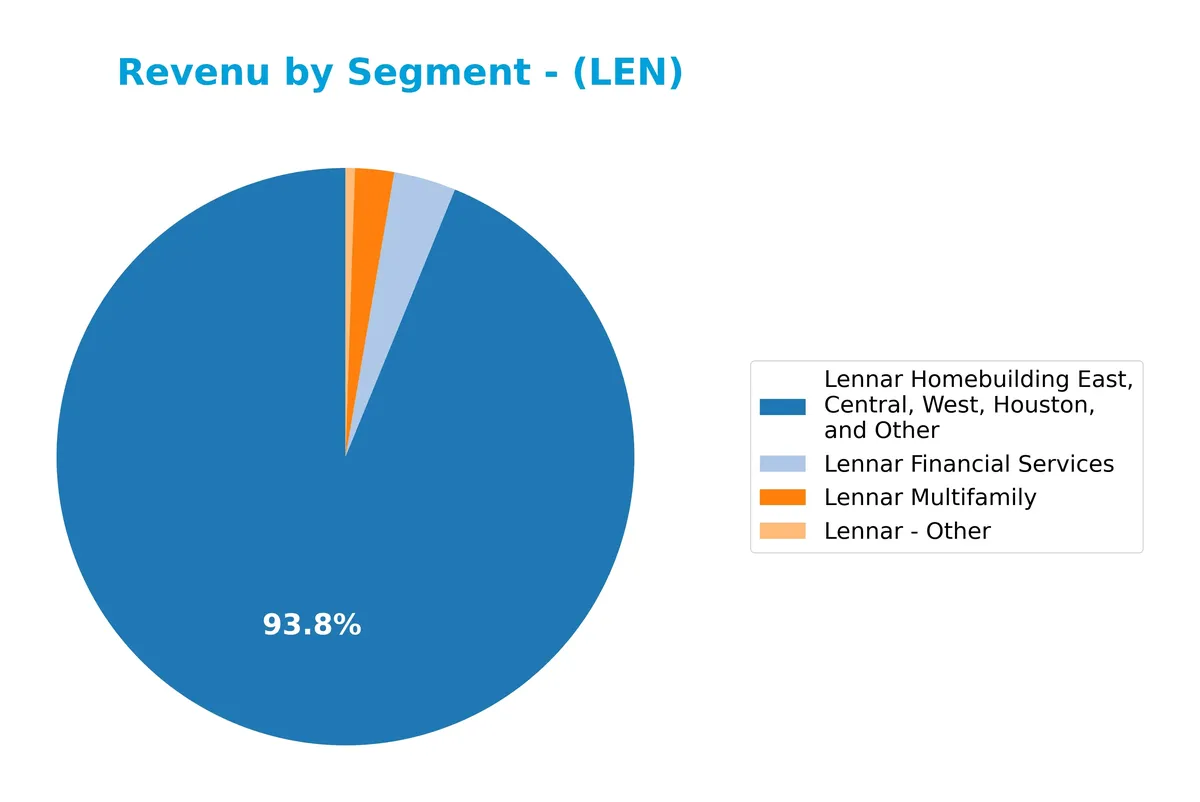
Lennar’s core revenue driver remains its Homebuilding segment, generating a commanding $32.3B in 2025, though slightly down from $33.9B in 2024. Financial Services steadily grew to $1.2B, reflecting strong capital allocation in lending operations. Multifamily revenue accelerated to $750M, marking a notable expansion. The “Other” segment remains marginal at $179M. The company shows concentration risk in homebuilding but diversifies with growth in financial and multifamily units.
Key Products & Brands
Lennar’s revenue streams span homebuilding, financial services, multifamily properties, and other related activities:
| Product | Description |
|---|---|
| Lennar Homebuilding | Construction and sale of single-family attached and detached homes across East, Central, West, Houston regions. |
| Lennar Financial Services | Residential mortgage financing, title insurance, closing services, and commercial mortgage loan securitization. |
| Lennar Multifamily | Development, construction, and management of multifamily rental properties. |
| Lennar – Other | Includes various other business segments not captured under main categories. |
Lennar’s core business relies heavily on homebuilding, generating over $32B in 2025. Financial services and multifamily segments provide substantial diversification with $1.2B and $750M revenue, respectively. Other operations remain a minor share.
Main Competitors
There are 4 competitors in the Residential Construction industry; below are the top 4 leaders by market capitalization:
| Competitor | Market Cap. |
|---|---|
| D.R. Horton, Inc. | 42.6B |
| Lennar Corporation | 26.3B |
| PulteGroup, Inc. | 23.2B |
| NVR, Inc. | 20.6B |
Lennar Corporation ranks 2nd among its competitors with a market cap 70% the size of the leader, D.R. Horton. It stands above both the average market cap of the top 10 and the sector median, showing strong scale. Lennar enjoys a 43% market cap premium over PulteGroup, its nearest smaller rival.
Comparisons with competitors
Check out how we compare the company to its competitors:
Does Lennar Corporation have a competitive advantage?
Lennar Corporation currently lacks a competitive advantage, as its return on invested capital (ROIC) is below its weighted average cost of capital (WACC), indicating value destruction. The company’s ROIC trend also shows a significant decline, reflecting diminishing profitability over recent years.
Looking ahead, Lennar’s broad U.S. geographic footprint and diversified homebuilding segments provide opportunities for market expansion and product development. However, recent unfavorable income growth and margin trends highlight challenges the company must address to regain competitive strength.
SWOT Analysis
This SWOT analysis highlights Lennar Corporation’s key internal and external factors shaping its strategic outlook.
Strengths
- Strong market presence in key US regions
- Diverse homebuilding segments
- Favorable debt levels and interest coverage
Weaknesses
- Declining ROIC indicates value destruction
- Negative net income growth over recent years
- Weak revenue growth momentum in latest fiscal year
Opportunities
- Expansion in multifamily rental properties
- Growing demand for luxury and active adult homes
- Residential mortgage and financial services integration
Threats
- Housing market cyclicality and economic downturn risk
- Rising interest rates impacting affordability
- Competitive pressures in regional markets
Lennar’s solid footprint and financial discipline stand out amid profitability challenges. The company must leverage growth opportunities while addressing declining returns to sustain long-term value creation.
Stock Price Action Analysis
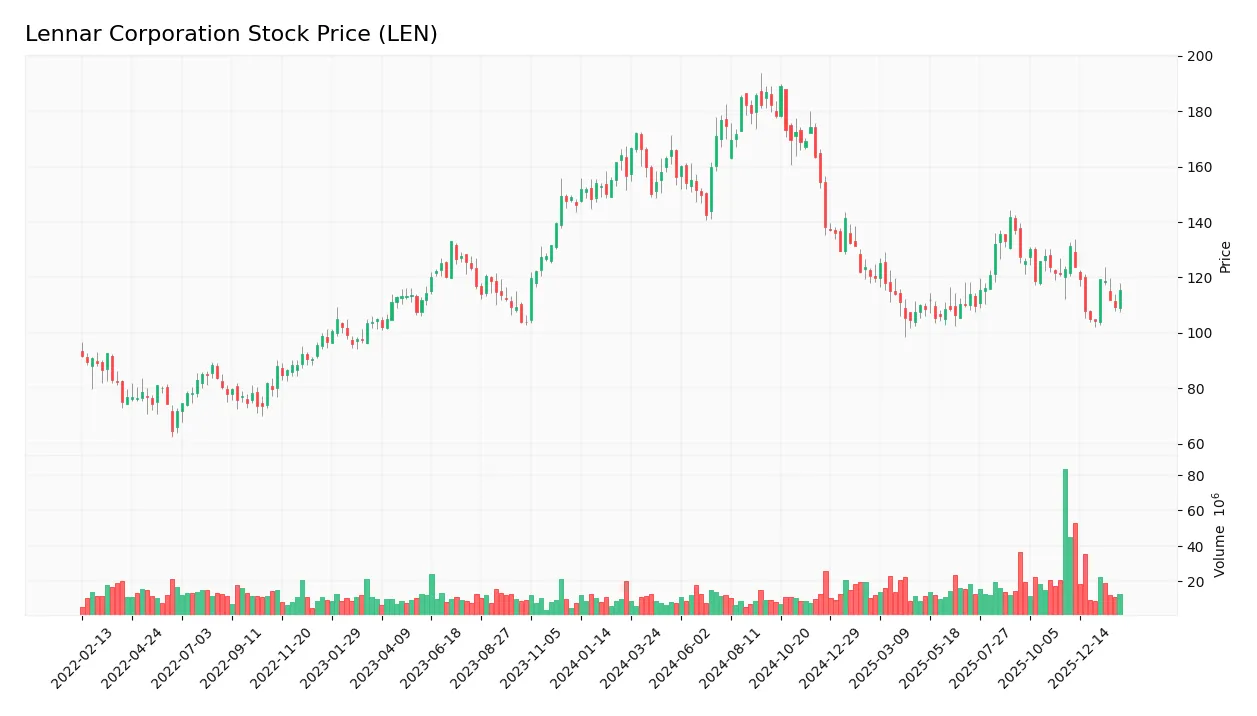
The weekly stock chart presents Lennar Corporation’s price movement over the past 12 months, highlighting key fluctuations and trend shifts:
Trend Analysis
Over the past 12 months, LEN’s stock price declined by 26.31%, indicating a bearish trend. The price showed deceleration with a high volatility of 25.87. The stock peaked at 188.93 and bottomed at 104.22, confirming a sustained downward momentum.
Volume Analysis
Trading volume over the last three months increased, with buyer volume nearly matching sellers at 49.42% dominance. This neutral buyer behavior amid rising volume suggests balanced market participation without clear buying pressure.
Target Prices
Analysts set a clear price target consensus for Lennar Corporation, reflecting moderate growth expectations.
| Target Low | Target High | Consensus |
|---|---|---|
| 88 | 140 | 106.88 |
The target range indicates confidence in Lennar’s upside potential, with a consensus price suggesting a solid 10-15% appreciation from current levels.

Don’t Let Luck Decide Your Entry Point
Optimize your entry points with our advanced ProRealTime indicators. You’ll get efficient buy signals with precise price targets for maximum performance. Start outperforming now!
Analyst & Consumer Opinions
This section examines Lennar Corporation’s recent analyst ratings alongside key consumer feedback to gauge market sentiment.
Stock Grades
The following table summarizes recent stock grades for Lennar Corporation from leading financial institutions:
| Grading Company | Action | New Grade | Date |
|---|---|---|---|
| Citigroup | Maintain | Neutral | 2026-01-08 |
| Citizens | Downgrade | Market Perform | 2026-01-07 |
| UBS | Downgrade | Neutral | 2026-01-06 |
| Wells Fargo | Maintain | Equal Weight | 2026-01-06 |
| JP Morgan | Maintain | Underweight | 2025-12-18 |
| Keefe, Bruyette & Woods | Maintain | Market Perform | 2025-12-18 |
| UBS | Maintain | Buy | 2025-12-18 |
| RBC Capital | Downgrade | Underperform | 2025-12-18 |
| Barclays | Maintain | Underweight | 2025-12-18 |
| Evercore ISI Group | Downgrade | Underperform | 2025-12-18 |
The grade trend shows a cautious stance with multiple downgrades from buy or outperform ratings to neutral or underperform. Consensus still leans toward a buy, but the cluster of downgrades signals increased analyst caution.
Consumer Opinions
Consumers express mixed emotions about Lennar Corporation’s homebuilding experience, reflecting both satisfaction and frustration.
| Positive Reviews | Negative Reviews |
|---|---|
| “Quality construction and modern designs.” | “Delays in closing and final walkthroughs.” |
| “Responsive customer service during build.” | “Unexpected cost increases midway.” |
| “Good value for the price paid.” | “Issues with post-sale repairs and follow-up.” |
Overall, buyers appreciate Lennar’s design quality and customer responsiveness. However, recurring complaints about delays and cost overruns signal operational challenges that could impact buyer confidence.
Risk Analysis
Below is a concise overview of key risks affecting Lennar Corporation’s outlook and financial stability:
| Category | Description | Probability | Impact |
|---|---|---|---|
| Market Cyclicality | Housing demand fluctuates with economic cycles and interest rates | High | High |
| Interest Rates | Rising rates increase mortgage costs, reducing homebuyer demand | High | High |
| Liquidity | Current ratio unusually high, may signal inefficient asset use | Medium | Medium |
| Profitability | ROE is weak relative to WACC, indicating capital return issues | Medium | Medium |
| Regulatory | Changes in construction or environmental regulations | Low | Medium |
I emphasize market cyclicality and interest rate risks as most critical. Historically, residential construction firms like Lennar suffer sharp demand drops during rate hikes and recessions. The company’s strong liquidity cushions shocks but also suggests capital inefficiency. ROE below WACC warns of modest shareholder value creation. Overall, prudent risk management remains essential in this volatile sector.
Should You Buy Lennar Corporation?
Lennar’s profitability appears robust but its competitive moat could be seen as eroding given declining ROIC versus WACC. Despite a manageable leverage profile, the overall rating suggests a favorable A- status, reflecting solid value creation amid operational challenges.
Strength & Efficiency Pillars
Lennar Corporation maintains a solid financial footing, evidenced by a strong Altman Z-score of 4.03, placing it comfortably in the safe zone for bankruptcy risk. The company’s debt-to-equity ratio stands at a favorable 0.29, supporting a healthy capital structure. Interest coverage is robust at 203.82, ensuring ample buffer for debt servicing. While ROIC at 6.62% lags slightly behind the WACC of 9.27%, indicating value is currently being shed, the stable net margin of 6.02% and average Piotroski score of 5 reflect moderate operational resilience.
Weaknesses and Drawbacks
Lennar faces significant challenges. The stock’s bearish trend, with a 26.31% overall price decline and decelerating momentum, signals market pressure. Recent revenue and net income growth rates are negative, with net income shrinking by 53.54% over the period, revealing operational stress. The current ratio is an unfavorable 3.12, which may suggest inefficient working capital management despite liquidity. Moderately valued at a P/E of 16.31 and P/B of 1.53, Lennar carries risk from subdued profitability and a declining ROIC trend of -47.5%.
Our Verdict about Lennar Corporation
Lennar’s long-term fundamentals appear unfavorable due to declining profitability and value destruction. Despite a safe financial health profile, the bearish technical trend and negative earnings growth suggest caution. While recent buyer dominance is neutral at 49.42%, the ongoing price weakness might warrant a wait-and-see approach. This profile may appear suitable for investors seeking exposure after a potential recovery but currently suggests limited upside.
Disclaimer: This content is for informational purposes only and does not constitute financial, investment, or other professional advice. Investing in financial markets involves a significant risk of loss, and past performance is not indicative of future results.
Additional Resources
- Lennar, Taylor Morrison Among Builders Reportedly Working On ‘Trump Homes’ Plan For About A Million Units: LEN, TMHC Stocks Rise – Stocktwits (Feb 03, 2026)
- Lennar Corp (LEN) Trading 5.33% Higher on Feb 3 – GuruFocus (Feb 03, 2026)
- Lennar Corporation (LEN) Releases Q4 2025 Earnings: Revenue and EPS Down Sharply – Quiver Quantitative (Jan 28, 2026)
- Why Is Lennar (LEN) Up 8.2% Since Last Earnings Report? – Yahoo Finance (Jan 15, 2026)
- Lennar, Taylor Morrison Plan 1 Million ‘Trump Homes’ Project To Address Housing Affordability: Report – Benzinga (Feb 04, 2026)
For more information about Lennar Corporation, please visit the official website: lennar.com