Home > Analyses > Technology > Leidos Holdings, Inc.
Leidos Holdings transforms national security and public health through cutting-edge technology and systems integration. Its solutions power critical missions across defense, civil aviation, and healthcare, shaping how governments and industries operate globally. Renowned for innovation and scale, Leidos commands a unique position in information technology services. As the market evolves, I explore whether its robust fundamentals still support its valuation and growth prospects in an increasingly competitive landscape.

Table of contents
Business Model & Company Overview
Leidos Holdings, Inc., founded in 1969 and headquartered in Reston, Virginia, commands a dominant position in information technology services. Its core mission integrates defense, civil, and health solutions into a cohesive ecosystem supporting national security, government agencies, and commercial clients. Leidos leverages advanced technology and large-scale systems to deliver critical services across air, land, sea, space, and cyberspace domains.
The company’s revenue engine balances robust Defense Solutions with Civil and Health segments, combining hardware, software, and recurring IT services. It holds strategic footprints across the Americas, Europe, and Asia, enhancing global reach. Leidos’ competitive advantage lies in its ability to integrate complex systems and data analytics, creating a formidable economic moat that shapes the future of defense and technology industries.
Financial Performance & Fundamental Metrics
I will analyze Leidos Holdings, Inc.’s income statement, key financial ratios, and dividend payout policy to assess its core financial health and shareholder returns.
Income Statement
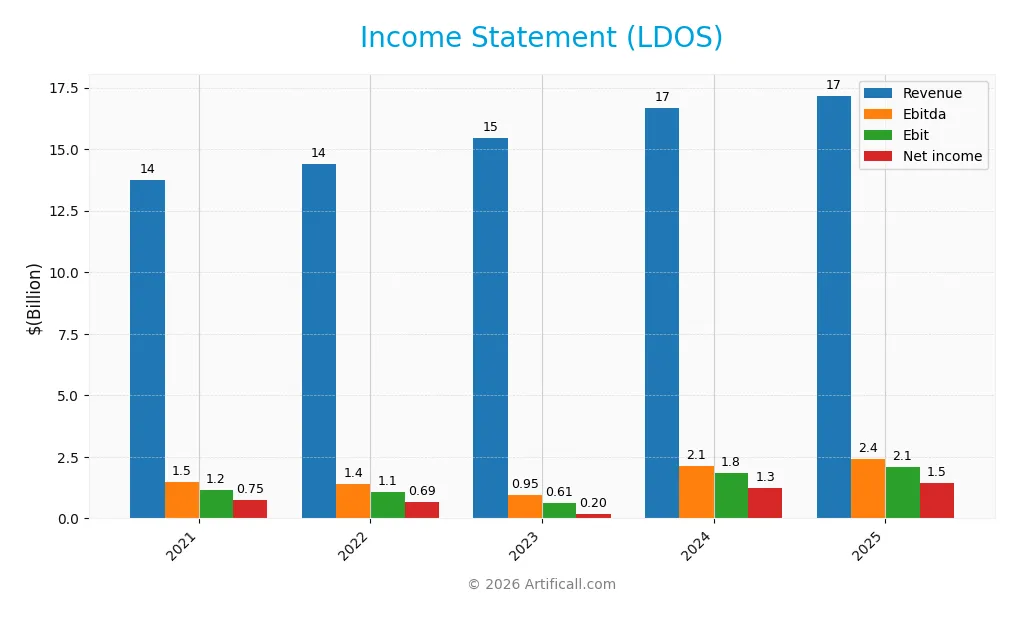
The table below presents Leidos Holdings, Inc.’s key income statement figures for fiscal years 2021 through 2025, reported in USD.
| 2021 | 2022 | 2023 | 2024 | 2025 | |
|---|---|---|---|---|---|
| Revenue | 13.7B | 14.4B | 15.4B | 16.7B | 17.2B |
| Cost of Revenue | 11.7B | 12.3B | 13.2B | 13.9B | 14.1B |
| Operating Expenses | 862M | 996M | 1.62B | 971M | 926M |
| Gross Profit | 2.01B | 2.08B | 2.24B | 2.80B | 3.03B |
| EBITDA | 1.48B | 1.42B | 946M | 2.12B | 2.41B |
| EBIT | 1.15B | 1.09B | 615M | 1.83B | 2.11B |
| Interest Expense | 184M | 199M | 212M | 193M | 203M |
| Net Income | 753M | 685M | 199M | 1.25B | 1.46B |
| EPS | 5.34 | 5.00 | 1.45 | 9.36 | 11.22 |
| Filing Date | 2022-02-15 | 2023-02-14 | 2024-02-13 | 2025-02-11 | 2026-02-17 |
Income Statement Evolution
Leidos Holdings, Inc. recorded steady revenue growth from 13.7B in 2021 to 17.2B in 2025, a 25% increase. Net income nearly doubled, reaching 1.46B in 2025. Gross margin held steady around 17.7%, while EBIT and net margins improved notably, signaling enhanced operational efficiency over the period.
Is the Income Statement Favorable?
In 2025, Leidos showed strong fundamentals with a 12.3% EBIT margin and an 8.5% net margin, both favorable compared to industry averages. Revenue grew 3.1% year-over-year, supported by an 8.4% rise in gross profit. Interest expense remained low at 1.2% of revenue, reinforcing solid capital management. Overall, margins and growth metrics confirm a favorable income statement.
Financial Ratios
The table below summarizes key financial ratios for Leidos Holdings, Inc. from 2021 through 2025, providing a snapshot of profitability, liquidity, leverage, and efficiency:
| Ratios | 2021 | 2022 | 2023 | 2024 | 2025 |
|---|---|---|---|---|---|
| Net Margin | 5.48% | 4.76% | 1.29% | 7.53% | 8.48% |
| ROE | 17.55% | 15.93% | 4.74% | 28.42% | 29.62% |
| ROIC | 8.60% | 8.41% | 3.30% | 13.85% | 15.18% |
| P/E | 16.65 | 21.04 | 74.52 | 15.72 | 16.69 |
| P/B | 2.92 | 3.35 | 3.53 | 4.47 | 4.94 |
| Current Ratio | 1.12 | 0.92 | 1.34 | 1.21 | 1.70 |
| Quick Ratio | 1.04 | 0.85 | 1.24 | 1.13 | 1.58 |
| D/E | 1.32 | 1.28 | 1.24 | 1.20 | 0.12 |
| Debt-to-Assets | 43% | 42% | 41% | 40% | 4% |
| Interest Coverage | 6.26 | 5.47 | 2.93 | 9.47 | 10.38 |
| Asset Turnover | 1.04 | 1.10 | 1.22 | 1.27 | 1.27 |
| Fixed Asset Turnover | 10.72 | 10.34 | 10.48 | 10.74 | 11.55 |
| Dividend Yield | 1.59% | 1.38% | 1.36% | 1.05% | 0.87% |
Evolution of Financial Ratios
Leidos Holdings, Inc. saw its Return on Equity (ROE) improve markedly, reaching 29.6% in 2025 from 17.5% in 2021. The current ratio climbed steadily from 1.12 in 2021 to 1.7 in 2025, signaling stronger liquidity. Debt-to-equity ratio dramatically decreased from 1.32 in 2021 to 0.12 in 2025, highlighting significant deleveraging and improved financial stability.
Are the Financial Ratios Fovorable?
In 2025, Leidos exhibits favorable profitability with ROE at 29.6% and ROIC at 15.2%, both exceeding its 7% WACC. Liquidity ratios are strong, with current and quick ratios above 1.5. Leverage metrics, including a low debt-to-equity of 0.12 and debt-to-assets of 4.35%, are favorable. However, valuation indicators like the price-to-book ratio (4.94) and dividend yield (0.87%) are less favorable, resulting in a generally positive but nuanced financial profile.
Shareholder Return Policy
Leidos Holdings, Inc. maintains a consistent dividend payout ratio near 15%, with dividends per share rising from $1.41 in 2021 to $1.59 in 2025. The dividend yield hovers around 0.87% in 2025, supported by free cash flow coverage and moderate payout levels.
The company also engages in share buybacks alongside dividends, reflecting balanced capital allocation. This disciplined approach, combining steady dividends and buybacks, supports sustainable long-term shareholder value without risking excessive distributions.
Score analysis
The following radar chart presents a comprehensive view of Leidos Holdings, Inc.’s key financial scores:
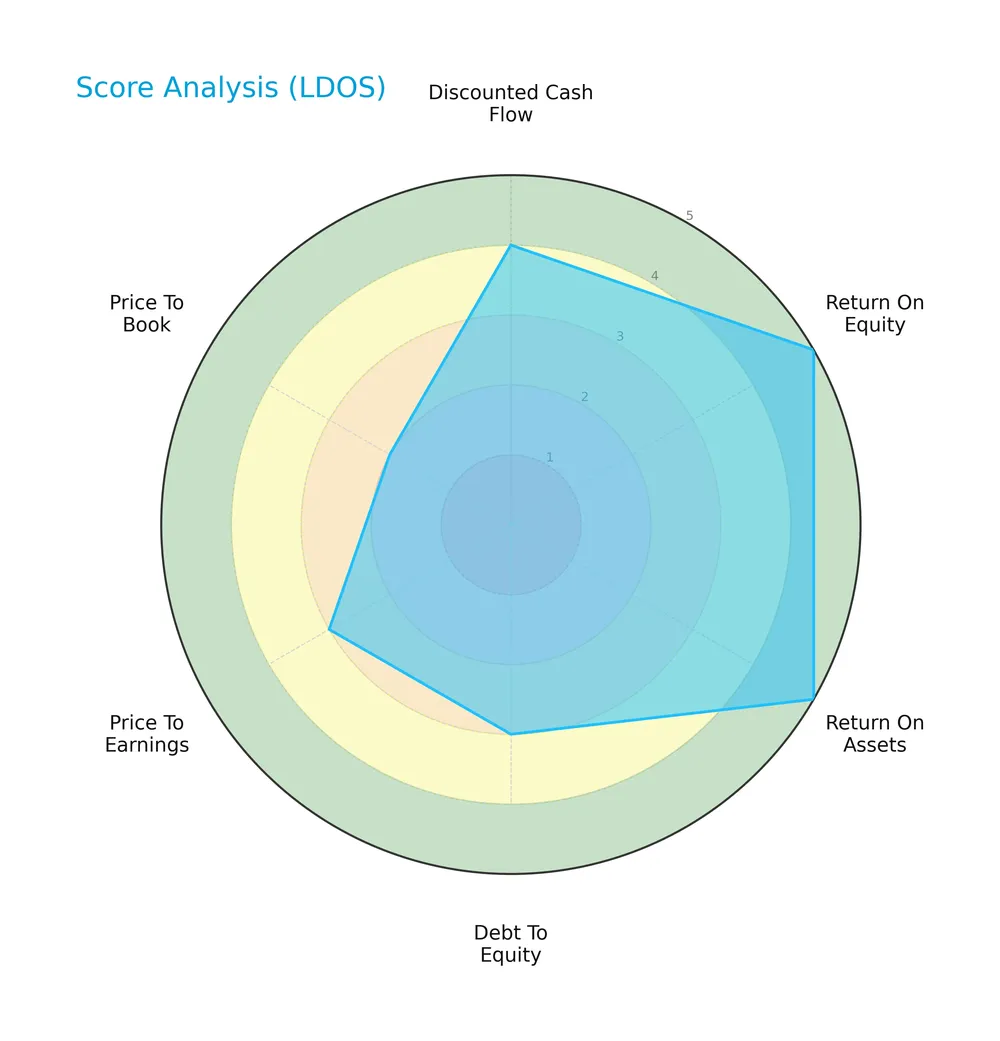
Leidos shows very favorable profitability with top scores in ROE and ROA at 5 each. Its discounted cash flow is favorable at 4, while debt-to-equity and P/E scores are moderate at 3. The price-to-book score is less favorable at 2.
Analysis of the company’s bankruptcy risk
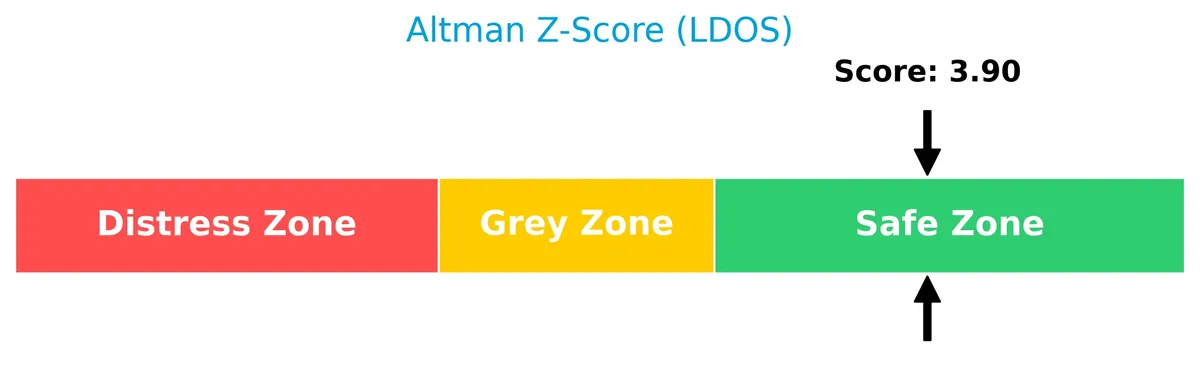
Leidos’ Altman Z-Score places it firmly in the safe zone, indicating a low risk of bankruptcy:
Is the company in good financial health?
The Piotroski Score diagram illustrates Leidos’ strong financial health and operational efficiency:
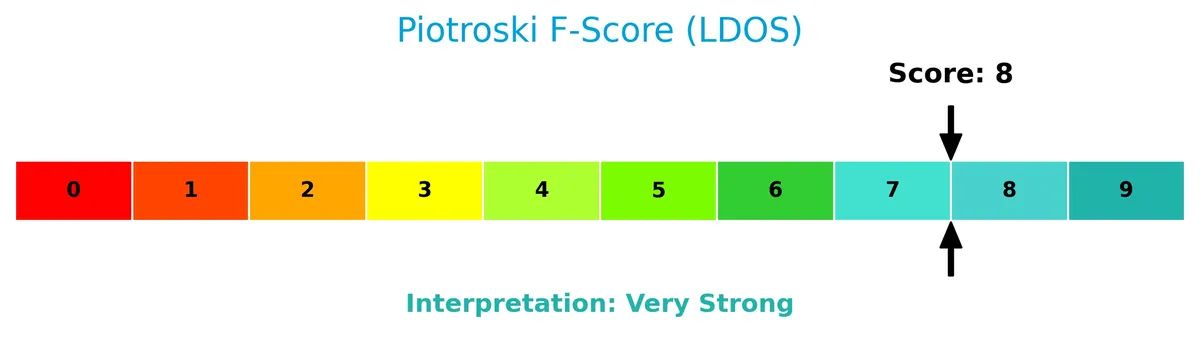
With a very strong Piotroski Score of 8, Leidos demonstrates robust financial strength, signaling effective management and solid fundamentals.
Competitive Landscape & Sector Positioning
This sector analysis reviews Leidos Holdings, Inc.’s strategic positioning, revenue segments, key products, and main competitors. I will assess whether Leidos holds a competitive advantage in its industry.
Strategic Positioning
Leidos Holdings diversifies across Defense, Civil, and Health segments, with Defense Solutions generating over $9.8B in 2025. Its revenue is heavily concentrated in the U.S., accounting for more than 90% of total sales, while international exposure remains limited around $1.4B.
Revenue by Segment
The pie chart presents Leidos Holdings, Inc.’s revenue distribution by segment for the fiscal year 2025, illustrating the relative contribution of each business area.
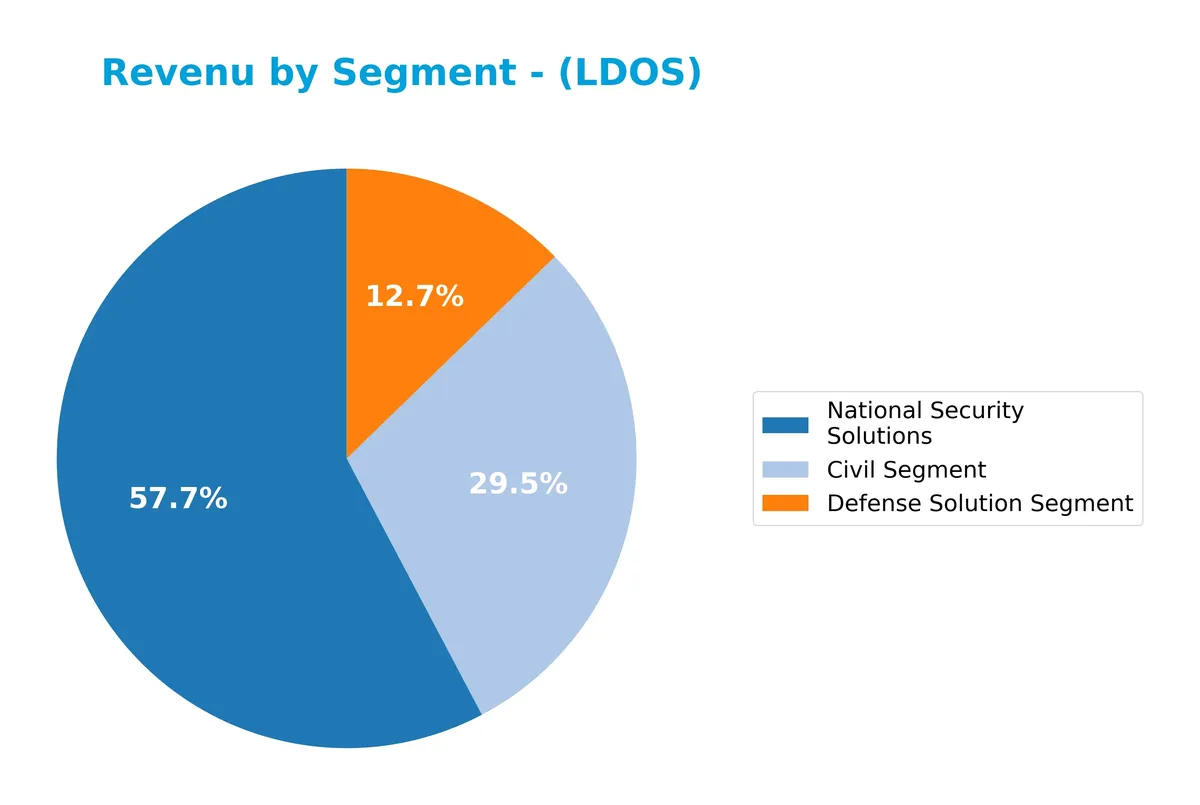
National Security Solutions leads with $9.9B, followed by Civil Segment at $5.1B, and Defense Solution Segment at $2.2B. This marks a shift from prior years, where Defense was more dominant. The 2025 data shows increasing concentration in National Security, reflecting strategic focus and potential concentration risk in this core segment. Civil segment growth remains steady, underscoring diversification.
Key Products & Brands
Leidos Holdings operates through these main products and segments generating significant revenue:
| Product | Description |
|---|---|
| National Security Solutions | Provides technology, systems, command and control platforms, data analytics, logistics, and cybersecurity for U.S. defense and intelligence agencies. |
| Defense Solution Segment | Offers integrated solutions supporting air, land, sea, space, and cyberspace national security missions. |
| Civil Segment | Delivers systems integration for air navigation, IT solutions including cloud, mobility, and infrastructure services. |
| Health Segment | Provides health information management, managed health, digital transformation, and life sciences R&D services. |
Leidos’ revenue reflects a diversified portfolio spanning national security, civil IT services, and health. Each segment serves distinct government and commercial clients, anchoring the company’s stable market position.
Main Competitors
The sector includes 16 competitors, with the table below listing the top 10 leaders by market capitalization:
| Competitor | Market Cap. |
|---|---|
| International Business Machines Corporation | 272B |
| Accenture plc | 162B |
| Cognizant Technology Solutions Corporation | 40B |
| Fiserv, Inc. | 36B |
| Fidelity National Information Services, Inc. | 34B |
| Wipro Limited | 30B |
| Leidos Holdings, Inc. | 23B |
| Gartner, Inc. | 18B |
| CDW Corporation | 17B |
| Jack Henry & Associates, Inc. | 13B |
Leidos Holdings ranks 7th among 16 competitors. Its market cap is 7.58% of IBM’s, the leader. Leidos sits below the average market cap of the top 10 (64.6B) but remains above the sector median (17.8B). Notably, it holds a 43.94% lead over its closest higher-ranked competitor.
Comparisons with competitors
Check out how we compare the company to its competitors:
Does LDOS have a competitive advantage?
Leidos Holdings, Inc. demonstrates a sustainable competitive advantage with an ROIC 8.1% above WACC and a strong upward ROIC trend from 2021-2025. Its consistent value creation and growing profitability mark it as a value-adding entity in the information technology services sector.
Looking ahead, Leidos leverages its three segments—Defense Solutions, Civil, and Health—to expand markets and innovate with new technology and digital transformation services. Its broad government and commercial customer base offers opportunities for growth in national security, cloud computing, and health solutions.
SWOT Analysis
This SWOT analysis highlights Leidos Holdings’ key internal and external factors shaping its competitive position and growth potential.
Strengths
- Strong ROIC well above WACC
- Diverse revenue streams across defense, civil, and health
- Solid financial health with low debt and high interest coverage
Weaknesses
- High price-to-book ratio signals potential overvaluation
- Modest dividend yield may deter income investors
- Heavy reliance on U.S. government contracts
Opportunities
- Expansion in international defense and civil markets
- Growing demand for cybersecurity and digital transformation
- Increasing health sector contracts and innovation
Threats
- Government budget cuts or policy shifts
- Intense competition in IT services sector
- Geopolitical risks impacting international sales
Leidos’ strengths and favorable financial metrics position it well for sustainable growth. However, its heavy reliance on government contracts and valuation concerns require cautious monitoring. The company should leverage innovation and international expansion to mitigate external risks.
Stock Price Action Analysis
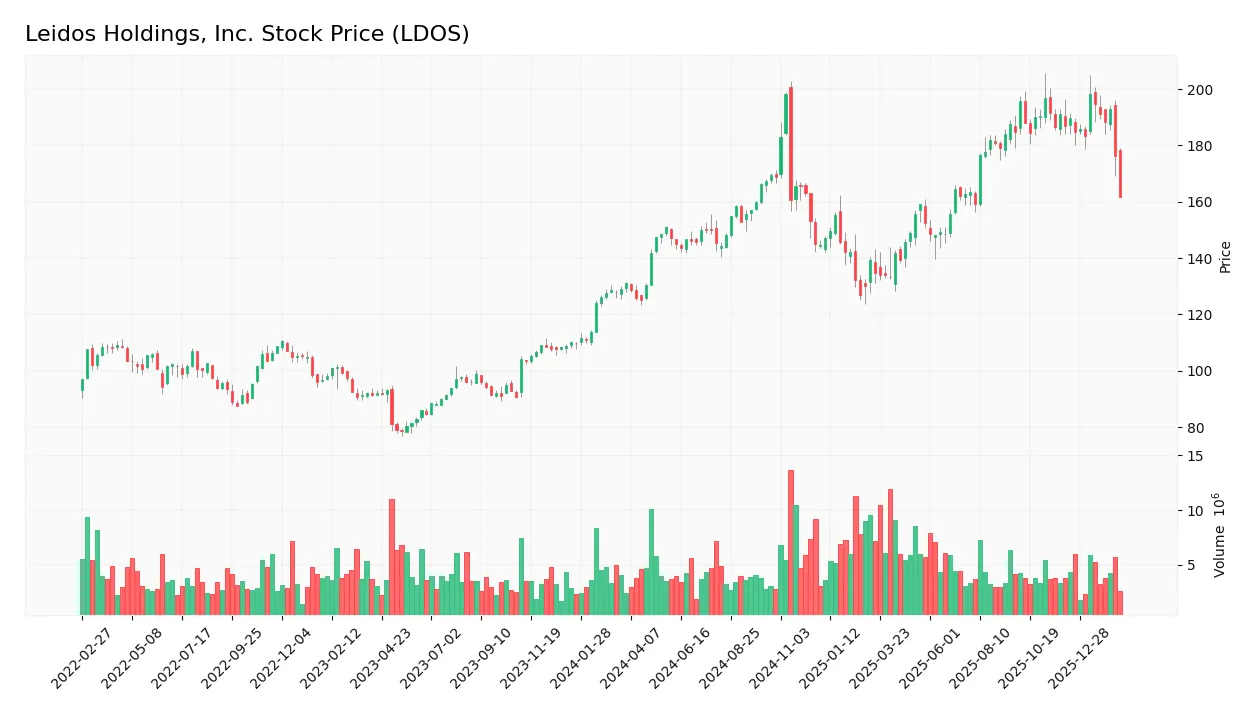
The weekly chart below illustrates Leidos Holdings, Inc.’s stock price movements and volatility over the last 12 months:
Trend Analysis
Over the past 12 months, LDOS gained 23.22%, confirming a bullish trend despite deceleration. The stock hit a high of 198.42 and a low of 124.91, with a high volatility level at 20.32% standard deviation. However, from December 2025 to February 2026, the price fell 13.54%, indicating a short-term bearish trend.
Volume Analysis
Trading volumes for LDOS have increased overall, with buyers accounting for 52.48% of the 589M total volume, showing buyer-driven activity. Yet, in the recent 3-month period, sellers dominated with 66.81%, signaling a shift to seller-driven dynamics and cautious investor sentiment.
Target Prices
Analysts present a confident target consensus for Leidos Holdings, Inc.
| Target Low | Target High | Consensus |
|---|---|---|
| 204 | 230 | 219.8 |
The target range reflects analyst optimism, with consensus pointing to a 7-10% upside from current levels. This suggests solid growth expectations.

Don’t Let Luck Decide Your Entry Point
Optimize your entry points with our advanced ProRealTime indicators. You’ll get efficient buy signals with precise price targets for maximum performance. Start outperforming now!
Analyst & Consumer Opinions
This section examines Leidos Holdings, Inc.’s analyst grades and consumer feedback to provide balanced insights.
Stock Grades
Here are the latest verified analyst grades for Leidos Holdings, Inc., reflecting recent rating changes and consensus:
| Grading Company | Action | New Grade | Date |
|---|---|---|---|
| UBS | Maintain | Neutral | 2026-01-15 |
| Citigroup | Maintain | Buy | 2026-01-13 |
| Stifel | Downgrade | Hold | 2026-01-08 |
| B of A Securities | Maintain | Buy | 2025-11-07 |
| Truist Securities | Maintain | Buy | 2025-11-05 |
| UBS | Maintain | Neutral | 2025-11-05 |
| Cantor Fitzgerald | Maintain | Overweight | 2025-10-31 |
| Argus Research | Maintain | Buy | 2025-09-24 |
| B of A Securities | Maintain | Buy | 2025-09-04 |
| RBC Capital | Upgrade | Outperform | 2025-09-04 |
The consensus leans toward a Buy rating, supported by multiple maintained Buy grades and a few upgrades. A recent downgrade to Hold by Stifel introduces some caution, indicating mixed near-term sentiment.
Consumer Opinions
Leidos Holdings, Inc. captures a mixed yet insightful spectrum of consumer sentiment, reflecting its complex market position.
| Positive Reviews | Negative Reviews |
|---|---|
| Reliable delivery on government contracts | Occasional delays in customer support |
| Strong technical expertise and innovation | Pricing perceived as high by some clients |
| Transparent communication during projects | Limited flexibility in contract terms |
Overall, consumers praise Leidos for technical strength and reliability. However, concerns about pricing and contract rigidity recur, suggesting room for improved client relations and agility.
Risk Analysis
Below is a summary table presenting key risks associated with Leidos Holdings, Inc.:
| Category | Description | Probability | Impact |
|---|---|---|---|
| Valuation Risk | Elevated price-to-book ratio (4.94) signals potential overvaluation compared to sector averages. | Medium | Medium |
| Market Volatility | Recent 8.38% stock decline reflects sensitivity to macroeconomic shifts and sector trends. | High | Medium |
| Competitive Risk | Intense competition in defense and IT services may pressure margins and market share. | Medium | High |
| Regulatory Risk | Exposure to government contracts in defense and health segments risks disruption from policy shifts. | Medium | High |
| Dividend Yield | Low dividend yield (0.87%) may deter income-focused investors, affecting demand stability. | Low | Low |
The most pressing risks are regulatory uncertainties and competitive pressures, both carrying high impact. Notably, Leidos operates in highly regulated defense and health sectors, where policy changes frequently alter contract flows. Despite a strong balance sheet and favorable financial metrics, valuation remains stretched relative to peers, warranting caution.
Should You Buy Leidos Holdings, Inc.?
Leidos Holdings, Inc. appears to be a robust value creator with a very favorable moat, evidenced by growing ROIC exceeding WACC. Despite a moderate leverage profile, its strong profitability and high financial strength rating suggest a solid investment profile with an overall A rating.
Strength & Efficiency Pillars
Leidos Holdings, Inc. demonstrates solid profitability with a net margin of 8.48% and a return on equity of 29.62%. Its return on invested capital (ROIC) stands at 15.18%, comfortably above the weighted average cost of capital (WACC) at 7.04%, signaling the company is a clear value creator. This sustained efficiency, combined with strong asset turnover ratios, reflects a robust operational model and a sustainable competitive advantage, confirmed by a growing ROIC trend and a very favorable moat status.
Weaknesses and Drawbacks
The company’s Altman Z-Score of 3.90 places it firmly in the safe zone, mitigating solvency concerns. However, challenges remain. The price-to-book ratio of 4.94 is unfavorable, indicating a potentially rich valuation relative to book value. Additionally, a low dividend yield of 0.87% may deter income-focused investors. Recent market activity shows seller dominance with only 33.19% buyer volume, creating short-term headwinds despite an overall bullish trend.
Our Final Verdict about Leidos Holdings, Inc.
Leidos Holdings, Inc. presents a fundamentally strong and value-creating profile with favorable profitability and capital efficiency. Despite the recent seller dominance suggesting some near-term uncertainty, the long-term outlook could appear attractive for investors seeking exposure to a company with a sustainable competitive advantage. Caution may be warranted until market pressure subsides for a better entry point.
Disclaimer: This content is for informational purposes only and does not constitute financial, investment, or other professional advice. Investing in financial markets involves a significant risk of loss, and past performance is not indicative of future results.
Additional Resources
- Decoding Leidos Holdings Inc (LDOS): A Strategic SWOT Insight – GuruFocus (Feb 18, 2026)
- Leidos Holdings Q4 Earnings Beat Estimates, Revenues Decline Y/Y – Yahoo Finance (Feb 17, 2026)
- Leidos Holdings, Inc. SEC 10-K Report – TradingView (Feb 17, 2026)
- Leidos (NYSE:LDOS) Stock Price Down 7.5% – Here’s What Happened – MarketBeat (Feb 18, 2026)
- Leidos Stock Slides As Government Shutdown, Weak Outlook Overshadow Record Profits – Benzinga (Feb 17, 2026)
For more information about Leidos Holdings, Inc., please visit the official website: leidos.com