Home > Analyses > Technology > Lattice Semiconductor Corporation
Lattice Semiconductor shapes the backbone of modern connectivity by powering devices with its innovative programmable chips. It leads the semiconductor sector with flagship products like Certus-NX and iCE40, driving advances in communications, computing, and automotive markets. Renowned for its cutting-edge technology and flexible IP licensing, Lattice influences global electronics design. As market dynamics shift, I question whether its current fundamentals justify the premium valuation and growth expectations investors assign.

Table of contents
Business Model & Company Overview
Lattice Semiconductor Corporation, founded in 1983 and headquartered in Hillsboro, Oregon, stands as a key player in the semiconductor industry. Its ecosystem centers on field programmable gate arrays spanning four product families, complemented by video connectivity application-specific products. This integrated approach addresses diverse sectors like communications, computing, consumer, industrial, and automotive markets, reinforcing its robust industry presence.
The company’s revenue engine balances direct sales and an extensive network of independent distributors across the Americas, Europe, and Asia. Beyond hardware, Lattice monetizes its technology through IP licensing and services, creating recurring value streams. This multi-faceted model underpins a strong economic moat, positioning Lattice to influence semiconductor innovation globally.
Financial Performance & Fundamental Metrics
I will analyze Lattice Semiconductor Corporation’s income statement, key financial ratios, and dividend payout policy to assess its core financial health and operational efficiency.
Income Statement
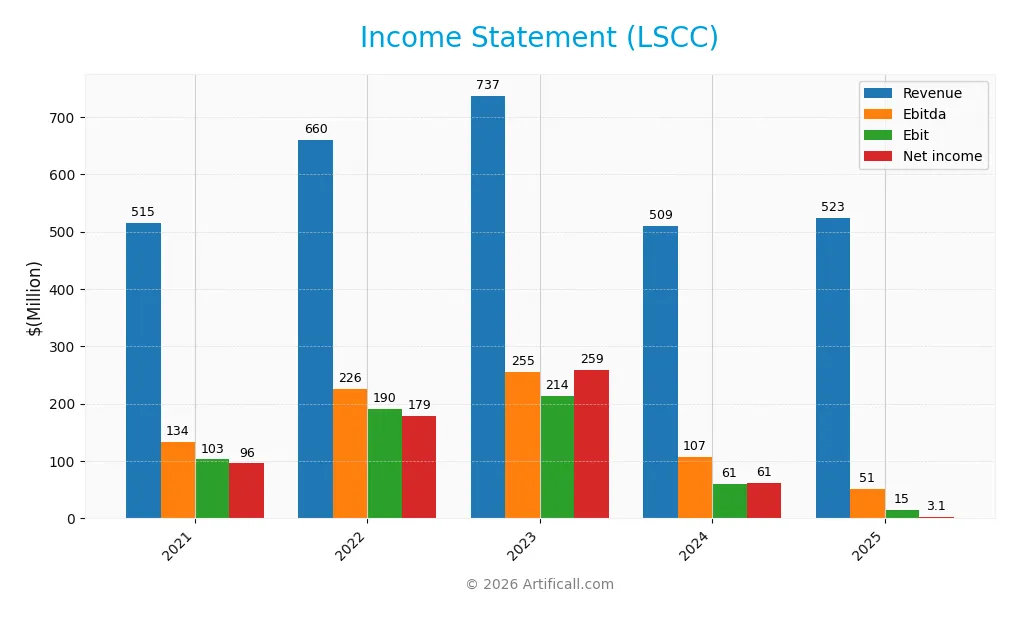
This table presents Lattice Semiconductor Corporation’s key income statement figures for fiscal years 2021 through 2025, reflecting revenue, profitability, and earnings per share trends.
| 2021 | 2022 | 2023 | 2024 | 2025 | |
|---|---|---|---|---|---|
| Revenue | 515M | 660M | 737M | 509M | 523M |
| Cost of Revenue | 194M | 208M | 222M | 169M | 166M |
| Operating Expenses | 221M | 265M | 302M | 306M | 342M |
| Gross Profit | 322M | 452M | 515M | 340M | 357M |
| EBITDA | 134M | 226M | 255M | 107M | 51M |
| EBIT | 103M | 190M | 214M | 61M | 15M |
| Interest Expense | 3M | 4M | 3M | 0.3M | 3M |
| Net Income | 96M | 179M | 259M | 61M | 3M |
| EPS | 0.70 | 1.30 | 1.88 | 0.44 | 0.02 |
| Filing Date | 2022-02-23 | 2023-02-17 | 2024-02-16 | 2025-02-14 | 2026-02-13 |
Income Statement Evolution
From 2021 to 2025, Lattice Semiconductor’s revenue grew marginally by 1.54%, indicating slow top-line expansion. Gross profit remained relatively stable, maintaining a favorable 68.21% margin. However, net income and net margins sharply declined, with net income dropping nearly 97%, reflecting deteriorating profitability and compressing bottom-line returns over the period.
Is the Income Statement Favorable?
In 2025, revenue edged up 2.7%, but operating income plunged 75%, and net income collapsed to $3M, signaling severe margin pressure. The gross margin of 68.2% remains a strength, yet the EBIT margin of 2.9% and net margin of 0.6% are neutral at best. Interest expense is low at 0.55%, but overall fundamentals appear unfavorable given steep earnings declines.
Financial Ratios
The following table presents key financial ratios for Lattice Semiconductor Corporation (LSCC) over the past five fiscal years, illustrating profitability, liquidity, leverage, and valuation trends:
| Ratios | 2021 | 2022 | 2023 | 2024 | 2025 |
|---|---|---|---|---|---|
| Net Margin | 18.6% | 27.1% | 35.1% | 12.0% | 0.6% |
| ROE | 23.3% | 36.7% | 37.4% | 8.6% | 0.4% |
| ROIC | 15.4% | 26.9% | 28.1% | 4.6% | 0.5% |
| P/E | 110 | 50 | 37 | 133 | 3496 |
| P/B | 25.6 | 18.3 | 13.7 | 11.4 | 15.1 |
| Current Ratio | 2.84 | 2.98 | 3.78 | 3.66 | 3.09 |
| Quick Ratio | 2.20 | 2.11 | 2.76 | 2.62 | 2.33 |
| D/E | 0.44 | 0.31 | 0.02 | 0.02 | 0.10 |
| Debt-to-Assets | 25.2% | 18.6% | 1.9% | 1.8% | 8.4% |
| Interest Coverage | 37 | 45 | 72 | 130 | 5.3 |
| Asset Turnover | 0.71 | 0.83 | 0.88 | 0.60 | 0.61 |
| Fixed Asset Turnover | 8.32 | 10.1 | 11.5 | 7.62 | 4.49 |
| Dividend Yield | 0% | 0% | 0% | 0% | 0% |
Evolution of Financial Ratios
Return on Equity (ROE) declined sharply from 37.4% in 2023 to 0.43% in 2025, signaling weakened profitability. The Current Ratio decreased from 3.78 to 3.09, indicating slightly reduced liquidity but remaining above 1. Debt-to-Equity Ratio improved significantly, dropping from 0.42 to 0.10, reflecting lower leverage and enhanced financial stability.
Are the Financial Ratios Favorable?
Profitability ratios such as net margin (0.59%) and ROE (0.43%) are unfavorable, signaling weak earnings relative to equity and sales. Liquidity shows mixed signals: quick ratio is favorable at 2.33, yet the current ratio at 3.09 is unfavorable. Leverage ratios, including debt-to-equity (0.10) and interest coverage (5.27), are favorable. Efficiency ratios are mostly neutral to favorable, but market multiples like P/E (3496) and P/B (15.1) are unfavorable. Overall, the financial ratios lean toward an unfavorable assessment.
Shareholder Return Policy
Lattice Semiconductor Corporation does not pay dividends, reflecting its focus on reinvestment and growth. The company has maintained a zero dividend payout ratio and yield over recent years, prioritizing capital for operations and expansion.
Despite the absence of dividends, Lattice engages in share buybacks, supporting shareholder value through capital return. This strategy aligns with sustainable long-term value creation by balancing growth investment and shareholder returns prudently.
Score analysis
Here is an overview of Lattice Semiconductor Corporation’s key financial scores for investor evaluation:
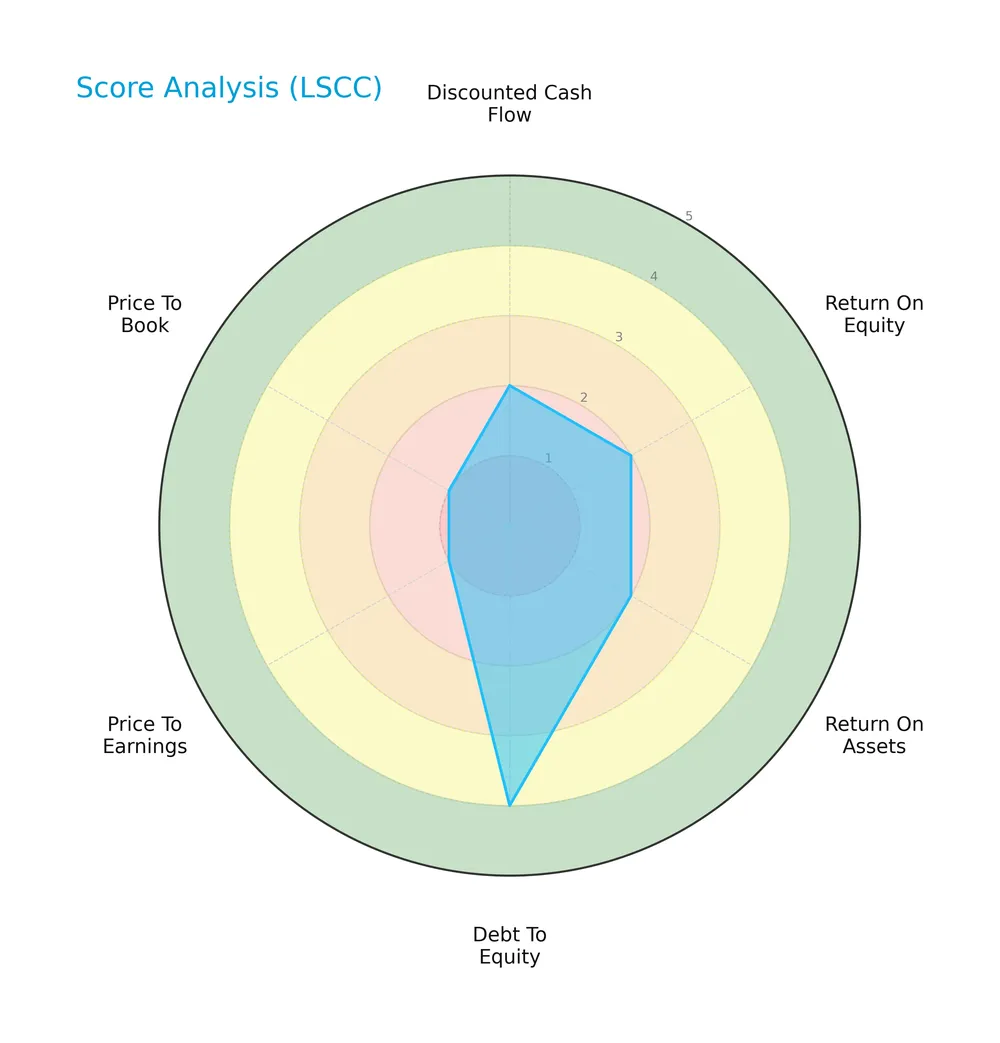
The company shows unfavorable scores in discounted cash flow, ROE, and ROA, each rated 2. Debt-to-equity is favorable at 4, but valuation metrics—PE and PB ratios—are very unfavorable, both scoring 1.
Analysis of the company’s bankruptcy risk
Lattice Semiconductor’s Altman Z-Score places it well within the safe zone, indicating minimal bankruptcy risk:

Is the company in good financial health?
The Piotroski Score diagram highlights the company’s financial strength and operational efficiency:
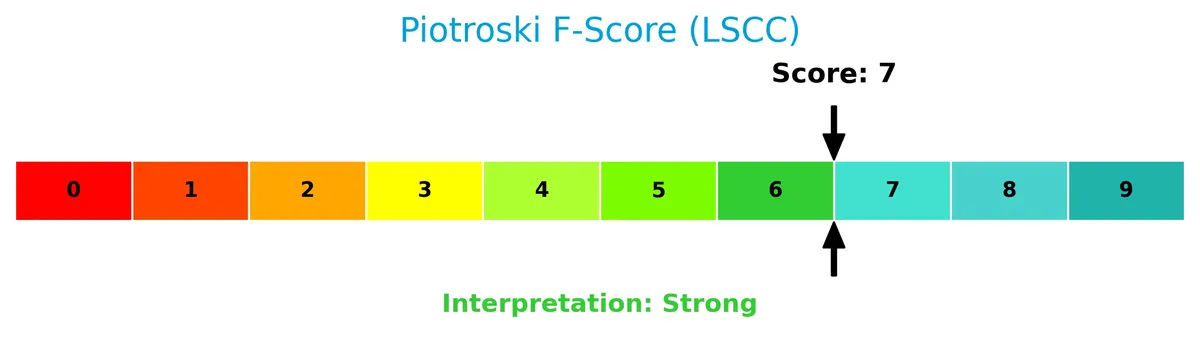
With a score of 7, Lattice Semiconductor demonstrates strong financial health, suggesting robust profitability and solid fundamentals.
Competitive Landscape & Sector Positioning
This analysis examines Lattice Semiconductor Corporation’s strategic positioning within the semiconductor sector. I will assess its revenue by segment, key products, and main competitors. I aim to determine whether Lattice holds a competitive advantage over its peers.
Strategic Positioning
Lattice Semiconductor Corporation concentrates on semiconductors, offering four FPGA product families and video connectivity solutions. Its geographic exposure spans Asia, the Americas, and Europe, with Asia, particularly China, representing the largest revenue segment, reflecting a focused yet globally diversified market presence.
Revenue by Segment
This pie chart illustrates Lattice Semiconductor Corporation’s revenue breakdown by segment for the fiscal year 2019, highlighting the distribution between licensing, direct product sales, and distributor product sales.

In 2019, product revenue through distributors dominated with 332M, reflecting the company’s reliance on channel partners. Direct product sales contributed 51M, while License and Service lagged at 21M. The data shows a concentrated revenue base in distribution channels, which poses some risk if market dynamics shift. Notably, licensing revenue declined in subsequent years, indicating a slowdown or strategic deprioritization after 2019.
Key Products & Brands
Lattice Semiconductor Corporation’s core offerings include programmable logic devices, video connectivity products, and technology licensing:
| Product | Description |
|---|---|
| Field Programmable Gate Arrays (FPGAs) | Four product families: Certus-NX and ECP, Mach, iCE40, and CrossLink, enabling customizable semiconductor solutions. |
| Video Connectivity Application Specific Standard Products | Specialized semiconductors designed for video interface and connectivity applications. |
| Technology Licensing | Licensing of intellectual property, including standard IP, IP core licensing, patent monetization, and IP services. |
Lattice’s product lineup focuses on flexible, low-power FPGA solutions and video connectivity, supported by a technology licensing business. This mix serves communications, computing, consumer, industrial, and automotive markets globally.
Main Competitors
Lattice Semiconductor Corporation competes with 38 companies in semiconductors; here are the top 10 leaders by market capitalization:
| Competitor | Market Cap. |
|---|---|
| NVIDIA Corporation | 4.6T |
| Broadcom Inc. | 1.6T |
| Taiwan Semiconductor Manufacturing Company Limited | 1.6T |
| ASML Holding N.V. | 415B |
| Advanced Micro Devices, Inc. | 363B |
| Micron Technology, Inc. | 353B |
| Lam Research Corporation | 232B |
| Applied Materials, Inc. | 214B |
| QUALCOMM Incorporated | 185B |
| Intel Corporation | 173B |
Lattice Semiconductor ranks 26th among 38 competitors. Its market cap is only 0.29% that of NVIDIA, the sector leader. The company is below both the average market cap of the top 10 ($975B) and the sector median ($31B). The gap to its nearest competitor above is narrow, at about 1.74%, indicating a tight cluster in mid-tier valuations.
Comparisons with competitors
Check out how we compare the company to its competitors:
Does LSCC have a competitive advantage?
Lattice Semiconductor Corporation does not currently present a competitive advantage. Its return on invested capital (ROIC) is significantly below its weighted average cost of capital (WACC), indicating value destruction and declining profitability.
Looking ahead, LSCC offers a diversified product portfolio including Certus-NX and ECP families, targeting communications, computing, consumer, industrial, and automotive markets globally. Expansion into new regions and licensing opportunities could influence future competitive positioning.
SWOT Analysis
This analysis highlights Lattice Semiconductor Corporation’s internal and external factors to guide strategic decisions.
Strengths
- strong gross margin at 68%
- low debt levels with DE at 0.1
- diversified global revenue base
Weaknesses
- declining ROIC well below WACC
- negative net margin under 1%
- stagnant revenue growth over five years
Opportunities
- expanding demand in communications and automotive sectors
- licensing revenue potential from IP portfolio
- growth in Asian markets, especially China
Threats
- intense competition in semiconductor industry
- high valuation multiples signal overpricing
- rapid technological change risks product obsolescence
Lattice Semiconductor faces serious profitability challenges despite solid operational fundamentals and global reach. The company must leverage IP licensing and sector growth to reverse value destruction. Risk management is crucial given industry pressures and stretched valuations.
Stock Price Action Analysis
The weekly stock chart for Lattice Semiconductor Corporation (LSCC) highlights notable price gains and volatility over the past 12 months:

Trend Analysis
Over the past 12 months, LSCC’s stock price increased 22.53%, indicating a bullish trend. The trend shows acceleration with high volatility (std dev 11.77). The stock peaked at 97.63 and bottomed at 39.03, reflecting significant price swings and growing investor interest.
Volume Analysis
Trading volume is decreasing overall despite buyer dominance at 52.17%. In the recent period, buyers account for 63.93%, signaling strong buyer-driven activity. This suggests sustained investor confidence, though waning volume may caution on participation strength.
Target Prices
Analysts expect Lattice Semiconductor Corporation’s shares to trade between $80 and $125, with a consensus target near $105.
| Target Low | Target High | Consensus |
|---|---|---|
| 80 | 125 | 104.7 |
This range reflects moderate optimism, suggesting upside potential from current levels while acknowledging some valuation risk.

Don’t Let Luck Decide Your Entry Point
Optimize your entry points with our advanced ProRealTime indicators. You’ll get efficient buy signals with precise price targets for maximum performance. Start outperforming now!
Analyst & Consumer Opinions
This section reviews the latest analyst grades and consumer feedback on Lattice Semiconductor Corporation (LSCC) performance and reputation.
Stock Grades
Below is a summary of recent stock grades issued by reputable financial firms for Lattice Semiconductor Corporation (LSCC):
| Grading Company | Action | New Grade | Date |
|---|---|---|---|
| Susquehanna | Maintain | Positive | 2026-02-11 |
| Jefferies | Maintain | Buy | 2026-02-11 |
| Keybanc | Maintain | Overweight | 2026-02-11 |
| Stifel | Maintain | Buy | 2026-02-11 |
| Needham | Maintain | Buy | 2026-02-11 |
| Benchmark | Maintain | Buy | 2026-02-11 |
| RBC Capital | Maintain | Outperform | 2026-02-11 |
| Rosenblatt | Maintain | Buy | 2026-02-11 |
| Susquehanna | Maintain | Positive | 2026-01-22 |
| Keybanc | Maintain | Overweight | 2026-01-13 |
The consensus strongly favors a buy stance with 15 buy ratings and only 2 hold/sell combined, reflecting broad analyst confidence. Grades consistently remain stable, indicating no recent shift in sentiment.
Consumer Opinions
Consumers express mixed feelings about Lattice Semiconductor Corporation, reflecting both satisfaction with innovation and concerns over product support.
| Positive Reviews | Negative Reviews |
|---|---|
| “Lattice’s low-power FPGA solutions are industry-leading and reliable.” | “Customer service response times are frustratingly slow.” |
| “The product documentation is detailed and helpful for engineers.” | “Pricing seems high compared to competitors.” |
| “Strong focus on edge computing applications sets them apart.” | “Software tools have a steep learning curve.” |
Overall, users praise Lattice’s innovative, power-efficient products but frequently cite customer support and pricing as pain points. This suggests a solid technology foundation with room to improve client relations.
Risk Analysis
Here is a summary table of Lattice Semiconductor Corporation’s key risk factors for investors to consider:
| Category | Description | Probability | Impact |
|---|---|---|---|
| Valuation Risk | Extremely high P/E of 3496x suggests market over-optimism. | High | High |
| Profitability Risk | Net margin at 0.59% and ROE at 0.43% show weak earnings. | High | Medium |
| Market Volatility | Beta of 1.67 indicates sensitivity to market swings. | Medium | Medium |
| Liquidity Risk | Current ratio 3.09 flagged unfavorable despite seeming strong. | Low | Medium |
| Leverage Risk | Low debt-to-equity 0.1 reduces financial risk. | Low | Low |
| Dividend Risk | No dividend yield removes income buffer for investors. | Medium | Low |
The most pressing threats are the sky-high valuation and weak profitability metrics. Despite a safe Altman Z-Score and strong Piotroski Score, the inflated P/E ratio signals a costly entry point. Profit margins remain razor-thin, heightening sensitivity to any industry cyclicality or supply chain disruptions in semiconductors. I advise caution and rigorous monitoring of earnings improvements before committing heavily.
Should You Buy Lattice Semiconductor Corporation?
Lattice Semiconductor appears to be navigating a challenging profitability landscape with declining operational efficiency and an eroding competitive moat. Despite a manageable leverage profile and strong financial health signals, its overall rating of C+ suggests a cautious analytical interpretation.
Strength & Efficiency Pillars
Lattice Semiconductor Corporation maintains a strong financial footing, reflected in its Altman Z-Score of 48.74, which places it comfortably in the safe zone. The company’s gross margin of 68.21% signals operational efficiency, while a favorable interest expense ratio of 0.55% underscores prudent capital costs. However, profitability metrics such as net margin (0.59%), ROE (0.43%), and ROIC (0.47%) remain weak and fall below the WACC of 11.47%, indicating the company is not creating value but rather shedding it. This highlights operational strengths but a lack of effective value creation.
Weaknesses and Drawbacks
Despite its safe solvency status, Lattice Semiconductor faces multiple financial headwinds. Its P/E ratio stands at an extreme 3,496.18, reflecting an unsustainable premium valuation that raises significant risk. The price-to-book ratio of 15.1 further confirms overvaluation relative to book equity. Although debt levels are low (D/E = 0.1), the current ratio at 3.09—while seemingly high—may indicate inefficient asset utilization. These valuation and efficiency issues could pressure the stock, despite buyer dominance in recent trading.
Our Final Verdict about Lattice Semiconductor Corporation
Lattice Semiconductor’s strong solvency and operational margins provide a foundation, but its poor profitability and severe overvaluation suggest a complicated long-term outlook. The bullish overall trend combined with recent buyer dominance may appear promising; however, the elevated valuation metrics and weak returns on invested capital advise caution. This profile might appeal to risk-tolerant investors but suggests a wait-and-see approach for those seeking stable, value-driven exposure.
Disclaimer: This content is for informational purposes only and does not constitute financial, investment, or other professional advice. Investing in financial markets involves a significant risk of loss, and past performance is not indicative of future results.
Additional Resources
- What Makes Lattice Semiconductor (LSCC) a Strong Momentum Stock: Buy Now? – Yahoo Finance (Feb 13, 2026)
- This Just In: Analysts Are Boosting Their Lattice Semiconductor Corporation (NASDAQ:LSCC) Outlook for This Year – simplywall.st (Feb 13, 2026)
- Insider Selling: Lattice Semiconductor (NASDAQ:LSCC) Director Sells 8,000 Shares of Stock – MarketBeat (Feb 14, 2026)
- Earnings Estimates Moving Higher for Lattice (LSCC): Time to Buy? – Finviz (Feb 13, 2026)
- Needham Maintains Buy on Lattice Semiconductor Corporation (LSCC) Feb 11, 2026 – Meyka (Feb 12, 2026)
For more information about Lattice Semiconductor Corporation, please visit the official website: latticesemi.com