Home > Analyses > Consumer Cyclical > Las Vegas Sands Corp.
Las Vegas Sands Corp. transforms entertainment and luxury travel across iconic destinations in Asia and the U.S. It commands the integrated resorts sector with flagship properties like The Venetian Macao and Marina Bay Sands. Renowned for blending gaming, hospitality, and high-end retail, it sets industry standards in innovation and guest experience. As market dynamics shift, I ask: do its core fundamentals still support its premium valuation and future growth prospects?

Table of contents
Business Model & Company Overview
Las Vegas Sands Corp., founded in 1988 and headquartered in Las Vegas, Nevada, stands as a dominant player in the Gambling, Resorts & Casinos industry. It operates a cohesive ecosystem of integrated resorts, combining luxury accommodations, gaming, entertainment, retail, and convention facilities. Its marquee properties include The Venetian Macao, Marina Bay Sands in Singapore, and The Venetian Resort on the Las Vegas Strip, creating a seamless hospitality experience across key global gaming hubs.
The company’s revenue engine balances high-margin gaming operations with recurring income from hotel stays, retail, and conventions across the Americas and Asia. This diversified model leverages strong brand recognition and premium locations, driving sustained cash flow. Its strategic footprint in Macao, Singapore, and Las Vegas cements a formidable economic moat, shaping the future of integrated resort development worldwide.
Financial Performance & Fundamental Metrics
I will analyze Las Vegas Sands Corp.’s income statement, key financial ratios, and dividend payout policy to assess its core profitability and shareholder value.
Income Statement
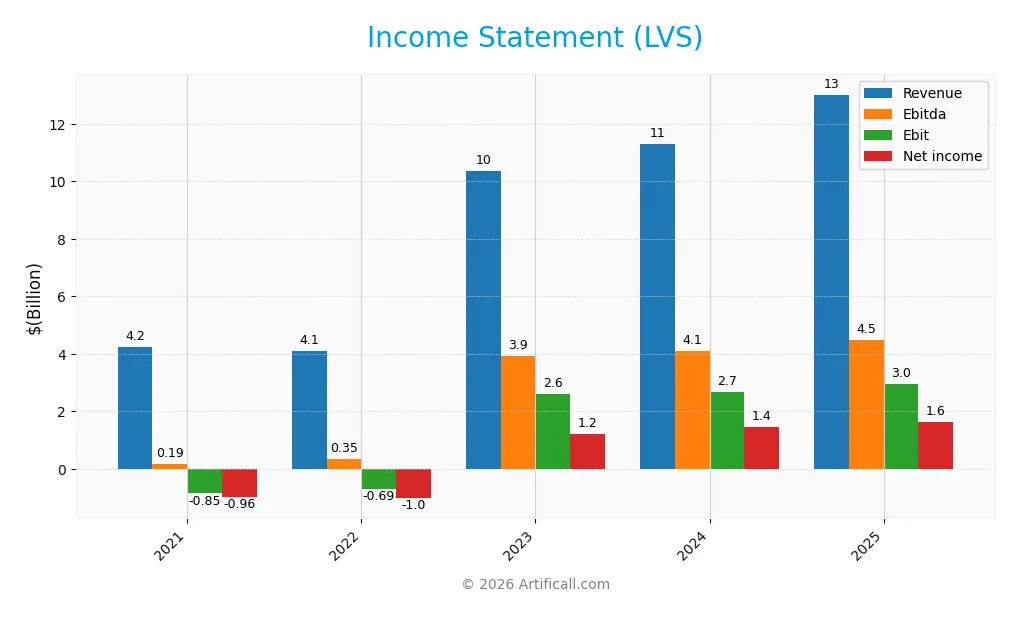
The table below summarizes Las Vegas Sands Corp.’s key income statement metrics for fiscal years 2021 to 2025, reported in USD.
| 2021 | 2022 | 2023 | 2024 | 2025 | |
|---|---|---|---|---|---|
| Revenue | 4.23B | 4.11B | 10.37B | 11.30B | 13.02B |
| Cost of Revenue | 3.67B | 3.50B | 6.47B | 7.15B | 9.35B |
| Operating Expenses | 1.21B | 1.38B | 1.55B | 1.69B | 0.58B |
| Gross Profit | 567M | 614M | 3.90B | 4.15B | 3.67B |
| EBITDA | 188M | 351M | 3.92B | 4.11B | 4.50B |
| EBIT | -853M | -685M | 2.59B | 2.69B | 2.96B |
| Interest Expense | 621M | 702M | 818M | 727M | 746M |
| Net Income | -961M | -1.02B | 1.22B | 1.45B | 1.63B |
| EPS | -1.26 | -1.40 | 1.60 | 1.97 | 2.35 |
| Filing Date | 2022-02-04 | 2023-02-03 | 2024-02-07 | 2025-02-07 | 2026-02-06 |
Income Statement Evolution
Las Vegas Sands Corp. reported strong revenue growth of 15.2% in 2025, continuing a 207% increase since 2021. Net income expanded by 19.9% year-over-year, supported by a favorable net margin of 12.5%. However, gross profit declined 11.7%, reflecting margin compression despite stable operating expenses relative to revenue. EBIT margin improved to 22.7%, signaling operational efficiency gains.
Is the Income Statement Favorable?
The 2025 income statement fundamentals are generally favorable. Revenue and operating income both increased significantly, with EBIT rising 10.1%. Interest expense remains manageable at 5.7% of revenue, maintaining neutral impact. Net margin dipped slightly, yet overall profitability strengthened. Earnings per share grew nearly 20%, confirming shareholder value creation amid rising costs and moderate margin pressures.
Financial Ratios
The following table presents key financial ratios for Las Vegas Sands Corp. from 2021 through 2025, highlighting profitability, liquidity, leverage, and valuation metrics:
| Ratios | 2021 | 2022 | 2023 | 2024 | 2025 |
|---|---|---|---|---|---|
| Net Margin | -22.7% | -24.8% | 11.8% | 12.8% | 12.5% |
| ROE | -48.1% | -26.3% | 29.7% | 50.1% | 102.3% |
| ROIC | -3.6% | -3.8% | 9.9% | 12.2% | 13.8% |
| P/E | -29.9 | -36.0 | 30.8 | 26.1 | 27.6 |
| P/B | 14.4 | 9.5 | 9.1 | 13.1 | 28.3 |
| Current Ratio | 2.15 | 1.73 | 1.31 | 0.74 | 1.14 |
| Quick Ratio | 2.14 | 1.72 | 1.30 | 0.73 | 1.13 |
| D/E | 7.41 | 4.12 | 3.41 | 4.77 | 10.1 |
| Debt-to-Assets | 73.8% | 72.5% | 64.4% | 66.5% | 73.6% |
| Interest Coverage | -1.04x | -1.10x | 2.88x | 3.39x | 4.14x |
| Asset Turnover | 0.21 | 0.19 | 0.48 | 0.55 | 0.59 |
| Fixed Asset Turnover | 0.30 | 0.30 | 0.76 | 0.81 | 1.12 |
| Dividend Yield | 0.0% | 0.0% | 0.8% | 1.6% | 1.9% |
Evolution of Financial Ratios
Return on Equity (ROE) showed a strong rebound from negative levels in 2021-2022 to an exceptional 102.33% in 2025. The Current Ratio stabilized around 1.14 in 2025 after fluctuating between 0.74 and 2.15. Debt-to-Equity Ratio increased sharply, reaching 10.15 in 2025, indicating rising leverage. Profitability improved steadily with net margins rising to 12.5%.
Are the Financial Ratios Fovorable?
Profitability ratios such as ROE and net margin appear favorable, reflecting strong earnings relative to equity and sales. Liquidity ratios present a mixed picture: the Current Ratio is neutral, while the Quick Ratio is favorable. Leverage ratios are unfavorable, with Debt-to-Equity and Debt-to-Assets notably high. Market valuation metrics like Price-to-Earnings and Price-to-Book are unfavorable, suggesting potential overvaluation. Overall, ratios are slightly favorable but warrant caution due to leverage.
Shareholder Return Policy
Las Vegas Sands Corp. pays a dividend with a payout ratio of 51%, yielding 1.85% annually. The dividend per share has steadily increased from $0.40 in 2023 to $1.21 in 2025. The company supports distributions with free cash flow but carries high leverage risks.
The firm also conducts share buybacks, complementing dividends. Despite strong coverage ratios, its heavy debt load warrants caution. This balanced policy appears aimed at sustainable long-term shareholder value, though debt levels remain a notable risk factor.
Score analysis
The following radar chart illustrates key financial metric scores for Las Vegas Sands Corp., providing a snapshot of its valuation and profitability:
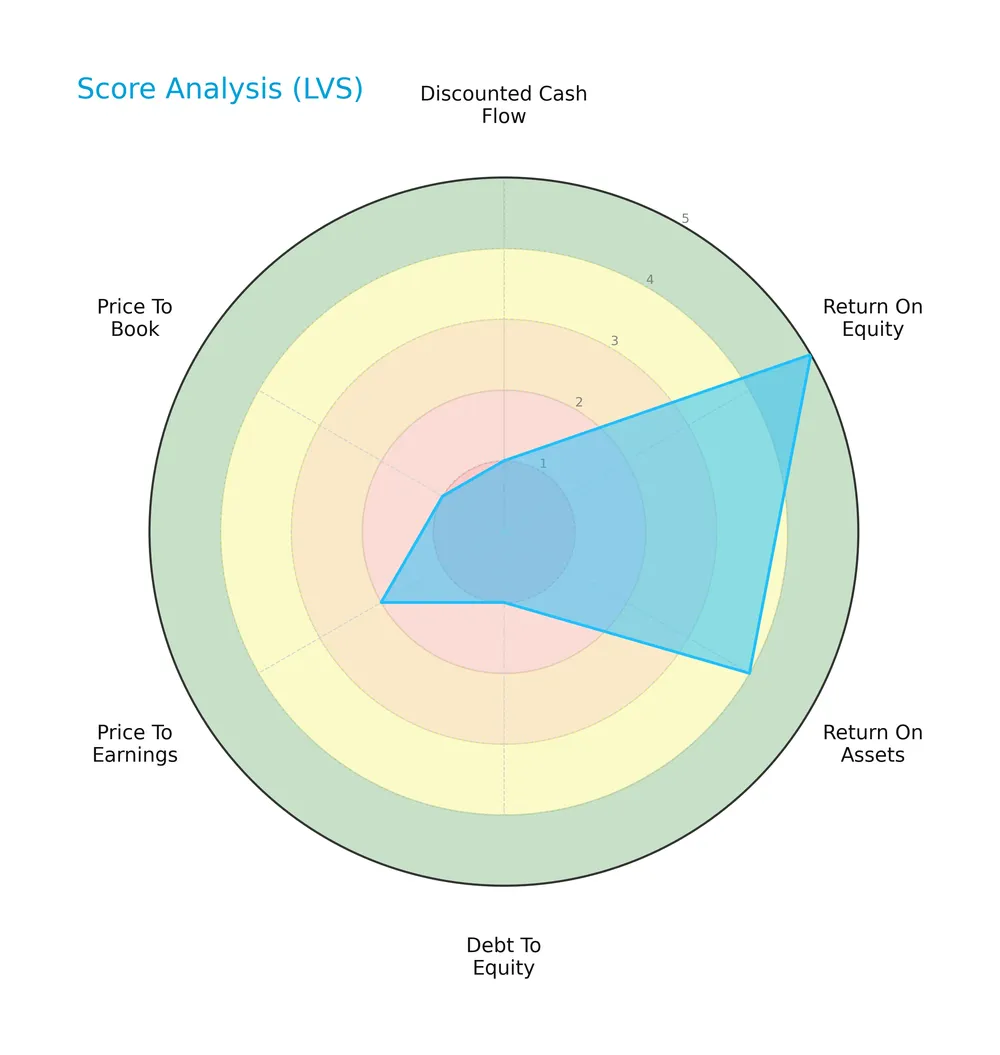
Las Vegas Sands shows a strong return on equity (5) and favorable return on assets (4). However, it scores very low on discounted cash flow (1), debt to equity (1), and price to book (1), indicating valuation and leverage concerns.
Analysis of the company’s bankruptcy risk
The Altman Z-Score places Las Vegas Sands in the grey zone, signaling a moderate risk of bankruptcy based on financial ratios and leverage:

Is the company in good financial health?
The Piotroski Score diagram highlights the company’s financial strength and operational efficiency:

With a Piotroski Score of 7, Las Vegas Sands demonstrates strong financial health, reflecting solid profitability and balance sheet management despite some valuation and debt risks.
Competitive Landscape & Sector Positioning
This section analyzes Las Vegas Sands Corp.’s position within the gambling, resorts, and casinos sector. It covers strategic positioning, revenue segments, key products, main competitors, and competitive advantages. I will assess whether Las Vegas Sands holds a distinct competitive edge over its industry peers.
Strategic Positioning
Las Vegas Sands Corp. concentrates its portfolio on integrated resorts with a strong emphasis on casino operations, generating $9.8B in 2025. Its geographic exposure focuses on Asia, particularly Marina Bay Sands in Singapore, which contributed $5.6B, indicating regional concentration with limited diversification.
Revenue by Segment
This pie chart illustrates Las Vegas Sands Corp.’s revenue distribution by segment for the full fiscal year 2025, highlighting the key business drivers and their relative contributions.
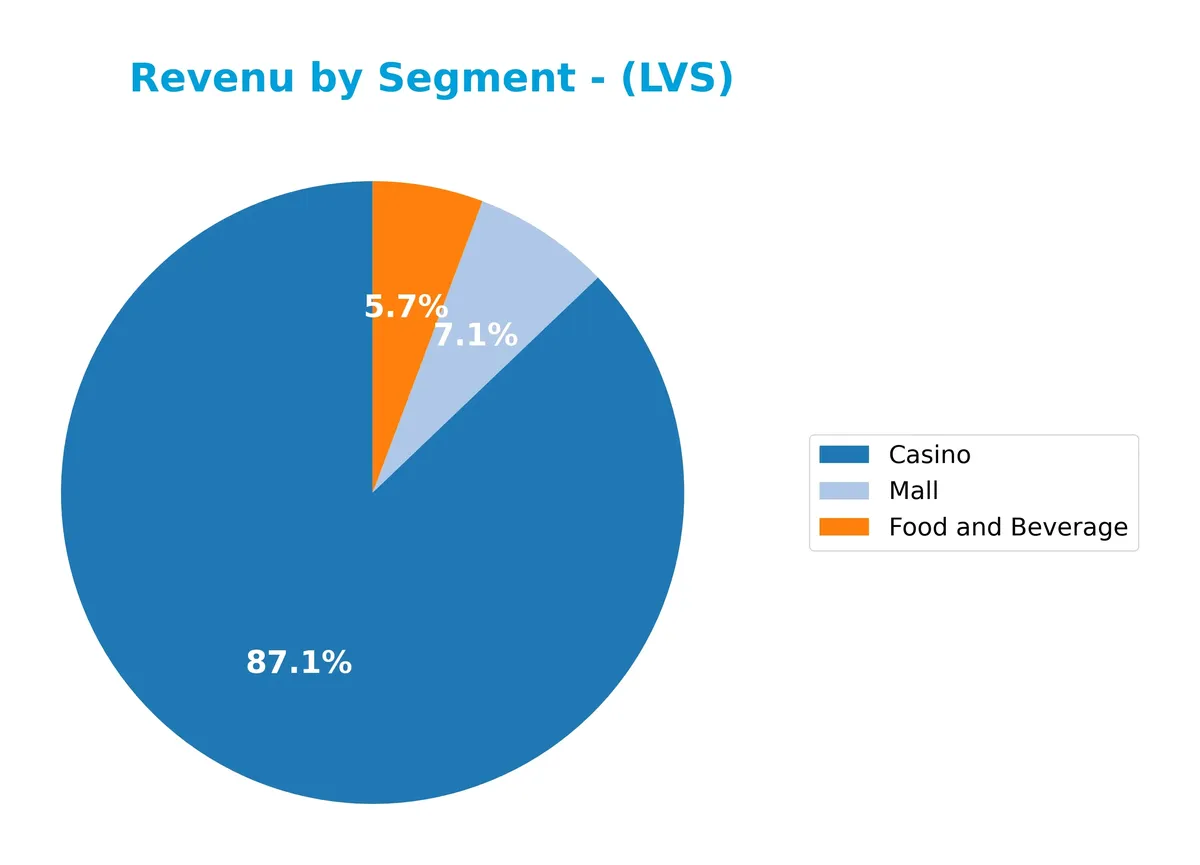
Casino revenue dominates at 9.8B, showing strong growth from 8.3B in 2024. Food and Beverage and Mall segments contribute 644M and 801M, respectively, with steady increases. The casino segment drives business momentum, reflecting recovery and expansion, while other segments maintain stable, smaller roles. The rising casino revenue signals concentration risk but also emphasizes core operational strength.
Key Products & Brands
Las Vegas Sands Corp.’s main revenue drivers and signature brands include the following:
| Product | Description |
|---|---|
| Casino | Integrated casino operations across multiple properties, generating the largest revenue share. |
| Food and Beverage | Dining services within resorts, including celebrity chef restaurants and casual options. |
| Mall | Retail mall operations situated within resort complexes. |
| The Venetian Macao | Luxury integrated resort and casino located in Macao, China. |
| Londoner Macao | Integrated resort property in Macao featuring gaming and hospitality services. |
| The Parisian Macao | Resort and casino themed on Parisian landmarks in Macao. |
| The Plaza Macao | Integrated resort providing casino, accommodation, and retail experiences in Macao. |
| Four Seasons Macao | Luxury hotel and resort component of the Macao portfolio. |
| Sands Macao | Casino and hotel property in Macao, one of the company’s earliest Asian resorts. |
| Marina Bay Sands | Premier integrated resort and casino in Singapore, a flagship international asset. |
| The Venetian Resort | Iconic Las Vegas Strip hotel and casino resort. |
| Sands Expo and Convention Center | Convention and exhibition facility located in Las Vegas, Nevada. |
Las Vegas Sands relies heavily on casino revenues, supported by diverse hospitality and retail offerings. The company’s portfolio spans major Asian and US markets, combining luxury resorts with extensive gaming and entertainment venues.
Main Competitors
The company operates in a competitive landscape with 3 main players; below is a list of the top 3 leaders by market capitalization:
| Competitor | Market Cap. |
|---|---|
| Las Vegas Sands Corp. | 44.1B |
| Wynn Resorts, Limited | 12.7B |
| MGM Resorts International | 10.0B |
Las Vegas Sands ranks 1st among its competitors, holding a market cap 0.885 times that of the sector leader. It is positioned above both the average market cap of the top 10 and the median market cap in its sector. The company maintains a significant gap from its closest rival, Wynn Resorts, highlighting its dominant scale in the Gambling, Resorts & Casinos industry.
Comparisons with competitors
Check out how we compare the company to its competitors:
Does LVS have a competitive advantage?
Las Vegas Sands Corp. demonstrates a clear competitive advantage, evidenced by a ROIC significantly exceeding its WACC by 7.23%, signaling efficient capital use and value creation. The company’s integrated resorts in Asia and the U.S. provide diversified revenue streams, supported by a very favorable moat status and a strong ROIC growth trend of nearly 479%.
Looking ahead, LVS’s portfolio includes iconic properties like Marina Bay Sands and The Venetian, positioning it well to capitalize on tourism and convention growth. Expansion opportunities and new market developments could further enhance its competitive positioning in the gambling and resorts sector.
SWOT Analysis
This analysis highlights Las Vegas Sands Corp.’s key strengths, weaknesses, opportunities, and threats to guide strategic decisions.
Strengths
- strong ROE at 102%
- robust revenue growth over 200% (5 years)
- sustainable competitive advantage with growing ROIC
Weaknesses
- high debt-to-equity ratio at 10.15
- elevated price-to-book ratio at 28.29
- net margin slightly declining recently
Opportunities
- expansion in Asia’s integrated resorts
- rising demand for luxury entertainment
- potential for margin improvement through operational efficiency
Threats
- regulatory risks in Macau and Asia
- economic cyclicality impacting discretionary spending
- intense competition from global casino operators
Las Vegas Sands exhibits a solid competitive moat and impressive profitability metrics, but its heavy leverage and valuation pose concerns. Strategic focus should balance growth investments with prudent debt management.
Stock Price Action Analysis
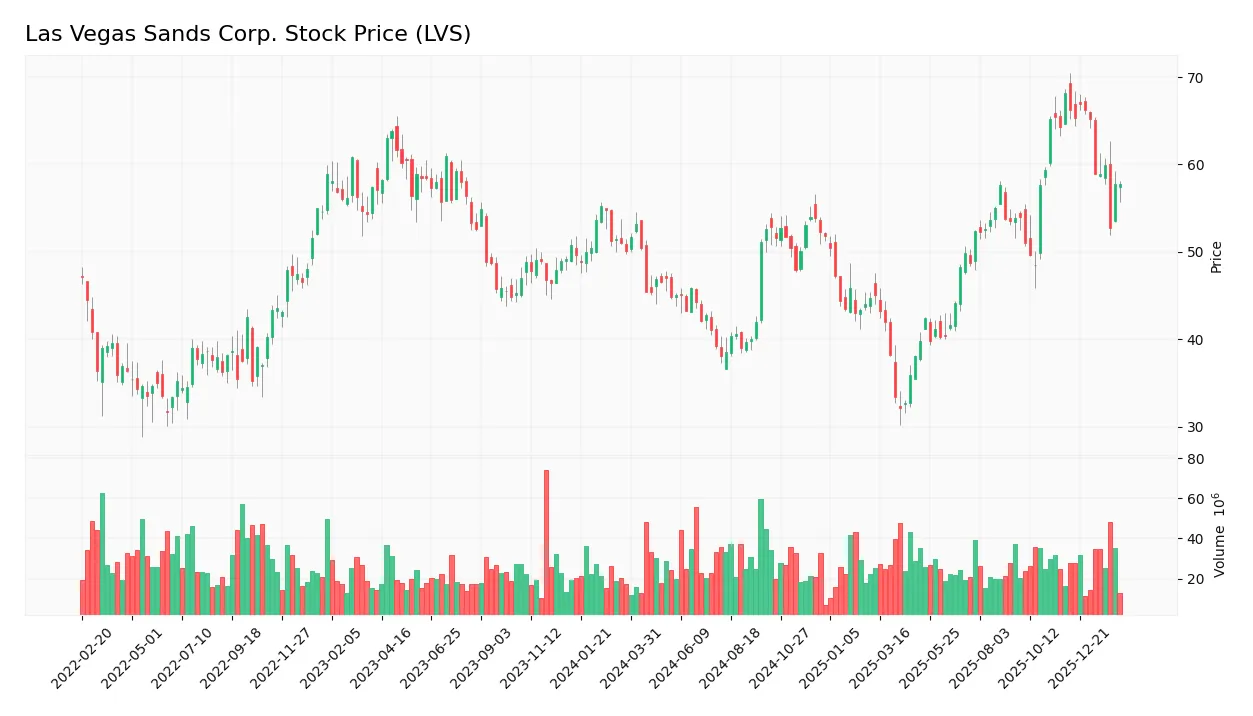
The weekly stock chart of Las Vegas Sands Corp. (LVS) illustrates price movements over the past 12 months with key highs and lows highlighted:
Trend Analysis
Over the past 12 months, LVS shares gained 15.19%, signaling a bullish trend despite decelerating momentum. The stock fluctuated between a low of 32.09 and a high of 68.16, showing significant volatility with an 8.22% standard deviation.
Volume Analysis
Trading volume over the last three months increased, but seller dominance prevailed with 62% of activity. This suggests cautious sentiment and weaker buyer conviction despite growing participation. Total volume reached 3230M shares, with buyers accounting for just 38%.
Target Prices
Analysts present a moderately bullish consensus for Las Vegas Sands Corp. (LVS).
| Target Low | Target High | Consensus |
|---|---|---|
| 63 | 80 | 70.5 |
The target range from 63 to 80 suggests cautious optimism, reflecting positive but measured growth expectations among analysts.

Don’t Let Luck Decide Your Entry Point
Optimize your entry points with our advanced ProRealTime indicators. You’ll get efficient buy signals with precise price targets for maximum performance. Start outperforming now!
Analyst & Consumer Opinions
This section examines analyst ratings and consumer feedback to provide a balanced view of Las Vegas Sands Corp.’s market perception.
Stock Grades
Below is the latest overview of Las Vegas Sands Corp. grades from leading financial firms, reflecting diverse analyst views:
| Grading Company | Action | New Grade | Date |
|---|---|---|---|
| Stifel | Maintain | Buy | 2026-01-29 |
| Macquarie | Maintain | Outperform | 2026-01-29 |
| Mizuho | Maintain | Outperform | 2026-01-29 |
| Wells Fargo | Maintain | Equal Weight | 2026-01-29 |
| Deutsche Bank | Maintain | Buy | 2026-01-29 |
| Morgan Stanley | Maintain | Equal Weight | 2026-01-16 |
| Barclays | Maintain | Overweight | 2026-01-16 |
| Goldman Sachs | Upgrade | Buy | 2025-12-15 |
| UBS | Maintain | Neutral | 2025-12-08 |
| Argus Research | Maintain | Buy | 2025-12-01 |
Most ratings maintain a positive stance, with multiple firms holding Buy or Outperform grades. The consensus favors a Buy rating, showing steady confidence despite a few neutral opinions.
Consumer Opinions
Las Vegas Sands Corp. draws mixed reactions from its clientele, reflecting both its luxury appeal and operational challenges.
| Positive Reviews | Negative Reviews |
|---|---|
| “Exceptional service and elegant resorts.” | “Long wait times at customer service.” |
| “Wide variety of entertainment options.” | “High prices for food and drinks.” |
| “Clean, spacious rooms with great views.” | “Occasional issues with booking accuracy.” |
Overall, consumers praise LVS for its premium hospitality and diverse amenities. However, recurring complaints about customer service delays and pricing suggest areas needing improvement.
Risk Analysis
Below is a summary table outlining key risks facing Las Vegas Sands Corp. in 2026:
| Category | Description | Probability | Impact |
|---|---|---|---|
| High Debt Load | Debt-to-assets ratio at 73.62%, increasing financial leverage. | High | High |
| Valuation Risk | Elevated P/B (28.29) and P/E (27.64) ratios suggest overvaluation. | Medium | Medium |
| Liquidity Concerns | Current ratio of 1.14 signals limited liquidity cushion. | Medium | Medium |
| Market Cyclicality | Gambling sector sensitive to economic downturns and travel trends. | Medium | High |
| Regulatory Changes | Potential tightening in Macau and Singapore gaming regulations. | Low | High |
The most pressing risks combine high leverage and market cyclicality. LVS’s debt level at 74% of assets stands out as a red flag, particularly given the sector’s sensitivity to economic cycles. Recent global travel disruptions have shown how vulnerable integrated resorts remain. Valuation multiples remain elevated, exposing investors to downside if growth slows. I advise careful monitoring of debt metrics and macroeconomic signals.
Should You Buy Las Vegas Sands Corp.?
Las Vegas Sands Corp. appears to be showing improving profitability and a durable competitive moat, supported by a growing ROIC well above WACC, which suggests strong value creation. Despite a substantial leverage profile and mixed liquidity signals, its overall B- rating reflects a very favorable investment profile with moderate risk.
Strength & Efficiency Pillars
Las Vegas Sands Corp. exhibits solid operational efficiency, boasting a net margin of 12.5% and a robust return on equity of 102.33%. The company’s return on invested capital (ROIC) stands at 13.82%, comfortably above its weighted average cost of capital (WACC) at 6.59%, marking it as a clear value creator. This favorable spread indicates strong capital allocation and sustainable competitive advantage. Historical trends show growing ROIC, reinforcing the firm’s ability to generate returns above cost consistently.
Weaknesses and Drawbacks
LVS is currently in the Altman Z-Score grey zone with a value of 2.52, signaling moderate financial distress risk that requires caution. Its valuation metrics raise concerns: a high P/E ratio of 27.64 and an elevated P/B ratio of 28.29 suggest the stock trades at a significant premium, exposing investors to valuation risk. Leverage is also a red flag, with a debt-to-equity ratio of 10.15 and a debt-to-assets ratio of 73.62%, indicating heavy reliance on debt financing. Recent seller dominance, with buyers at only 38.07%, adds short-term market pressure.
Our Final Verdict about Las Vegas Sands Corp.
Despite strong profitability and value creation metrics, the company’s presence in the Z-Score grey zone signals moderate solvency risk. Coupled with high leverage and stretched valuations, this profile appears too risky for conservative capital. The bullish long-term trend is tempered by recent seller dominance, suggesting a cautious, wait-and-see approach might be prudent before committing new capital to LVS.
Disclaimer: This content is for informational purposes only and does not constitute financial, investment, or other professional advice. Investing in financial markets involves a significant risk of loss, and past performance is not indicative of future results.
Additional Resources
- Principal Financial Group Inc. Has $19.37 Million Holdings in Las Vegas Sands Corp. $LVS – MarketBeat (Feb 09, 2026)
- Las Vegas Sands Reports Fourth Quarter 2025 Results – PR Newswire (Jan 28, 2026)
- Higher Earnings and Aggressive Buybacks Could Be A Game Changer For Las Vegas Sands (LVS) – Yahoo Finance (Feb 09, 2026)
- LAS VEGAS SANDS CORP SEC 10-K Report – TradingView (Feb 06, 2026)
- Las Vegas Sands (LVS) Q4 Revenue Growth Tests Bullish Community Narratives On Profit Margins – Sahm (Feb 08, 2026)
For more information about Las Vegas Sands Corp., please visit the official website: sands.com