Home > Analyses > Consumer Defensive > Lamb Weston Holdings, Inc.
Lamb Weston Holdings, Inc. transforms everyday meals with its innovative frozen potato products that reach millions globally. As a dominant player in the packaged foods industry, Lamb Weston is renowned for its high-quality offerings under flagship brands like Lamb Weston, Grown in Idaho, and Alexia. The company’s broad reach spans retail, foodservice, and commercial sectors, reflecting its strong market influence. As we analyze Lamb Weston’s current fundamentals, the key question is whether its growth potential still justifies its valuation in today’s competitive landscape.

Table of contents
Business Model & Company Overview
Lamb Weston Holdings, Inc., founded in 1950 and headquartered in Eagle, Idaho, stands as a leader in the packaged foods industry. Its core mission revolves around producing and marketing value-added frozen potato products, creating a cohesive ecosystem that spans retail, foodservice, and commercial ingredient markets worldwide. The company operates through four segments—Global, Foodservice, Retail, and Other—offering products under both its own brands like Grown in Idaho and Alexia, and various customer and licensed labels.
The company’s revenue engine balances product innovation with broad market penetration across the Americas, Europe, and Asia. Lamb Weston generates value by leveraging a diverse portfolio of frozen potatoes, appetizers, and complementary vegetable and dairy offerings, serving grocery chains, restaurants, and institutional clients. This strategic global footprint and strong brand portfolio underpin its economic moat, securing its role in shaping the future of frozen food consumption.
Financial Performance & Fundamental Metrics
I will analyze Lamb Weston Holdings, Inc.’s income statement, key financial ratios, and dividend payout policy to evaluate its fundamental strength and investment potential.
Income Statement
The table below presents Lamb Weston Holdings, Inc.’s key income statement figures for fiscal years 2021 through 2025, reflecting revenue, profitability, and earnings per share trends.

| 2021 | 2022 | 2023 | 2024 | 2025 | |
|---|---|---|---|---|---|
| Revenue | 3.67B | 4.10B | 5.35B | 6.47B | 6.45B |
| Cost of Revenue | 2.84B | 3.27B | 3.92B | 4.70B | 5.05B |
| Operating Expenses | 357.2M | 387.6M | 550.0M | 701.4M | 733.5M |
| Gross Profit | 832.0M | 832.0M | 1.43B | 1.77B | 1.40B |
| EBITDA | 663.0M | 637.0M | 1.10B | 1.37B | 1.07B |
| EBIT | 475.0M | 444.4M | 882.1M | 1.07B | 665.1M |
| Interest Expense | 118.3M | 161.0M | 109.2M | 135.8M | 180.0M |
| Net Income | 318.0M | 201.0M | 1.01B | 726.0M | 357.2M |
| EPS | 2.17 | 1.38 | 6.98 | 5.01 | 2.51 |
| Filing Date | 2021-07-27 | 2022-07-27 | 2023-07-25 | 2024-07-24 | 2025-07-23 |
Income Statement Evolution
From 2021 to 2025, Lamb Weston Holdings, Inc. saw overall revenue grow by 75.7%, reaching $6.45B in 2025, though it slightly declined by 0.25% from 2024 to 2025. Net income increased by 12.4% over the period but dropped nearly 50.6% in the last year. Gross margin and EBIT margin remained favorable at 21.7% and 10.3%, respectively, despite a 36% contraction in net margin over the five years.
Is the Income Statement Favorable?
In 2025, fundamentals show a mixed picture: revenue and earnings suffered a year-over-year decline, with net income falling to $357M and EPS down almost 50%. Interest expense remains a manageable 2.8% of revenue, supporting a favorable cost structure. The global evaluation balances positive margins against recent profit weakness, resulting in a neutral overall income statement assessment.
Financial Ratios
The following table presents a selection of key financial ratios for Lamb Weston Holdings, Inc. across fiscal years 2021 to 2025:
| Ratios | 2021 | 2022 | 2023 | 2024 | 2025 |
|---|---|---|---|---|---|
| Net Margin | 8.7% | 4.9% | 18.9% | 11.2% | 5.5% |
| ROE | 66.1% | 55.7% | 71.5% | 40.6% | 20.6% |
| ROIC | 10.1% | 9.4% | 13.4% | 13.1% | 7.4% |
| P/E | 38.0 | 49.2 | 15.7 | 17.8 | 20.1 |
| P/B | 25.1 | 27.4 | 11.2 | 7.2 | 4.1 |
| Current Ratio | 2.88 | 2.37 | 1.56 | 1.29 | 1.38 |
| Quick Ratio | 2.05 | 1.55 | 0.88 | 0.59 | 0.68 |
| D/E | 6.01 | 7.92 | 2.56 | 2.22 | 2.39 |
| Debt-to-Assets | 68.6% | 69.0% | 55.5% | 53.9% | 56.2% |
| Interest Coverage | 4.0 | 2.8 | 8.1 | 7.8 | 3.7 |
| Asset Turnover | 0.87 | 0.99 | 0.82 | 0.88 | 0.87 |
| Fixed Asset Turnover | 2.20 | 2.41 | 1.81 | 1.72 | 1.68 |
| Dividend Yield | 1.12% | 1.40% | 0.92% | 1.35% | 2.88% |
Evolution of Financial Ratios
From 2021 to 2025, Lamb Weston Holdings, Inc. experienced fluctuations in key financial ratios. Return on Equity (ROE) peaked in 2023 before declining to 20.56% in 2025, indicating some loss in profitability momentum. The Current Ratio steadily decreased from 2.88 in 2021 to 1.38 in 2025, reflecting reduced short-term liquidity. The Debt-to-Equity Ratio remained high and increased slightly to 2.39 in 2025, suggesting sustained leverage.
Are the Financial Ratios Favorable?
In 2025, profitability as measured by ROE was favorable at 20.56%, while net margin and return on invested capital were neutral. Liquidity ratios showed a mixed picture, with the Current Ratio neutral but the Quick Ratio unfavorable at 0.68. Leverage ratios, including Debt-to-Equity at 2.39 and Debt-to-Assets at 56.21%, were unfavorable, indicating higher financial risk. Market valuation metrics like Price-to-Book were also unfavorable, while dividend yield was favorable at 2.88%. Overall, the financial ratios present a slightly unfavorable profile.
Shareholder Return Policy
Lamb Weston Holdings, Inc. maintains a consistent dividend payment, with a payout ratio around 58% in 2025 and a dividend yield near 2.9%. Dividend per share has steadily increased from $0.92 in 2021 to $1.45 in 2025. The company covers dividends and capex with operating cash flow, supporting sustainable distributions.
Additionally, Lamb Weston engages in share buybacks, complementing its dividend policy. While the payout ratio is moderate, the company’s ability to fund dividends and investments through cash flow suggests a balanced approach. This policy appears to support long-term shareholder value without excessive financial strain.
Score analysis
The following radar chart presents an overview of Lamb Weston Holdings, Inc.’s key financial scores:
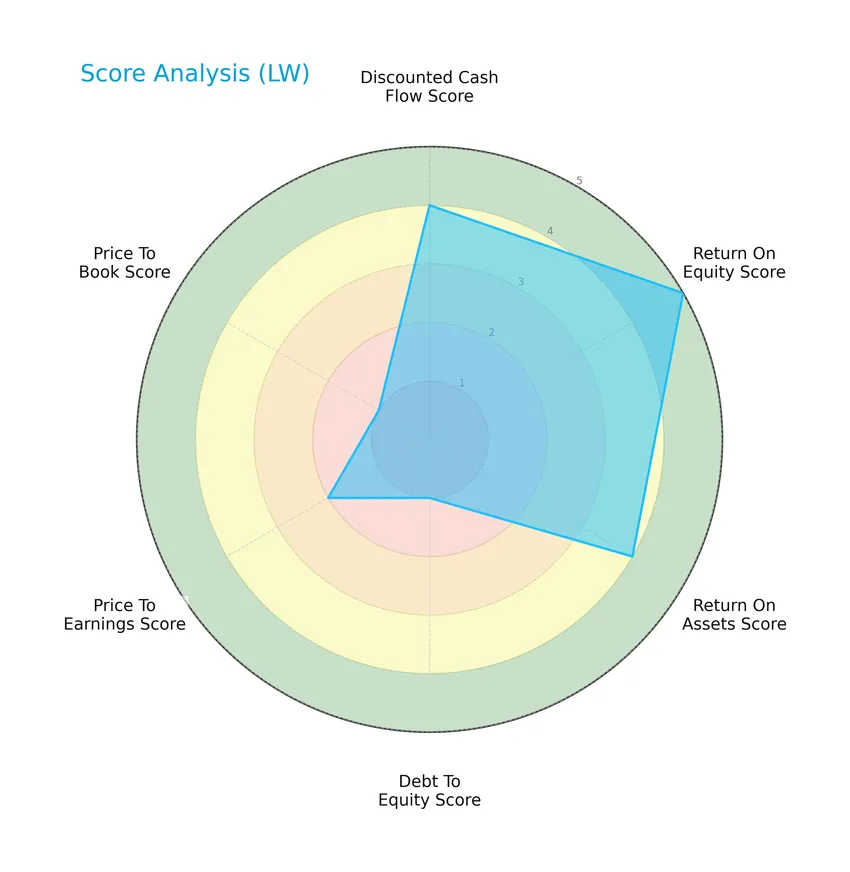
The company shows strong performance in return on equity (score 5) and favorable discounted cash flow (4) and return on assets (4). However, debt-to-equity (1) and price-to-book (1) scores are very unfavorable, indicating higher leverage and valuation concerns. Price-to-earnings is moderate (2), while the overall score is moderate (3).
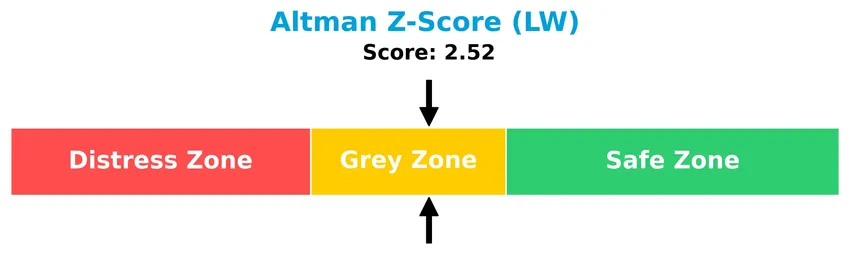
Analysis of the company’s bankruptcy risk
Lamb Weston Holdings, Inc. is currently positioned in the grey zone for bankruptcy risk, indicating a moderate probability of financial distress:
Is the company in good financial health?
The Piotroski diagram below illustrates the company’s financial strength based on nine criteria:

With a Piotroski Score of 9, the company demonstrates very strong financial health, reflecting excellent profitability, leverage, liquidity, and operational efficiency.
Competitive Landscape & Sector Positioning
This section will analyze Lamb Weston Holdings, Inc.’s strategic positioning, revenue by segment, key products, main competitors, competitive advantages, and SWOT analysis. I will assess whether Lamb Weston holds a competitive advantage over its industry peers based on these factors.
Strategic Positioning
Lamb Weston Holdings, Inc. maintains a diversified product portfolio with key segments in Foodservice ($1.49B), Global ($2.93B), Retail ($798M), and Other ($129M) as of 2023. Geographically, it balances North American sales ($4.27B in 2025) with significant global exposure ($2.19B), reflecting a broad market footprint in frozen potato products.
Revenue by Segment
The pie chart illustrates Lamb Weston Holdings, Inc.’s revenue distribution by segment for the fiscal year 2023, showing the contribution of Foodservice, Global, Retail, and Other segments.

In 2023, the Global Segment led with $2.93B, followed by the Foodservice Segment at $1.49B, Retail at $798M, and Other at $129M. The Global Segment showed significant growth compared to previous years, indicating a strong international expansion. The Foodservice and Retail segments also increased steadily, demonstrating balanced growth. The addition of the Other segment in 2023 adds minor diversification but remains a small portion of total revenue, suggesting concentration risk primarily lies in the Global and Foodservice segments.
Key Products & Brands
The following table summarizes Lamb Weston Holdings, Inc.’s key products and brands along with their descriptions:
| Product | Description |
|---|---|
| Frozen Potato Products | Value-added frozen potato items produced, distributed, and marketed worldwide under Lamb Weston and other labels. |
| Commercial Ingredients | Ingredients supplied primarily for commercial foodservice and retail use. |
| Appetizers | Frozen appetizer products offered under Lamb Weston brand and other customer or licensed brands. |
| Lamb Weston Brand | The company’s flagship brand for frozen potato and related products. |
| Grown in Idaho | Owned or licensed brand specializing in premium frozen potato products. |
| Alexia | Owned or licensed brand focusing on frozen potato and vegetable products. |
| Retail Segment | Frozen potato and related products sold through grocery, mass merchant, club, and specialty retailers. |
| Foodservice Segment | Products supplied to independent and regional chain restaurants, convenience stores, and educational institutions. |
| Global Segment | International distribution and sales of frozen potato products. |
| Other | Includes vegetable and dairy businesses alongside other product lines. |
Lamb Weston’s product portfolio centers on frozen potato products, marketed globally through multiple brands and channels, serving both retail and foodservice customers across varied market segments.
Main Competitors
There are 11 competitors in total, with the table below showing the top 10 leaders by market capitalization:
| Competitor | Market Cap. |
|---|---|
| JBS N.V. | 32B |
| The Kraft Heinz Company | 28.9B |
| General Mills, Inc. | 24.9B |
| McCormick & Company, Incorporated | 18.1B |
| Hormel Foods Corporation | 12.9B |
| The J. M. Smucker Company | 10.3B |
| The Magnum Ice Cream Company N.V. | 9.7B |
| Pilgrim’s Pride Corporation | 9.3B |
| Conagra Brands, Inc. | 8.3B |
| Campbell Soup Company | 8.3B |
Lamb Weston Holdings, Inc. ranks 11th among 11 competitors, with a market cap approximately 19% that of the leader, JBS N.V. The company is positioned below both the average market cap of the top 10 competitors (16.2B) and the sector median (10.3B). Its market cap is 35.54% lower than its closest competitor above, indicating a notable gap in scale.
Comparisons with competitors
Check out how we compare the company to its competitors:
Does LW have a competitive advantage?
Lamb Weston Holdings, Inc. demonstrates a slight competitive advantage, as it is creating value with an ROIC 2.55% above its WACC, indicating efficient use of invested capital despite a declining profitability trend. Its gross margin of 21.68% and net margin of 5.54% remain favorable, supporting its position within the packaged foods industry.
Looking ahead, Lamb Weston’s extensive product portfolio and global reach, including segments in North America and international markets, offer opportunities for growth. The company’s established brands and focus on value-added frozen potato products position it to capitalize on evolving consumer demand and potential market expansion.
SWOT Analysis
This SWOT analysis highlights Lamb Weston Holdings, Inc.’s key internal strengths and weaknesses alongside external opportunities and threats to guide strategic investment decisions.
Strengths
- strong global brand portfolio
- favorable ROE at 20.56%
- consistent dividend yield of 2.88%
Weaknesses
- declining revenue and profit growth in last year
- high debt-to-equity ratio of 2.39
- weak liquidity ratios (quick ratio 0.68)
Opportunities
- expanding frozen food market globally
- growth potential in foodservice and retail segments
- innovation in value-added frozen products
Threats
- raw material price volatility
- intense competition in packaged foods
- potential supply chain disruptions
Overall, Lamb Weston demonstrates solid brand strength and profitability but faces near-term earnings pressure and leverage risks. The company’s strategy should focus on debt reduction and operational efficiency while leveraging market growth opportunities.
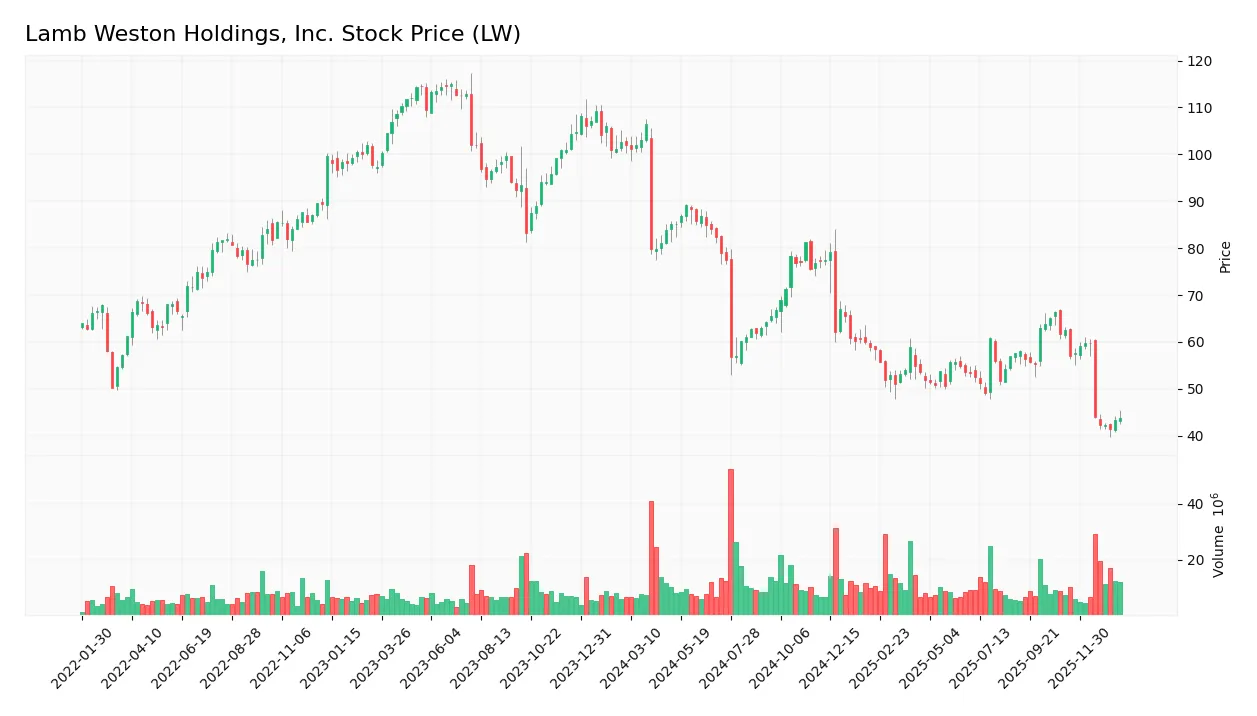
Stock Price Action Analysis
The weekly stock chart below illustrates Lamb Weston Holdings, Inc.’s price movements over the past 100 weeks:
Trend Analysis
Over the past 100 weeks, LW’s stock price declined by 57.16%, indicating a bearish trend with deceleration in the downward movement. The price fluctuated notably, with a high of 106.53 and a low of 41.37. The standard deviation of 14.87 reflects substantial volatility during this period.
Volume Analysis
Trading volume has been increasing overall, with a total of 1.36B shares traded. Buyer volume accounts for 49.61%, nearly balanced with sellers. However, in the recent three months, seller volume dominates at 58.69%, indicating slightly seller-driven activity and cautious investor sentiment.
Target Prices
The consensus target prices for Lamb Weston Holdings, Inc. reflect moderate upside potential based on current analyst estimates.
| Target High | Target Low | Consensus |
|---|---|---|
| 68 | 46 | 52.67 |
Analysts expect the stock to trade between $46 and $68, with a consensus price of approximately $52.67, indicating cautious optimism in the medium term.

Don’t Let Luck Decide Your Entry Point
Optimize your entry points with our advanced ProRealTime indicators. You’ll get efficient buy signals with precise price targets for maximum performance. Start outperforming now!
Analyst & Consumer Opinions
This section examines the recent analyst ratings and consumer feedback concerning Lamb Weston Holdings, Inc. (LW).
Stock Grades
Below is the latest summary of Lamb Weston Holdings, Inc. grades from reputable financial institutions as of late 2025:
| Grading Company | Action | New Grade | Date |
|---|---|---|---|
| Wells Fargo | Maintain | Overweight | 2025-12-23 |
| Barclays | Maintain | Overweight | 2025-12-23 |
| B of A Securities | Maintain | Neutral | 2025-12-22 |
| Stifel | Maintain | Hold | 2025-12-22 |
| Deutsche Bank | Maintain | Hold | 2025-12-22 |
The overall grade trend indicates a stable outlook with a mix of overweight and hold ratings, reflecting moderate confidence among analysts with no recent changes in their positions. The consensus remains cautious, leaning toward a hold stance.
Consumer Opinions
Consumers have mixed but generally favorable views on Lamb Weston Holdings, Inc., reflecting both appreciation and areas for improvement.
| Positive Reviews | Negative Reviews |
|---|---|
| “Consistently high-quality frozen potato products.” | “Occasional delays in shipment and order processing.” |
| “Great taste and texture, perfect for foodservice use.” | “Packaging could be more eco-friendly and sustainable.” |
| “Reliable supply chain even during peak demand periods.” | “Pricing is a bit higher compared to competitors.” |
Overall, consumers praise Lamb Weston for product quality and reliability, while common concerns include shipping delays and pricing, suggesting room to enhance logistics and cost competitiveness.
Risk Analysis
Below is a summary table of key risks facing Lamb Weston Holdings, Inc., highlighting their likelihood and potential impact on investment value:
| Category | Description | Probability | Impact |
|---|---|---|---|
| Financial Leverage | High debt-to-equity ratio (2.39) increases financial risk | High | High |
| Market Valuation | Unfavorable price-to-book ratio (4.14) suggests overvaluation | Medium | Medium |
| Liquidity | Low quick ratio (0.68) may limit short-term financial flexibility | Medium | Medium |
| Profitability | Moderate net margin (5.54%) limits buffer against downturns | Medium | Medium |
| Bankruptcy Risk | Altman Z-Score in grey zone (2.52) indicates moderate distress | Medium | High |
| Industry Exposure | Dependence on frozen potato products may limit diversification | Medium | Medium |
The most pressing risks for Lamb Weston involve its elevated leverage and moderate bankruptcy risk, as reflected by a debt-to-equity ratio of 2.39 and an Altman Z-Score in the grey zone. While profitability and liquidity metrics are stable yet moderate, investors should carefully monitor financial stability given these leverage concerns.
Should You Buy Lamb Weston Holdings, Inc.?
Lamb Weston Holdings, Inc. appears to be generating value with a slightly favorable moat despite declining profitability, while its leverage profile could be seen as substantial. Supported by a very strong Piotroski score but a grey zone Altman Z-score, the overall rating suggests a moderate B profile.
Strength & Efficiency Pillars
Lamb Weston Holdings, Inc. exhibits solid profitability with a return on equity (ROE) of 20.56% and a net margin of 5.54%, underscoring efficient operations. The company is a clear value creator as its return on invested capital (ROIC) stands at 7.43%, notably above its weighted average cost of capital (WACC) of 4.88%. Financial health indicators show a Piotroski Score of 9, signaling very strong financial strength, while the Altman Z-Score of 2.52 places it in the grey zone, indicating moderate bankruptcy risk but overall resilience.
Weaknesses and Drawbacks
Despite these strengths, Lamb Weston faces valuation and leverage concerns. Its price-to-book ratio of 4.14 is unfavorable, suggesting the stock is priced at a premium relative to book value. The debt-to-equity ratio is high at 2.39, reflecting significant leverage that could pressure financial flexibility. Liquidity ratios also raise caution: a quick ratio of 0.68 is unfavorable, indicating potential short-term liquidity constraints. Additionally, recent market trends reveal seller dominance with only 41.31% buyer volume, contributing to a bearish stock trend marked by a sharp 57.16% overall price decline.
Our Verdict about Lamb Weston Holdings, Inc.
Lamb Weston’s long-term fundamental profile might appear favorable, supported by strong value creation and financial metrics. However, the bearish overall trend coupled with recent seller dominance suggests caution. Despite the company’s resilience and profitability, recent market pressure could imply a wait-and-see approach may be prudent before considering entry, as the risk of continued downside remains notable.
Disclaimer: This content is for informational purposes only and does not constitute financial, investment, or other professional advice. Investing in financial markets involves a significant risk of loss, and past performance is not indicative of future results.
Additional Resources
- Lamb Weston Holdings: Upgrade To Buy On Earnings Growth Potential (NYSE:LW) – Seeking Alpha (Jan 23, 2026)
- Lamb Weston Holdings, Inc. (LW): A Bull Case Theory – Yahoo Finance (Jan 15, 2026)
- Bear of the Day: Lamb Weston (LW) – Finviz (Jan 22, 2026)
- Lamb Weston Holdings, Inc. (LW): A bull case theory – MSN (Jan 15, 2026)
- Should Lamb Weston’s (LW) Latin America Plant Closures and Production Shift Require Action From Investors? – simplywall.st (Jan 18, 2026)
For more information about Lamb Weston Holdings, Inc., please visit the official website: lambweston.com