Home > Analyses > Technology > Lam Research Corporation
Lam Research Corporation drives the evolution of the semiconductor industry by crafting the sophisticated equipment essential for fabricating integrated circuits that power modern technology. Renowned for its innovative solutions in deposition, etching, and wafer cleaning, Lam stands at the forefront of semiconductor manufacturing technology, serving global leaders in tech hardware. As the demand for advanced chips accelerates, I explore whether Lam’s solid market position and cutting-edge portfolio continue to justify its premium valuation and growth prospects.
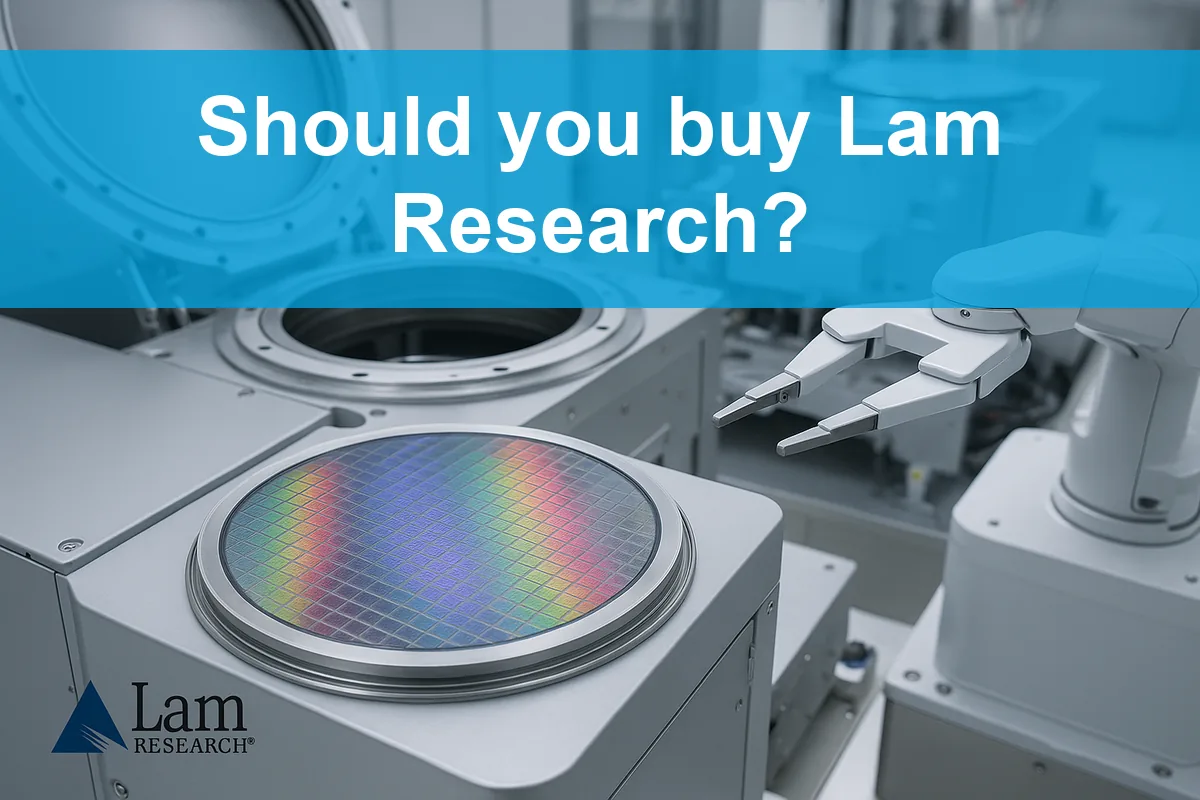
Table of contents
Business Model & Company Overview
Lam Research Corporation, founded in 1980 and headquartered in Fremont, California, stands as a dominant player in the semiconductor equipment industry. Its cohesive ecosystem spans advanced processing systems designed for integrated circuit fabrication, including deposition, etching, and wafer cleaning technologies. This comprehensive suite fuels semiconductor manufacturing, reflecting the company’s core mission to enable cutting-edge chip production.
The company’s revenue engine balances sophisticated hardware with complementary software and services, driving recurring value across global markets such as the Americas, Europe, and Asia. Lam’s strategic footprint in key semiconductor hubs underpins its competitive strength. Its robust portfolio and innovation create a significant economic moat, shaping the future of semiconductor fabrication worldwide.
Financial Performance & Fundamental Metrics
I will analyze Lam Research Corporation’s income statement, key financial ratios, and dividend payout policy to provide a clear view of its financial health.
Income Statement
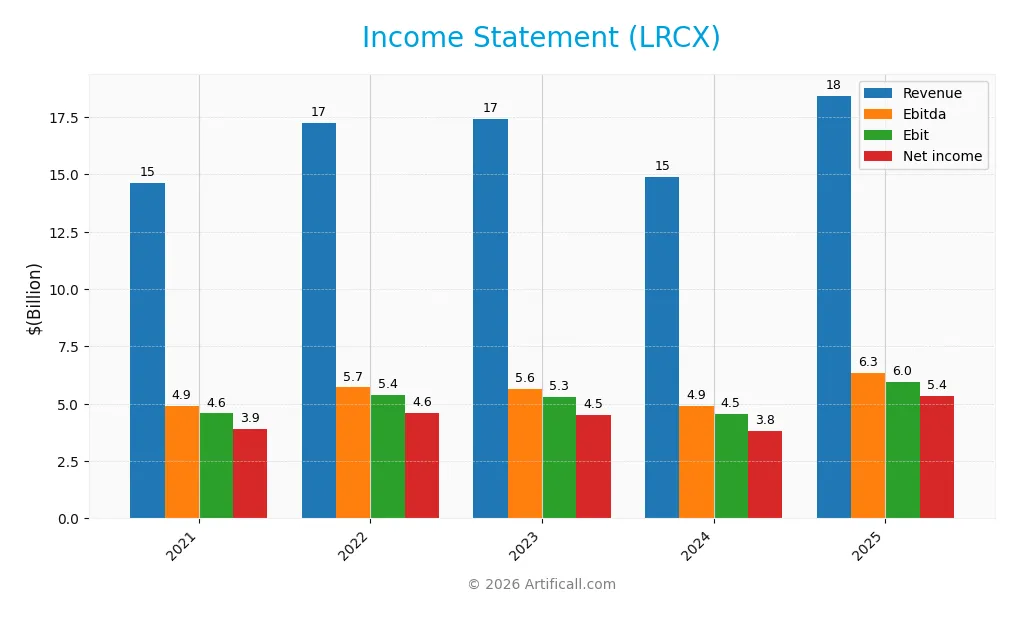
The table below presents Lam Research Corporation’s key income statement figures for fiscal years 2021 through 2025, reported in USD.
| 2021 | 2022 | 2023 | 2024 | 2025 | |
|---|---|---|---|---|---|
| Revenue | 14.63B | 17.23B | 17.43B | 14.91B | 18.44B |
| Cost of Revenue | 7.82B | 9.36B | 9.65B | 7.85B | 9.46B |
| Operating Expenses | 2.32B | 2.49B | 2.60B | 2.79B | 3.08B |
| Gross Profit | 6.81B | 7.87B | 7.78B | 7.05B | 8.98B |
| EBITDA | 4.89B | 5.71B | 5.64B | 4.91B | 6.34B |
| EBIT | 4.58B | 5.38B | 5.30B | 4.55B | 5.96B |
| Interest Expense | 209M | 185M | 186M | 185M | 178M |
| Net Income | 3.91B | 4.61B | 4.51B | 3.83B | 5.36B |
| EPS | 2.72 | 3.29 | 3.33 | 2.91 | 4.17 |
| Filing Date | 2021-08-17 | 2022-08-24 | 2023-08-15 | 2024-08-29 | 2025-08-11 |
Income Statement Evolution
Lam Research Corporation’s revenue increased by 26.1% overall from 2021 to 2025, with a notable 23.7% surge in the last year. Net income grew 37.1% over the period, supported by an 8.8% improvement in net margin to 29.1%. Gross and EBIT margins also improved, reaching 48.7% and 32.3% respectively, indicating enhanced profitability and operational efficiency.
Is the Income Statement Favorable?
In fiscal 2025, Lam Research displayed strong fundamentals with a 23.7% revenue increase to $18.4B and net income of $5.36B, reflecting a 13.2% rise in net margin. Operating expenses grew proportionally to revenue, supporting sustainable expansion. Interest expense remained modest at 0.97% of revenue, contributing to favorable financial health. Overall, all key income statement metrics are assessed as favorable for the year.
Financial Ratios
The table below summarizes key financial ratios for Lam Research Corporation (LRCX) over the last five fiscal years, highlighting profitability, liquidity, leverage, and market valuation metrics:
| Ratios | 2021 | 2022 | 2023 | 2024 | 2025 |
|---|---|---|---|---|---|
| Net Margin | 27% | 27% | 26% | 26% | 29% |
| ROE | 65% | 73% | 55% | 45% | 54% |
| ROIC | 32% | 38% | 31% | 25% | 34% |
| P/E | 24 | 13 | 19 | 36 | 23 |
| P/B | 15.5 | 9.5 | 10.6 | 16.3 | 12.7 |
| Current Ratio | 3.30 | 2.69 | 3.16 | 2.97 | 2.21 |
| Quick Ratio | 2.54 | 1.82 | 2.01 | 2.00 | 1.55 |
| D/E | 0.83 | 0.80 | 0.61 | 0.58 | 0.48 |
| Debt-to-Assets | 31% | 29% | 27% | 27% | 22% |
| Interest Coverage | 21.5 | 29.1 | 27.8 | 23.0 | 33.1 |
| Asset Turnover | 0.92 | 1.00 | 0.93 | 0.80 | 0.86 |
| Fixed Asset Turnover | 9.90 | 10.46 | 9.39 | 6.92 | 7.59 |
| Dividend Yield | 0.78% | 1.37% | 1.04% | 0.73% | 0.92% |
Evolution of Financial Ratios
Over the period to 2025, Lam Research Corporation’s Return on Equity (ROE) showed a generally positive trend, peaking at 73.35% in 2022 before settling at 54.33% in 2025. The Current Ratio declined from above 3.3 in 2021 to 2.21 in 2025, indicating a decrease in liquidity but remaining above 2. The Debt-to-Equity Ratio improved from 0.83 in 2021 to 0.48 in 2025, reflecting reduced leverage and enhanced financial stability. Profitability margins remained relatively stable with a net margin around 29% in 2025.
Are the Financial Ratios Favorable?
In 2025, profitability ratios such as net margin (29.06%) and ROE (54.33%) are assessed as favorable, alongside a strong return on invested capital at 34%. Liquidity ratios are solid with a current ratio of 2.21 and quick ratio of 1.55, both favorable. Leverage is moderate, with a debt-to-equity ratio of 0.48 and debt-to-assets at 22.28%, also favorable. Market valuation ratios present mixed signals: the price-to-earnings ratio is neutral at 23.36, while price-to-book is unfavorable at 12.69. Overall, 64.29% of ratios are favorable, supporting a generally positive financial profile.
Shareholder Return Policy
Lam Research Corporation maintains a dividend payout ratio around 20-27%, with dividend per share steadily increasing from $0.51 in 2021 to $0.89 in 2025, yielding below 1.4% annually. Dividend payments are well covered by free cash flow, supporting a balanced distribution approach.
The company also engages in share buybacks, complementing dividends to return capital. This policy appears sustainable, reflecting disciplined cash flow management and supporting long-term shareholder value without risking excessive distributions or leverage.
Score analysis
The following radar chart illustrates Lam Research Corporation’s key financial scores, offering a snapshot of its valuation and profitability metrics:
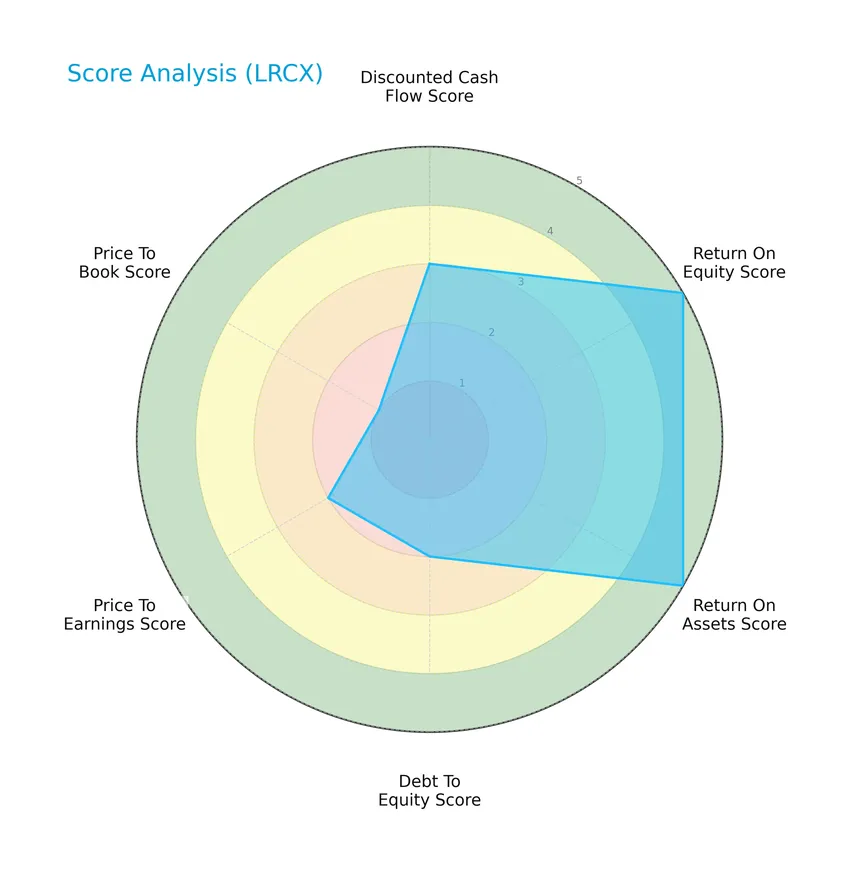
Lam Research shows very favorable returns on equity and assets, scoring 5 on both, while its discounted cash flow is moderate at 3. The company’s debt-to-equity and price-to-earnings scores stand at moderate levels of 2, with a very unfavorable price-to-book score of 1.
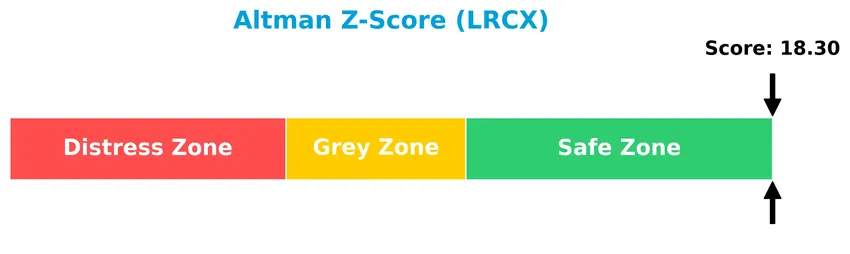
Analysis of the company’s bankruptcy risk
Lam Research’s Altman Z-Score indicates a strong financial position with minimal bankruptcy risk, placing it well within the safe zone:
Is the company in good financial health?
The Piotroski Score diagram below reflects Lam Research’s solid financial health and operational strength:
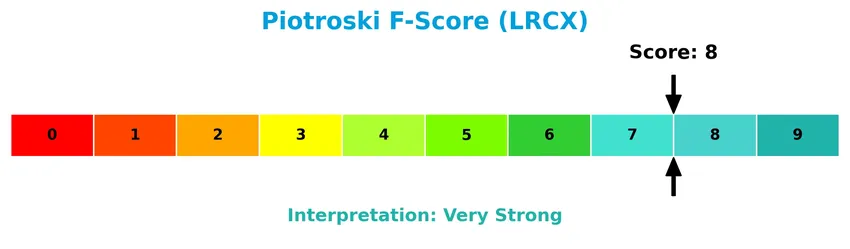
With a Piotroski Score of 8, classified as very strong, the company demonstrates robust profitability, liquidity, and efficiency, signaling a well-managed and financially healthy business.
Competitive Landscape & Sector Positioning
This sector analysis will examine Lam Research Corporation’s strategic positioning, revenue by segment, key products, main competitors, and competitive advantages. I will assess whether Lam Research holds a distinct competitive edge over its industry rivals.
Strategic Positioning
Lam Research Corporation maintains a concentrated product portfolio focused on semiconductor processing equipment, with revenue split between Systems (~$11.5B in 2025) and Customer Support (~$6.9B). Geographically, its exposure is diversified across Asia-Pacific (notably China $6.2B, Korea $4.1B, Taiwan $3.4B, Japan $1.9B), the US ($1.4B), and Europe ($563M), reflecting broad international market penetration.
Revenue by Segment
The pie chart illustrates Lam Research Corporation’s revenue distribution across its segments for the fiscal year 2025, highlighting the relative contributions of “System” and “Customer Support and Other.”
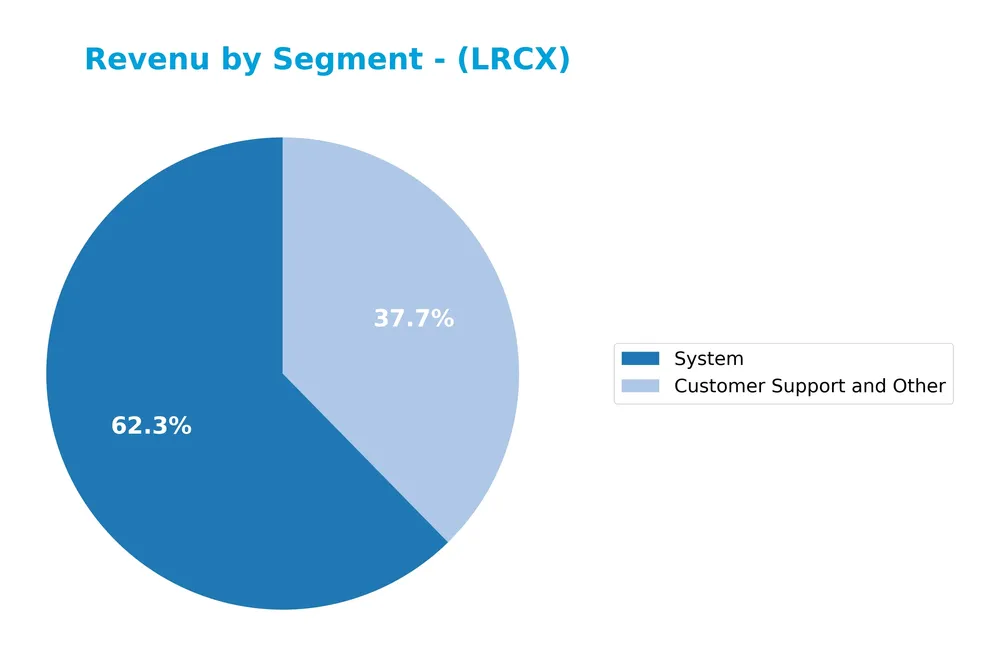
In 2025, the System segment remains the primary revenue driver at approximately 11.5B, showing strong growth from 8.9B in 2024. Customer Support and Other also increased to about 6.9B, continuing a steady upward trend. The acceleration in System revenue suggests robust demand for core products, while the consistent rise in support services adds diversification. This balance mitigates concentration risk while signaling healthy expansion in both segments.
Key Products & Brands
The table below outlines Lam Research Corporation’s key products and brands with their descriptions:
| Product | Description |
|---|---|
| ALTUS | Systems for depositing conformal films used in tungsten metallization applications. |
| SABRE | Electrochemical deposition products designed for copper interconnect transition and damascene manufacturing. |
| SOLA | Ultraviolet thermal processing products for film treatments. |
| VECTOR | Plasma-enhanced CVD ALD products used in semiconductor fabrication. |
| SPEED | High-density plasma chemical vapor deposition products for gapfill applications. |
| Striker | Single-wafer atomic layer deposition products for dielectric film solutions. |
| Flex | Dielectric etch application products. |
| Kiyo | Conductor etch application products. |
| Syndion | Through-silicon via etch application products. |
| Versys | Metal etch process products. |
| Coronus | Bevel clean products aimed at enhancing die yield. |
| Da Vinci, DV-Prime, EOS, SP series | Products addressing various wafer cleaning applications. |
| Metryx | Mass metrology systems for high precision in-line mass measurement in semiconductor wafer manufacturing. |
Lam Research’s portfolio features advanced semiconductor processing equipment and solutions focused on deposition, etching, and cleaning technologies, supporting integrated circuit fabrication globally.
Main Competitors
There are 38 competitors in the semiconductors industry, with the table below listing the top 10 leaders by market capitalization:
| Competitor | Market Cap. |
|---|---|
| NVIDIA Corporation | 4.6T |
| Broadcom Inc. | 1.6T |
| Taiwan Semiconductor Manufacturing Company Limited | 1.6T |
| ASML Holding N.V. | 415B |
| Advanced Micro Devices, Inc. | 363B |
| Micron Technology, Inc. | 353B |
| Lam Research Corporation | 232B |
| Applied Materials, Inc. | 214B |
| QUALCOMM Incorporated | 185B |
| Intel Corporation | 173B |
Lam Research Corporation ranks 7th among 38 competitors in the semiconductor sector. Its market capitalization is approximately 6% that of the sector leader, NVIDIA. The company is positioned below the average market cap of the top 10 competitors (974B) but remains above the sector median (31B). It holds a solid gap of +29% over its closest competitor above, indicating a distinct competitive stance.
Comparisons with competitors
Check out how we compare the company to its competitors:
Does LRCX have a competitive advantage?
Lam Research Corporation presents a very favorable competitive advantage, evidenced by a high ROIC exceeding WACC by over 21%, coupled with a growing ROIC trend, indicating efficient capital use and value creation. The company maintains strong profitability with favorable margins and consistent growth in revenue and net income over recent years.
Looking ahead, LRCX’s outlook includes expanding its semiconductor equipment portfolio and global market presence, particularly across Asia and the US, supported by innovative product lines like ALTUS, SABRE, and VECTOR. These developments position the company to capitalize on ongoing semiconductor industry demand and technological advancements.
SWOT Analysis
This SWOT analysis highlights Lam Research Corporation’s key internal strengths and weaknesses, alongside external opportunities and threats, to inform strategic investment decisions.
Strengths
- Strong profitability with 29% net margin
- Robust revenue growth of 23.7% in 2025
- Durable competitive advantage with growing ROIC
Weaknesses
- High beta of 1.78 indicating stock volatility
- Elevated price-to-book ratio of 12.69
- Low dividend yield at 0.92% may deter income investors
Opportunities
- Growing demand in semiconductor fabrication globally
- Expansion potential in Asia-Pacific markets, especially Korea and Taiwan
- Innovation in advanced semiconductor equipment technology
Threats
- Geopolitical tensions affecting China and Taiwan trade
- Intense competition in semiconductor equipment industry
- Supply chain disruptions impacting manufacturing and delivery
Lam Research demonstrates solid financial health and competitive positioning, supported by strong profitability and growth metrics. However, investors should weigh the stock’s volatility and valuation risks against growth opportunities and sector threats when considering its inclusion in their portfolio.
Stock Price Action Analysis
The weekly stock chart below illustrates Lam Research Corporation’s price movements over the last 12 months, highlighting key fluctuations and trend patterns:
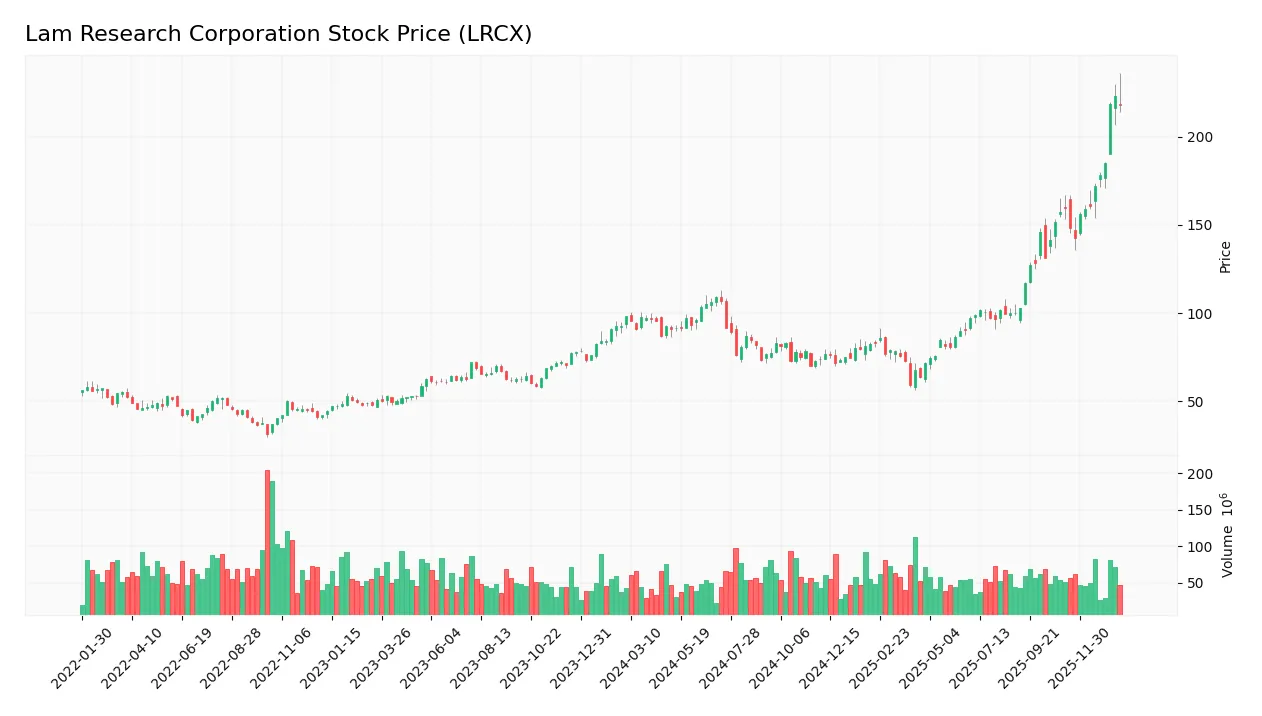
Trend Analysis
Over the past 12 months, LRCX’s stock price increased by 122.05%, indicating a strong bullish trend with clear acceleration. The price ranged from a low of 59.09 to a high of 222.96, showing heightened volatility with a standard deviation of 34.38. Recent months confirm continued upward momentum.
Volume Analysis
Trading volume over the last three months shows a strongly buyer-dominant market, with buyers accounting for 74.52% of activity. Volume is increasing, reflecting growing investor participation and positive market sentiment toward LRCX shares. Seller activity remains relatively subdued in this period.
Target Prices
The current analyst consensus for Lam Research Corporation (LRCX) suggests a favorable outlook supported by a wide target price range.
| Target High | Target Low | Consensus |
|---|---|---|
| 265 | 127 | 224.88 |
Analysts expect LRCX shares to trade between $127 and $265, with a consensus target near $225, indicating overall confidence in the stock’s growth potential.

Don’t Let Luck Decide Your Entry Point
Optimize your entry points with our advanced ProRealTime indicators. You’ll get efficient buy signals with precise price targets for maximum performance. Start outperforming now!
Analyst & Consumer Opinions
This section examines recent analyst ratings and consumer feedback related to Lam Research Corporation (LRCX).
Stock Grades
Here is a summary of the latest stock grades for Lam Research Corporation from recognized financial institutions:
| Grading Company | Action | New Grade | Date |
|---|---|---|---|
| Citigroup | Maintain | Buy | 2026-01-22 |
| Deutsche Bank | Maintain | Buy | 2026-01-21 |
| UBS | Maintain | Buy | 2026-01-20 |
| Needham | Maintain | Buy | 2026-01-20 |
| Wells Fargo | Upgrade | Overweight | 2026-01-15 |
| Stifel | Maintain | Buy | 2026-01-14 |
| B of A Securities | Maintain | Buy | 2026-01-13 |
| Bernstein | Maintain | Outperform | 2026-01-12 |
| Mizuho | Maintain | Outperform | 2026-01-09 |
| Cantor Fitzgerald | Maintain | Overweight | 2026-01-08 |
The grades reveal a strong consensus favoring a positive outlook, with most firms maintaining Buy ratings and one notable upgrade from Wells Fargo. The variety of equivalent positive grades like Buy, Outperform, and Overweight reflects broad institutional confidence in the stock.
Consumer Opinions
Investors and users alike have shared mixed sentiments about Lam Research Corporation, reflecting the company’s strong industry position but also some areas for improvement.
| Positive Reviews | Negative Reviews |
|---|---|
| Consistently delivers cutting-edge semiconductor equipment | High product prices can be a barrier for smaller clients |
| Strong customer support and responsive technical teams | Occasional delays in product delivery reported |
| Robust financial performance inspires investor confidence | Complex product integration requires expert handling |
| Innovation in process technology keeps Lam competitive | Some users note a steep learning curve for new systems |
Overall, consumer feedback praises Lam Research for its innovative technology and solid support but points to pricing and complexity as recurring challenges. This balance is crucial for investors to consider in risk assessment.
Risk Analysis
Below is a summary table highlighting key risks associated with investing in Lam Research Corporation (LRCX):
| Category | Description | Probability | Impact |
|---|---|---|---|
| Market Volatility | High beta (1.779) indicates sensitivity to market swings. | High | Medium |
| Valuation Risk | Unfavorable price-to-book ratio (12.69) suggests overvaluation. | Medium | High |
| Industry Cyclicality | Semiconductor sector exposure to demand fluctuations. | Medium | High |
| Geopolitical Risk | Significant sales in China and Asia may face export restrictions. | Medium | Medium |
| Interest Rate Risk | WACC at 12.09% is relatively high, increasing capital costs. | Medium | Medium |
| Dividend Yield | Low yield (0.92%) may deter income-focused investors. | Low | Low |
| Financial Health | Strong Altman Z-Score (18.3) and Piotroski Score (8) reduce bankruptcy risk. | Low | Low |
Lam Research’s most likely risks stem from market volatility and valuation concerns, given its high beta and stretched price-to-book ratio. Semiconductor industry cyclicality and geopolitical tensions, especially involving China, also pose significant threats to revenue stability. However, the company’s robust financial health mitigates default risk substantially.
Should You Buy Lam Research Corporation?
Lam Research Corporation appears to be a robust value creator with a durable competitive moat supported by growing ROIC well above WACC. Despite moderate leverage profile indicators, the company’s financial health could be seen as very favorable, aligning with a B+ overall rating.
Strength & Efficiency Pillars
Lam Research Corporation exhibits robust profitability with a net margin of 29.06%, a return on equity (ROE) of 54.33%, and a return on invested capital (ROIC) of 34.0%. Notably, the company’s ROIC significantly exceeds its weighted average cost of capital (WACC) of 12.09%, confirming its status as a clear value creator. Financial health metrics are equally impressive, with an Altman Z-Score of 18.30 placing it firmly in the safe zone and a Piotroski Score of 8 indicating very strong financial strength. These pillars underscore Lam Research’s operational efficiency and durable competitive advantage.
Weaknesses and Drawbacks
Despite its strengths, Lam Research faces valuation challenges. The price-to-book ratio stands at a high 12.69, which is very unfavorable, suggesting the stock might be trading at a premium relative to its book value. The price-to-earnings ratio at 23.36 is neutral but leans toward a premium valuation in the context of its sector. While leverage ratios are favorable with a debt-to-equity of 0.48 and a strong current ratio of 2.21, investors should remain cautious given the elevated valuation multiples that could limit near-term upside and introduce volatility risks.
Our Verdict about Lam Research Corporation
Lam Research’s long-term fundamental profile is favorable, supported by strong profitability, financial stability, and clear value creation. Coupled with a bullish overall stock trend and recent strong buyer dominance (74.52%), the profile suggests resilience and growth potential. This combination may appear attractive for long-term exposure, although the elevated valuation metrics advise a measured approach to entry timing to optimize risk-adjusted returns.
Disclaimer: This content is for informational purposes only and does not constitute financial, investment, or other professional advice. Investing in financial markets involves a significant risk of loss, and past performance is not indicative of future results.
Additional Resources
- 28,246 Shares in Lam Research Corporation $LRCX Acquired by Trek Financial LLC – MarketBeat (Jan 24, 2026)
- Lam Research Rides AI Supercycle As 2nm And CHIPS Act Catalysts Build – Sahm (Jan 24, 2026)
- Is It Too Late To Consider Lam Research (LRCX) After A 176% One Year Surge? – Yahoo Finance (Jan 20, 2026)
- Jim Cramer calls Lam Research the “best of the best” but warns against buying parabolic moves – MSN (Jan 24, 2026)
- Lam Research: Winning As Chips Go Vertical (NASDAQ:LRCX) – Seeking Alpha (Jan 21, 2026)
For more information about Lam Research Corporation, please visit the official website: lamresearch.com