Home > Analyses > Healthcare > Labcorp Holdings Inc.
Labcorp Holdings transforms healthcare by delivering precise lab testing that directly influences patient outcomes and medical decisions. As a dominant force in the medical equipment and services industry, Labcorp boasts an extensive network and cutting-edge diagnostics. Its commitment to innovation and quality secures a strong market presence. Yet, with evolving healthcare demands, I ask: does Labcorp’s current valuation reflect sustainable growth and robust fundamentals?

Table of contents
Business Model & Company Overview
Labcorp Holdings Inc., founded in 2024 and headquartered in Burlington, NC, stands as a leading force in the medical equipment and services industry. The company’s ecosystem centers on delivering comprehensive laboratory services that empower doctors, hospitals, pharmaceutical firms, researchers, and patients to make informed decisions with confidence. This integrated approach underpins Labcorp’s dominant market position in healthcare diagnostics.
Labcorp’s revenue engine balances high-volume laboratory testing and specialized diagnostic services, supporting critical healthcare outcomes worldwide. Its footprint spans key global markets, including the Americas, Europe, and Asia, ensuring broad access and scale. The company’s economic moat lies in its extensive network and trusted expertise, positioning it to shape the future of precision medicine and clinical diagnostics.
Financial Performance & Fundamental Metrics
I analyze Labcorp Holdings Inc.’s income statement, key financial ratios, and dividend payout policy to assess its financial health and shareholder value creation.
Income Statement
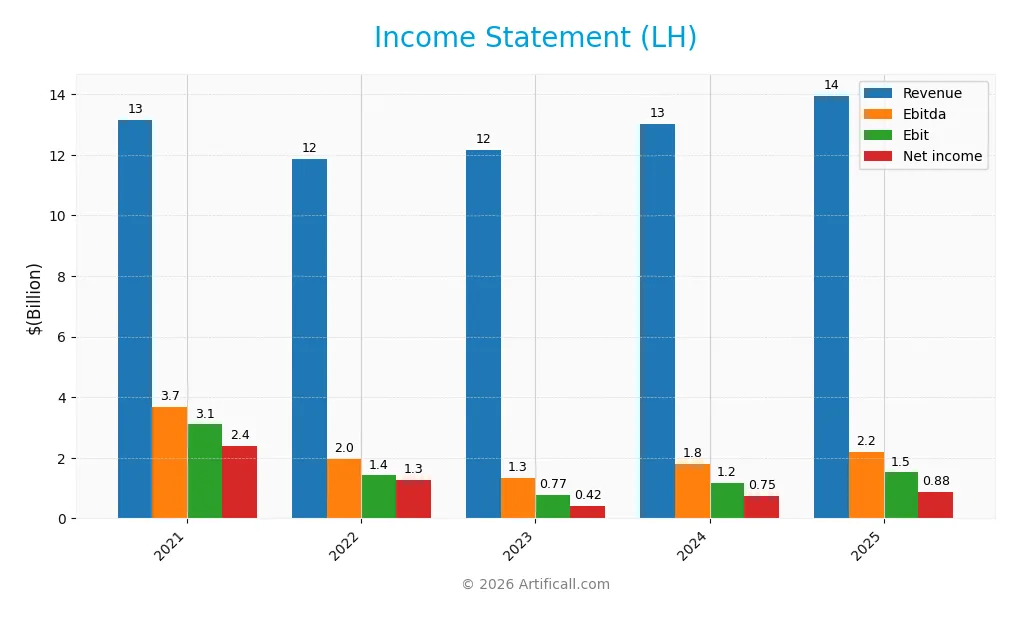
The table below shows Labcorp Holdings Inc.’s income statement for fiscal years 2021 through 2025, highlighting key profitability and expense metrics.
| 2021 | 2022 | 2023 | 2024 | 2025 | |
|---|---|---|---|---|---|
| Revenue | 13.14B | 11.86B | 12.16B | 13.01B | 13.95B |
| Cost of Revenue | 8.14B | 8.16B | 8.80B | 9.38B | 10.22B |
| Operating Expenses | 1.94B | 2.27B | 2.64B | 2.54B | 2.22B |
| Gross Profit | 4.99B | 3.71B | 3.36B | 3.62B | 3.73B |
| EBITDA | 3.68B | 1.95B | 1.35B | 1.81B | 2.20B |
| EBIT | 3.10B | 1.42B | 0.77B | 1.17B | 1.52B |
| Interest Expense | 212M | 180M | 200M | 208M | 224M |
| Net Income | 2.38B | 1.28B | 418M | 746M | 877M |
| EPS | 24.58 | 14.04 | 4.80 | 8.89 | 10.54 |
| Filing Date | 2022-02-25 | 2023-02-28 | 2024-02-26 | 2025-02-25 | 2026-02-24 |
Income Statement Evolution
Labcorp Holdings’ revenue increased steadily by 6.2% overall, with a 7.25% rise in 2025. Net income, however, declined sharply over the period, falling 63.1%. Gross margins remained stable near 26.75%, while EBIT margins improved significantly. The company showed margin resilience despite net income volatility, reflecting controlled operating expenses relative to revenue growth.
Is the Income Statement Favorable?
In 2025, fundamentals appear favorable with a 7.25% revenue increase and a strong 29.8% EBIT growth. Net margin expanded 9.55%, reaching 6.28%, supported by disciplined interest expenses at 1.61%. EPS rose 18.3%, signaling improved profitability per share. Despite past net income declines, recent margin and profit growth demonstrate operational improvement and financial discipline.
Financial Ratios
The following table summarizes Labcorp Holdings Inc.’s key financial ratios from 2021 to 2025, providing a clear view of profitability, efficiency, liquidity, leverage, and shareholder returns:
| Ratios | 2021 | 2022 | 2023 | 2024 | 2025 |
|---|---|---|---|---|---|
| Net Margin | 18.10% | 10.78% | 3.44% | 5.73% | 6.28% |
| ROE | 23.14% | 12.67% | 5.31% | 9.26% | 10.17% |
| ROIC | 13.03% | 6.64% | 3.31% | 5.21% | 7.39% |
| P/E | 10.98 | 14.41 | 47.36 | 25.79 | 23.81 |
| P/B | 2.54 | 1.83 | 2.51 | 2.39 | 2.42 |
| Current Ratio | 1.92 | 1.50 | 1.17 | 1.44 | 1.42 |
| Quick Ratio | 1.77 | 1.35 | 1.02 | 1.30 | 1.23 |
| D/E | 0.62 | 0.62 | 0.76 | 0.90 | 0.84 |
| Debt-to-Assets | 31.11% | 30.99% | 35.60% | 39.57% | 39.17% |
| Interest Coverage | 14.39 | 7.99 | 3.64 | 5.22 | 6.77 |
| Asset Turnover | 0.64 | 0.59 | 0.73 | 0.71 | 0.76 |
| Fixed Asset Turnover | 4.67 | 4.25 | 4.18 | 4.27 | 4.53 |
| Dividend Yield | 0.00% | 1.06% | 1.28% | 1.26% | 1.15% |
Evolution of Financial Ratios
Labcorp’s Return on Equity (ROE) declined from 23.1% in 2021 to 10.2% in 2025, signaling slowing profitability. The Current Ratio decreased from 1.92 to 1.42, suggesting tighter liquidity. Debt-to-Equity Ratio rose moderately from 0.62 to 0.84, reflecting stable but slightly increased leverage over the period.
Are the Financial Ratios Fovorable?
In 2025, profitability ratios like net margin (6.3%) and ROE (10.2%) remain neutral, indicating moderate earnings quality. Liquidity shows mixed signals with a neutral Current Ratio (1.42) but favorable Quick Ratio (1.23). Leverage ratios are neutral, supported by a manageable debt-to-equity of 0.84 and strong interest coverage of 6.77. Efficiency metrics like asset turnover (0.76) are neutral, while fixed asset turnover is favorable at 4.53. Overall, the financial ratios are slightly favorable.
Shareholder Return Policy
Labcorp Holdings Inc. pays a consistent dividend, with a payout ratio around 27% in 2025 and a yield near 1.15%. Dividends are covered by solid free cash flow, and the company maintains share buybacks, supporting shareholder returns without overextending capital.
This balanced approach aligns with sustainable value creation. Dividend distributions remain prudent relative to earnings, while buybacks offer additional capital return flexibility. The policy appears designed to preserve financial health and promote steady long-term shareholder gains.
Score analysis
The radar chart below presents a comprehensive view of Labcorp Holdings Inc.’s key financial scores:
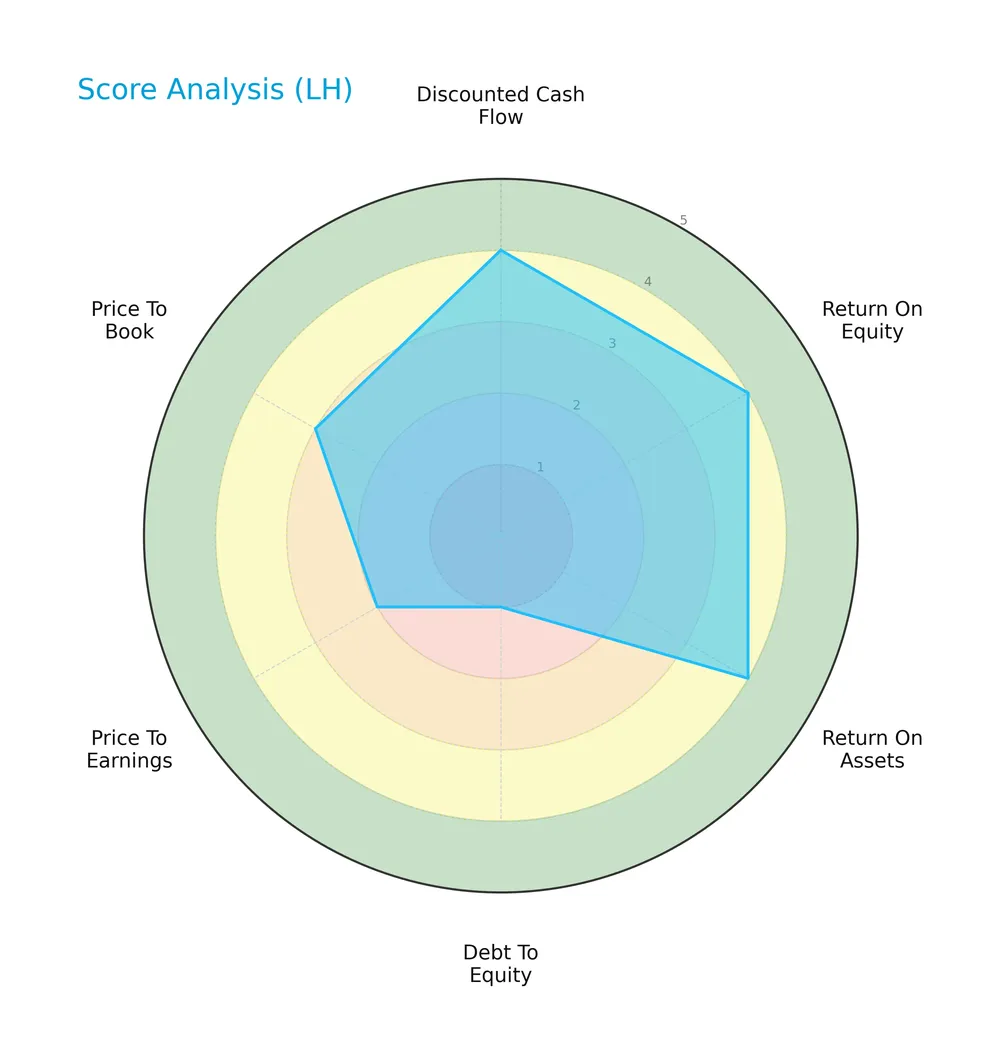
Labcorp scores favorably on discounted cash flow, return on equity, and return on assets, each rated 4. However, the debt-to-equity score is very unfavorable at 1, with price-to-earnings also weak at 2. Price-to-book sits in a moderate zone at 3.
Analysis of the company’s bankruptcy risk
Labcorp’s Altman Z-Score places it comfortably in the safe zone, indicating low bankruptcy risk:

Is the company in good financial health?
The Piotroski Score diagram provides insight into Labcorp’s financial strength and operational efficiency:

With a Piotroski Score of 6, Labcorp demonstrates average financial health, reflecting moderate profitability and stability without signaling strong or weak extremes.
Competitive Landscape & Sector Positioning
This section examines Labcorp Holdings Inc.’s strategic positioning, revenue streams, key products, and primary competitors. I will analyze whether Labcorp holds a competitive advantage within the healthcare sector.
Strategic Positioning
Labcorp Holdings focuses predominantly on diagnostics, generating over $10B in 2024 from this segment alone, with a smaller, declining drug development business. Its geographic exposure centers heavily on North America, with Europe and other countries contributing modestly to total revenue.
Revenue by Segment
This pie chart displays Labcorp Holdings Inc.’s revenue distribution by segment for fiscal year 2024, illustrating the company’s business composition and segment contributions.
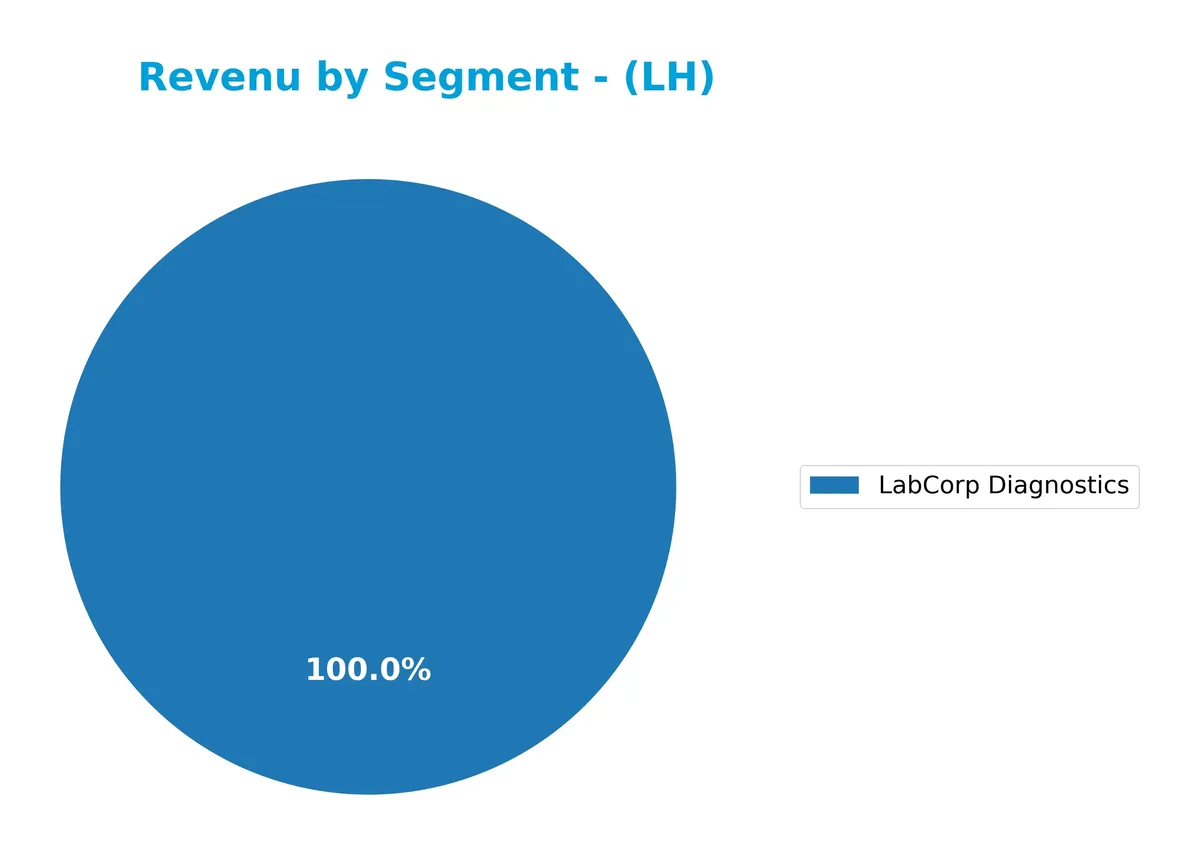
LabCorp Diagnostics remains the dominant revenue driver at $10.1B in 2024, showing steady growth from $9.4B in 2023. The drug development segment, once significant, no longer appears as a separate contributor, signaling a strategic consolidation or divestiture. This concentration in diagnostics highlights both strength and risk, as the company leans heavily on this segment to fuel growth amid evolving healthcare demands.
Key Products & Brands
Labcorp Holdings Inc. generates revenue primarily through these key products and brands:
| Product | Description |
|---|---|
| LabCorp Diagnostics | Clinical laboratory testing services supporting doctors, hospitals, and patients. |
| Covance Drug Development | Drug development services including preclinical and clinical research for pharmaceutical firms. |
| Diagnostics | General diagnostic laboratory services, including routine and specialized testing. |
| Drug Development | Broad services related to pharmaceutical research and drug trial management. |
| Clinical diagnostics laboratory | Laboratory testing focusing on clinical diagnostics for patient care. |
| Genomic and Esoteric Testing | Specialized genetic and complex diagnostic testing services. |
| Other Segments | Various smaller business units outside the main testing and development areas. |
| Ontario, Canada | Regional diagnostic services based in Ontario, Canada. |
| Routine Testing | Standardized laboratory tests frequently used in clinical practice. |
Labcorp’s revenue derives mainly from its diagnostic testing and drug development services. Its broad testing capabilities and pharmaceutical research offerings shape its core business.
Main Competitors
There are 64 competitors in the Healthcare Medical – Equipment & Services sector; below is a list of the top 10 leaders by market capitalization:
| Competitor | Market Cap. |
|---|---|
| Eli Lilly and Company | 970B |
| Johnson & Johnson | 500B |
| AbbVie Inc. | 405B |
| UnitedHealth Group Incorporated | 305B |
| AstraZeneca PLC | 285B |
| Merck & Co., Inc. | 268B |
| Thermo Fisher Scientific Inc. | 225B |
| Abbott Laboratories | 216B |
| Intuitive Surgical, Inc. | 201B |
| Amgen Inc. | 176B |
Labcorp Holdings Inc. ranks 41st among 64 competitors, with a market cap 2.46% the size of Eli Lilly’s 970B. The company sits below both the 355B average market cap of the top 10 and the 38B median for its sector. Its market cap is approximately 4.76% smaller than the next competitor above, highlighting a modest gap with closer rivals.
Comparisons with competitors
Check out how we compare the company to its competitors:
Aucun article trouvé pour ces critères.
Does Labcorp Holdings Inc. have a competitive advantage?
Labcorp Holdings Inc. currently lacks a clear competitive advantage, as it shows a declining return on invested capital and is shedding value relative to its cost of capital. Despite favorable income margins and recent earnings growth, the company’s overall profitability trend is unfavorable.
Looking ahead, Labcorp’s opportunities lie in expanding its laboratory services across North America and Europe, where it generates the majority of revenue. Continued innovation in diagnostics and partnerships with pharmaceutical companies could support future growth in these key markets.
SWOT Analysis
This analysis identifies Labcorp Holdings Inc.’s key internal and external factors affecting its market position and growth potential.
Strengths
- strong EBIT margin of 10.87%
- favorable interest coverage at 6.77x
- diversified geographic revenue base
Weaknesses
- declining ROIC trend
- net income dropped over 60% in 5 years
- moderate debt-to-equity ratio at 0.84
Opportunities
- expanding healthcare diagnostics market
- potential for operational efficiency gains
- growth in international markets
Threats
- intense competition in medical services
- regulatory changes in healthcare
- pricing pressures from payers
Labcorp shows solid operational margins and geographic diversification but struggles with declining returns and profitability over the long term. The company must focus on improving capital efficiency and navigating competitive and regulatory risks to sustain growth.
Stock Price Action Analysis
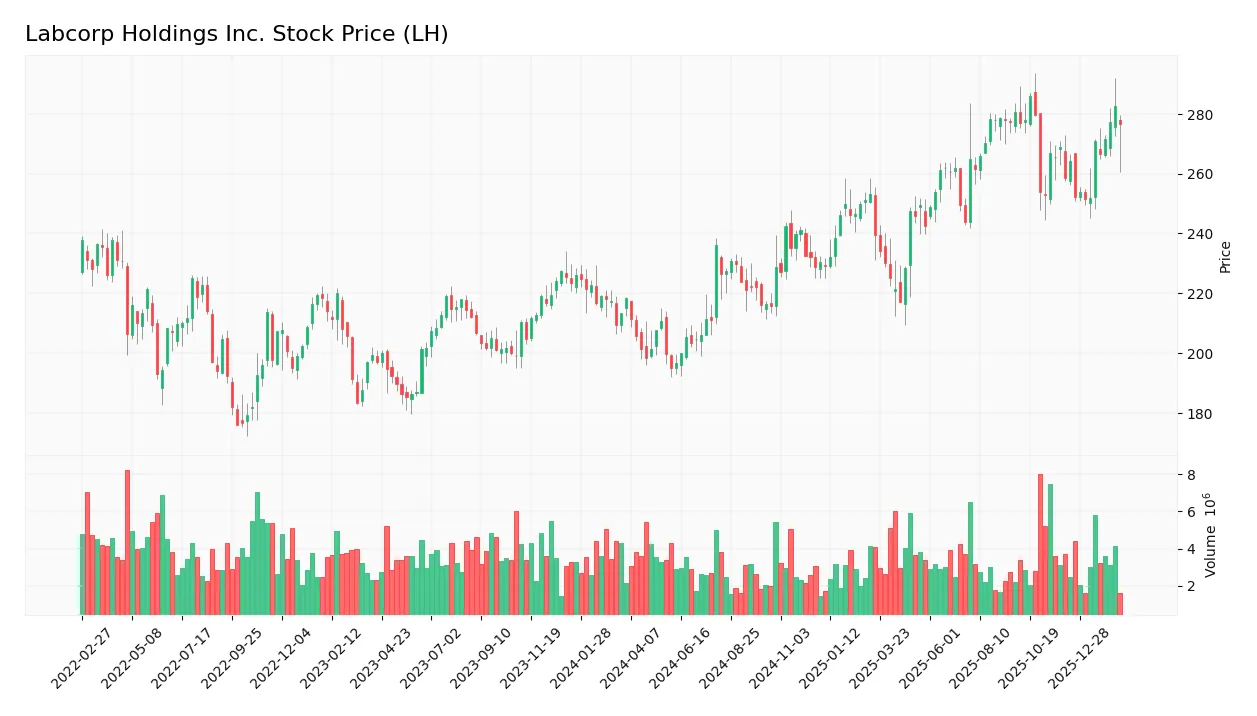
The following weekly chart illustrates Labcorp Holdings Inc.’s stock price movements and volatility over the recent year:
Trend Analysis
Over the past 12 months, Labcorp’s stock gained 36.32%, indicating a strong bullish trend with accelerating momentum. The price ranged from a low of 194.91 to a high of 288.0, reflecting significant upward movement amid elevated volatility (std dev 25.07). Recent three-month gains of 9.02% confirm continued positive momentum.
Volume Analysis
Trading volume shows an increasing trend with total volume at 396M shares. Buyers dominate with 51.1% overall, rising to 76.18% in the recent three months, signaling strong buyer-driven activity. This suggests heightened investor confidence and growing market participation in the stock.
Target Prices
Analysts present a solid target consensus for Labcorp Holdings Inc., reflecting confidence in its growth prospects.
| Target Low | Target High | Consensus |
|---|---|---|
| 290 | 342 | 315.38 |
The target range of 290 to 342 signals bullish expectations, with a consensus price of 315.38 indicating moderate upside potential.

Don’t Let Luck Decide Your Entry Point
Optimize your entry points with our advanced ProRealTime indicators. You’ll get efficient buy signals with precise price targets for maximum performance. Start outperforming now!
Analyst & Consumer Opinions
This section examines Labcorp Holdings Inc. (LH) through the lens of analyst ratings and consumer feedback.
Stock Grades
Here are the latest verified grades for Labcorp Holdings Inc. from established financial institutions:
| Grading Company | Action | New Grade | Date |
|---|---|---|---|
| JP Morgan | Maintain | Overweight | 2026-02-18 |
| Baird | Maintain | Outperform | 2026-02-18 |
| JP Morgan | Maintain | Overweight | 2026-02-06 |
| JP Morgan | Maintain | Overweight | 2025-11-07 |
| UBS | Maintain | Buy | 2025-10-29 |
| UBS | Maintain | Buy | 2025-10-17 |
| Mizuho | Maintain | Outperform | 2025-10-17 |
| Evercore ISI Group | Maintain | Outperform | 2025-10-03 |
| Barclays | Maintain | Equal Weight | 2025-10-02 |
| Truist Securities | Maintain | Buy | 2025-07-25 |
The consensus shows a strong buy bias with no downgrades or sell ratings. Most firms maintain positive outlooks, reflecting steady confidence in the stock’s performance.
Consumer Opinions
Labcorp Holdings Inc. evokes mixed reactions from its customers, reflecting both strong service qualities and areas needing improvement.
| Positive Reviews | Negative Reviews |
|---|---|
| Timely and accurate lab results improve patient care. | Customer service wait times can be excessively long. |
| Convenient test scheduling and multiple locations. | Some billing issues cause confusion and delays. |
| Professional and knowledgeable staff at collection centers. | Limited weekend hours restrict accessibility. |
Overall, customers praise Labcorp for reliability and professionalism. However, frustrations with customer support responsiveness and billing transparency persist as key pain points.
Risk Analysis
Below is a summary of key risks facing Labcorp Holdings Inc., including likelihood and potential impact:
| Category | Description | Probability | Impact |
|---|---|---|---|
| Market Volatility | Stock price swings due to sector cyclicality and economic shifts | Medium | Medium |
| Regulatory Risk | Changes in healthcare regulations affecting lab operations | Medium | High |
| Debt Management | Elevated debt-to-equity ratio signals financial leverage risk | High | Medium |
| Competitive Pressure | Intense competition in medical testing services | Medium | Medium |
| Liquidity Risk | Current ratio of 1.42 shows moderate buffer but requires monitoring | Low | Medium |
Labcorp’s moderate debt-to-equity ratio (0.84) demands caution despite a safe Altman Z-Score (3.22). Regulatory changes pose a high impact threat. Market volatility remains a consistent sector challenge. These risks require disciplined risk management amid healthcare’s evolving landscape.
Should You Buy Labcorp Holdings Inc.?
Labcorp Holdings Inc. appears to be a moderately profitable company with a slightly unfavorable moat due to declining ROIC and value erosion. Despite a manageable leverage profile, its overall rating of B+ suggests a cautious but favorable investment case.
Strength & Efficiency Pillars
Labcorp Holdings Inc. delivers solid operational performance, with a gross margin of 26.75% and an EBIT margin of 10.87%, both favorable indicators. The net margin stands at a neutral 6.28%, while return on equity (10.17%) and ROIC (7.39%) are moderate yet stable. The company’s weighted average cost of capital (7.07%) slightly undercuts its ROIC, suggesting Labcorp is marginally creating value. Interest coverage at 6.77x signals manageable debt servicing, supporting operational resilience.
Weaknesses and Drawbacks
Labcorp’s valuation metrics present mixed signals. A price-to-earnings ratio of 23.81 and price-to-book of 2.42 are neutral, indicating neither discount nor significant premium. Leverage ratios are moderate, with a debt-to-equity of 0.84 and a current ratio of 1.42, reflecting balanced liquidity but potential vulnerability in downturns. While the Altman Z-Score at 3.22 places the company safely above distress threshold, the Piotroski score of 6 signals average financial strength, leaving room for improvement.
Our Final Verdict about Labcorp Holdings Inc.
Labcorp’s financial profile suggests a stable, if unspectacular, long-term investment. The bullish overall trend with strong buyer dominance (76.18%) underscores positive market sentiment. Despite moderate profitability and average financial health, recent price acceleration might offer entry points. This profile might appeal to investors seeking steady exposure in healthcare diagnostics but suggests a cautious wait-and-see approach amid evolving fundamentals.
Disclaimer: This content is for informational purposes only and does not constitute financial, investment, or other professional advice. Investing in financial markets involves a significant risk of loss, and past performance is not indicative of future results.
Additional Resources
- LABCORP HOLDINGS INC. SEC 10-K Report – TradingView (Feb 24, 2026)
- The 5 Most Interesting Analyst Questions From Labcorp’s Q4 Earnings Call – Finviz (Feb 24, 2026)
- Insider Sell: Peter Wilkinson Sells Shares of Labcorp Holdings I – GuruFocus (Feb 24, 2026)
- What Analysts Are Saying About Labcorp Hldgs Stock – Benzinga (Feb 24, 2026)
- Labcorp Holdings Inc. $LH Stake Cut by Tredje AP fonden – MarketBeat (Feb 22, 2026)
For more information about Labcorp Holdings Inc., please visit the official website: labcorp.com