Home > Analyses > Industrials > L3Harris Technologies, Inc.
L3Harris Technologies powers the backbone of modern defense and aerospace, shaping global security through cutting-edge mission systems and communications. Its flagship ISR solutions and advanced electronic warfare technologies define industry standards. Renowned for innovation and reliability, L3Harris commands a critical role in both government and commercial sectors. As defense budgets fluctuate and technology evolves, I ask: does L3Harris’s strong foundation still warrant its premium valuation and growth outlook?

Table of contents
Business Model & Company Overview
L3Harris Technologies, Inc., founded in 1895 and headquartered in Melbourne, Florida, stands as a dominant player in aerospace and defense. It delivers an integrated ecosystem of mission-critical solutions spanning intelligence, surveillance, reconnaissance, and advanced communication systems. The company’s multi-segment approach unites airborne, maritime, space, and cyber technologies under one roof, driving innovation for government and commercial clients alike.
Its revenue engine balances high-value hardware with recurring software and service contracts across the Americas, Europe, and Asia. L3Harris generates steady cash flow from tactical communications and ISR platforms while expanding in space payloads and electronic warfare. This diversified model builds a robust economic moat, securing its influence in shaping global defense and aerospace technology’s future.
Financial Performance & Fundamental Metrics
I will analyze L3Harris Technologies, Inc.’s income statement, key financial ratios, and dividend payout policy to assess its core financial health and shareholder value.
Income Statement
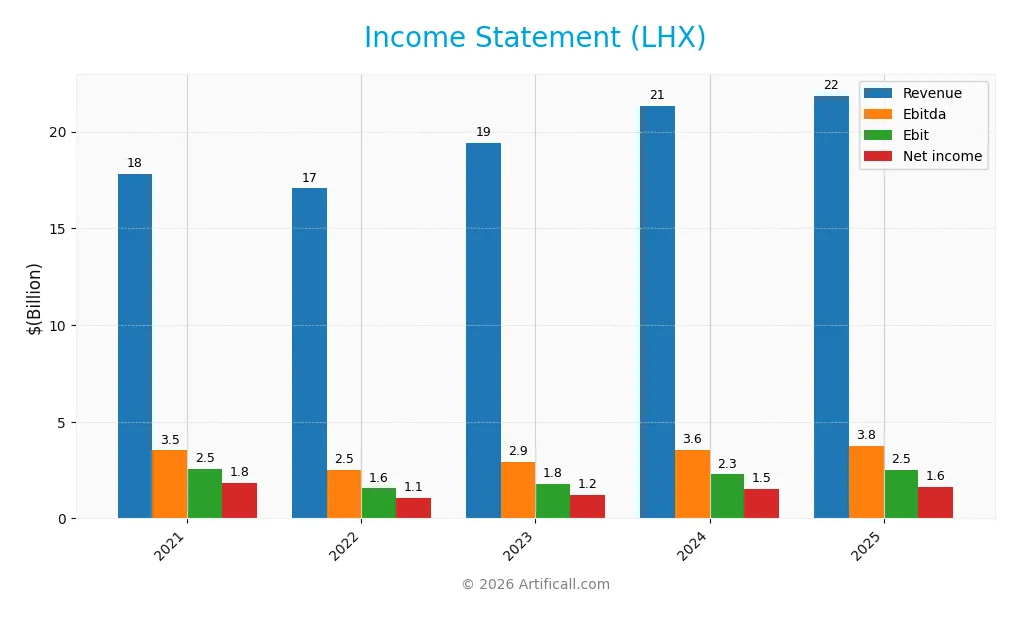
The table below summarizes L3Harris Technologies, Inc.’s key income statement figures for fiscal years 2021 through 2025, showing revenue, expenses, and profitability metrics.
| 2021 | 2022 | 2023 | 2024 | 2025 | |
|---|---|---|---|---|---|
| Revenue | 17.8B | 17.1B | 19.4B | 21.3B | 21.9B |
| Cost of Revenue | 12.4B | 12.1B | 14.9B | 16.6B | 16.2B |
| Operating Expenses | 3.2B | 3.8B | 2.4B | 2.7B | 3.4B |
| Gross Profit | 5.4B | 4.9B | 4.4B | 4.7B | 5.6B |
| EBITDA | 3.5B | 2.5B | 2.9B | 3.6B | 3.8B |
| EBIT | 2.5B | 1.6B | 1.8B | 2.3B | 2.5B |
| Interest Expense | 265M | 279M | 543M | 675M | 597M |
| Net Income | 1.8B | 1.1B | 1.2B | 1.5B | 1.6B |
| EPS | 9.17 | 5.54 | 6.47 | 7.91 | 8.57 |
| Filing Date | 2022-02-25 | 2023-02-24 | 2024-02-20 | 2025-02-14 | 2026-02-12 |
Income Statement Evolution
L3Harris Technologies’ revenue grew 23% from 2021 to 2025, with a slowdown to 2.5% in the last year. Gross profit expanded 19% year-over-year, improving margins despite rising costs. Net income declined 13% over the full period, pressured by margin contractions, though net margin stabilized recently. Operating expenses trended slightly higher alongside revenue growth.
Is the Income Statement Favorable?
In 2025, fundamentals show strength with a 25.7% gross margin and 11.6% EBIT margin, both favorable versus industry norms. Interest expense remains well-controlled at 2.7% of revenue, supporting a 7.4% net margin. EPS rose 8.4% year-over-year, reflecting operational efficiency. Overall, the income statement displays a favorable profile, balancing moderate revenue growth with solid profitability.
Financial Ratios
The following table summarizes key financial ratios for L3Harris Technologies, Inc. over recent fiscal years:
| Ratios | 2021 | 2022 | 2023 | 2024 | 2025 |
|---|---|---|---|---|---|
| Net Margin | 10.36% | 6.22% | 6.32% | 7.04% | 7.35% |
| ROE | 9.61% | 5.73% | 6.54% | 7.70% | 8.18% |
| ROIC | 5.95% | 3.29% | 5.55% | 5.46% | 5.37% |
| P/E | 23.25 | 37.60 | 32.55 | 26.51 | 35.53 |
| P/B | 2.23 | 2.16 | 2.13 | 2.04 | 2.91 |
| Current Ratio | 1.40 | 1.17 | 0.99 | 1.08 | 1.19 |
| Quick Ratio | 1.18 | 0.95 | 0.80 | 0.90 | 1.02 |
| D/E | 0.41 | 0.42 | 0.74 | 0.67 | 0.53 |
| Debt-to-Assets | 22.56% | 23.23% | 33.46% | 30.90% | 25.35% |
| Interest Coverage | 8.39 | 4.04 | 3.73 | 3.05 | 3.68 |
| Asset Turnover | 0.51 | 0.51 | 0.47 | 0.51 | 0.53 |
| Fixed Asset Turnover | 6.21 | 5.97 | 5.39 | 7.60 | 8.20 |
| Dividend Yield | 1.90% | 2.16% | 2.17% | 2.23% | 1.58% |
Evolution of Financial Ratios
From 2021 to 2025, L3Harris Technologies’ Return on Equity (ROE) declined from 9.61% to 8.18%, indicating weakening profitability. The Current Ratio fluctuated, improving from 0.99 in 2023 to 1.19 in 2025, suggesting better short-term liquidity. Debt-to-Equity ratio saw a gradual decrease from 0.74 in 2023 to 0.53 in 2025, reflecting a modest deleveraging trend.
Are the Financial Ratios Favorable?
In 2025, profitability shows mixed signals: net margin is neutral at 7.35%, but ROE is unfavorable at 8.18%, below the typical 10% benchmark. Liquidity ratios are generally positive, with a current ratio of 1.19 (neutral) and a quick ratio of 1.02 (favorable). Leverage measures are mostly favorable or neutral, including a debt-to-assets ratio of 25.35%. Market valuation appears stretched, with a price-to-earnings ratio of 35.53 marked unfavorable. Overall, the financial ratios are slightly favorable.
Shareholder Return Policy
L3Harris Technologies maintains a dividend payout ratio near 56%, with a steady dividend per share rising to $4.82 in 2025. The annual dividend yield hovers around 1.58%, supported by free cash flow coverage and moderate share buybacks.
This balanced distribution aligns with sustainable shareholder value, avoiding excessive repurchases or unsustainable dividends. The policy reflects prudent capital allocation, blending income return and reinvestment for long-term growth.
Score analysis
The following radar chart presents a snapshot of key valuation and financial performance scores for L3Harris Technologies, Inc.:
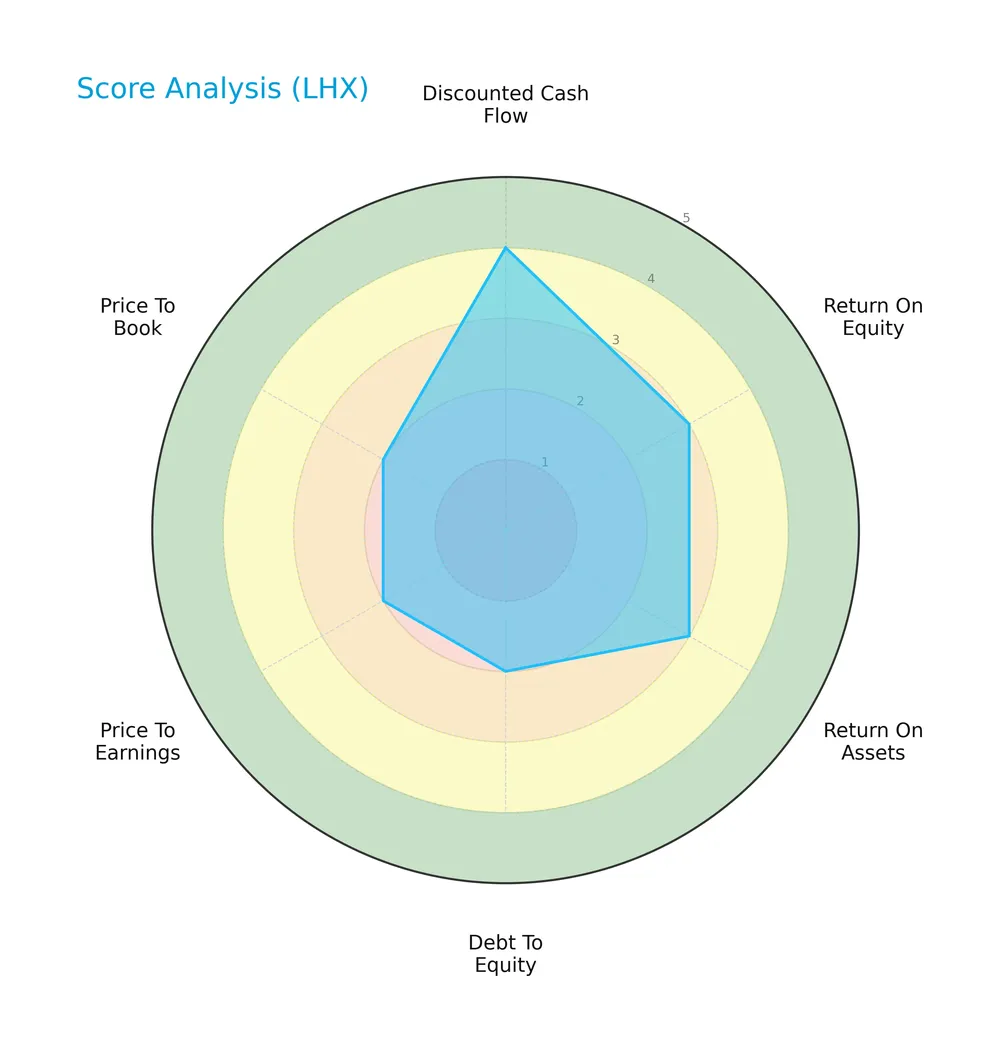
LHX shows a favorable discounted cash flow score of 4, indicating solid intrinsic value. Return on equity and assets are moderate at 3 each. However, debt-to-equity, price-to-earnings, and price-to-book scores are unfavorable at 2, signaling valuation and leverage concerns.
Analysis of the company’s bankruptcy risk
The Altman Z-Score places LHX in the grey zone, reflecting a moderate risk of financial distress and bankruptcy:

Is the company in good financial health?
The Piotroski Score diagram highlights the company’s strong financial health, scoring a very strong 9 out of 9:
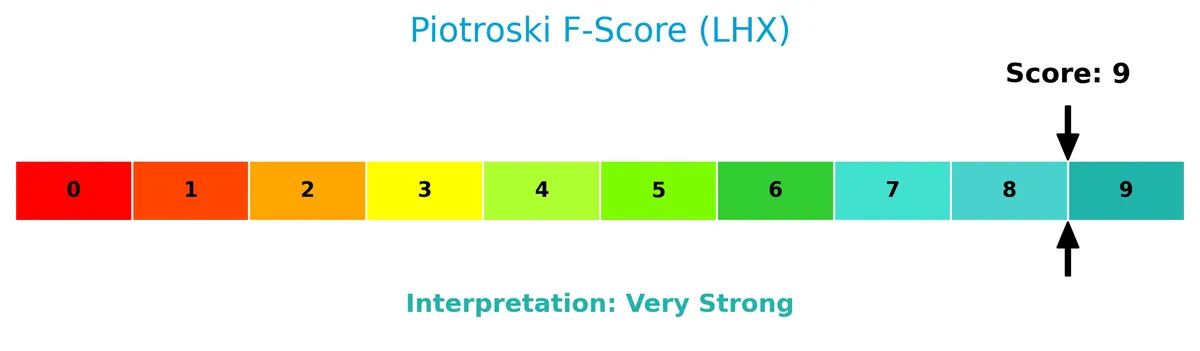
A top Piotroski Score of 9 suggests excellent profitability, liquidity, and operational efficiency, supporting the view of robust financial strength.
Competitive Landscape & Sector Positioning
This sector analysis explores L3Harris Technologies’ strategic positioning, revenue segments, and key products. I will assess whether L3Harris holds a competitive advantage over its main industry rivals.
Strategic Positioning
L3Harris Technologies maintains a diversified aerospace and defense portfolio across four segments, with FY 2025 revenues spanning $2.8B to $6.9B. Geographic exposure includes significant domestic sales, notably $2B in Communication Systems. This mix balances mission-critical government and commercial solutions globally.
Revenue by Segment
The pie chart illustrates L3Harris Technologies, Inc.’s revenue distribution by segment for fiscal year 2025, highlighting key contributors to the company’s total sales.
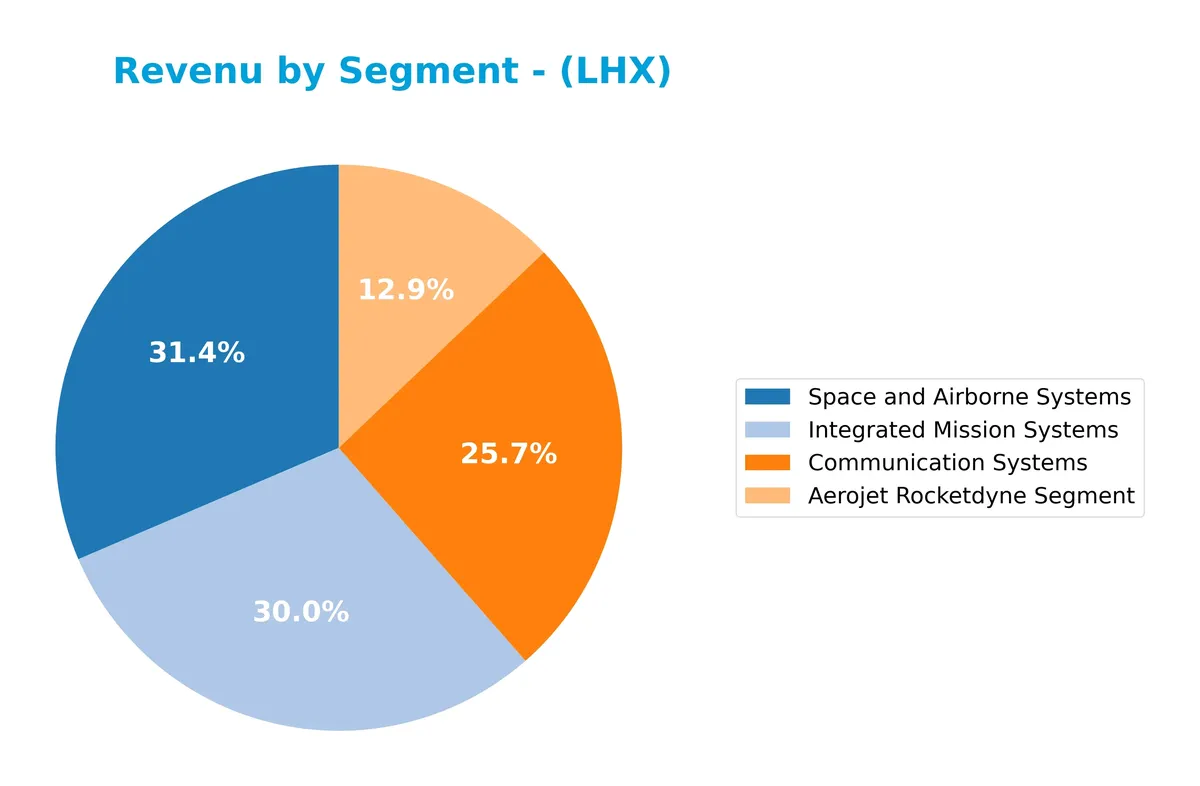
In 2025, Space and Airborne Systems leads with $6.95B, closely followed by Integrated Mission Systems at $6.63B. Communication Systems grew to $5.67B, showing steady momentum. Aerojet Rocketdyne, at $2.85B, significantly rebounded from prior years. This diversification reduces concentration risk, with all segments contributing robustly, indicating balanced growth across LHX’s portfolio.
Key Products & Brands
The following table outlines L3Harris Technologies’ core products and brands by segment and their primary functions:
| Product | Description |
|---|---|
| Aerojet Rocketdyne Segment | Provides rocket propulsion systems and energetics for space and defense applications. |
| Communication Systems | Offers tactical communications, broadband secured mobile networks, and SATCOM equipment. |
| Integrated Mission Systems | Delivers multi-mission ISR systems, sensor development, and maritime mission systems. |
| Space and Airborne Systems | Supplies space payloads, sensors, cyber defense, avionics, and electronic warfare systems. |
L3Harris’ product portfolio spans aerospace propulsion, advanced communications, ISR, and space technologies. These segments address critical defense and government mission needs worldwide.
Main Competitors
There are 12 competitors in the Aerospace & Defense industry; the table lists the top 10 leaders by market capitalization:
| Competitor | Market Cap. |
|---|---|
| GE Aerospace | 338B |
| RTX Corporation | 251B |
| The Boeing Company | 171B |
| Lockheed Martin Corporation | 116B |
| General Dynamics Corporation | 93B |
| Northrop Grumman Corporation | 84B |
| TransDigm Group Incorporated | 77B |
| L3Harris Technologies, Inc. | 57B |
| Axon Enterprise, Inc. | 44B |
| BWX Technologies, Inc. | 17B |
L3Harris Technologies ranks 8th among its peers. Its market cap stands at 19.11% of the leader, GE Aerospace. The company is below both the average market cap of the top 10 (125B) and the sector median (80B). It maintains an 18.36% gap from the next closest competitor above.
Comparisons with competitors
Check out how we compare the company to its competitors:
Does L3Harris Technologies, Inc. have a competitive advantage?
L3Harris Technologies currently does not demonstrate a competitive advantage. Its return on invested capital (ROIC) trails its weighted average cost of capital (WACC) by over 1%, indicating value destruction and declining profitability over 2021-2025.
Looking ahead, L3Harris focuses on expanding its aerospace and defense technology offerings, including advancements in ISR systems, tactical communications, and autonomous maritime solutions. These initiatives target growth in government and commercial markets but will require efficient capital allocation to reverse current value erosion.
SWOT Analysis
This SWOT analysis highlights L3Harris Technologies’ core strategic position and market challenges.
Strengths
- strong defense sector presence
- diversified product segments
- solid cash flow generation
Weaknesses
- declining ROIC versus WACC
- moderate revenue growth recently
- relatively high valuation multiples
Opportunities
- growing demand for ISR and cyber defense
- expanding commercial aerospace markets
- increasing government defense budgets
Threats
- intense competition in aerospace & defense
- geopolitical risks affecting contracts
- technology obsolescence risks
L3Harris benefits from a robust defense niche and diversified offerings but faces value erosion and growth headwinds. The firm must leverage rising defense spending while mitigating valuation and competitive pressures.
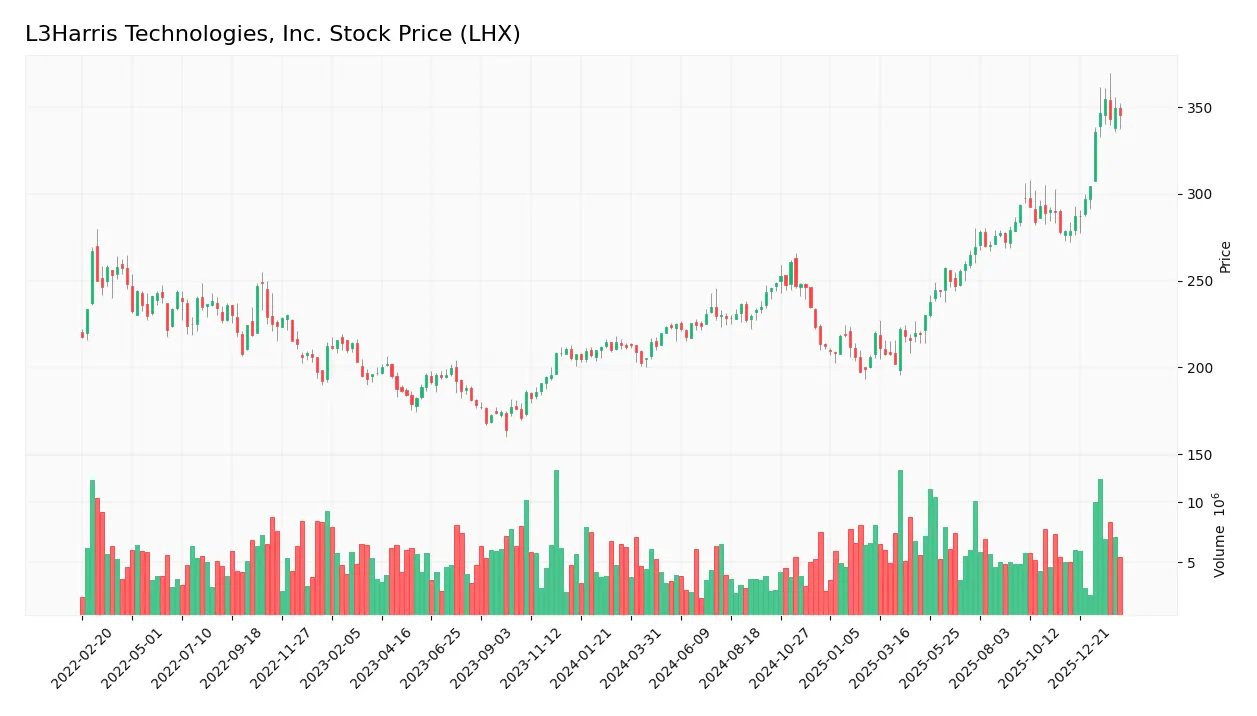
Stock Price Action Analysis
The weekly stock chart illustrates L3Harris Technologies, Inc.’s price movements over the past 100 weeks, highlighting key highs and lows:
Trend Analysis
Over the past 100 weeks, LHX’s stock gained 63.02%, confirming a bullish trend with clear acceleration. The price ranged from a low of 197.61 to a peak of 354.73. Volatility remains elevated, reflected by a 37.57 standard deviation, signaling significant price swings.
Volume Analysis
Trading volume shows an increasing trend, with buyers dominating 56.37% of total activity. Recent three-month data confirms strong buyer dominance at 75.55%, indicating heightened investor confidence and robust market participation.
Target Prices
Analysts set a solid target consensus for L3Harris Technologies, reflecting confidence in its growth potential.
| Target Low | Target High | Consensus |
|---|---|---|
| 323 | 367 | 352.25 |
The target range suggests moderate upside from current levels, signaling positive analyst sentiment on LHX’s strategic positioning and execution.

Don’t Let Luck Decide Your Entry Point
Optimize your entry points with our advanced ProRealTime indicators. You’ll get efficient buy signals with precise price targets for maximum performance. Start outperforming now!
Analyst & Consumer Opinions
This section examines the latest analyst ratings and consumer feedback regarding L3Harris Technologies, Inc. (LHX).
Stock Grades
Here are the latest verified analyst grades for L3Harris Technologies, Inc., reflecting recent actions and recommendations:
| Grading Company | Action | New Grade | Date |
|---|---|---|---|
| Citigroup | Maintain | Buy | 2026-02-05 |
| JP Morgan | Maintain | Overweight | 2026-02-05 |
| Morgan Stanley | Maintain | Overweight | 2026-02-02 |
| RBC Capital | Maintain | Sector Perform | 2026-01-30 |
| UBS | Maintain | Neutral | 2026-01-15 |
| RBC Capital | Maintain | Sector Perform | 2026-01-14 |
| Citigroup | Maintain | Buy | 2026-01-13 |
| Morgan Stanley | Upgrade | Overweight | 2025-12-16 |
| JP Morgan | Maintain | Overweight | 2025-11-04 |
| UBS | Maintain | Neutral | 2025-10-31 |
The consensus leans toward a “Buy” rating with most firms maintaining positive or neutral stances. Morgan Stanley notably upgraded from Equal Weight to Overweight, indicating growing confidence in the stock.
Consumer Opinions
Consumers express a mixed but insightful view of L3Harris Technologies, reflecting its market position and operational challenges.
| Positive Reviews | Negative Reviews |
|---|---|
| Reliable product quality and advanced technology. | Customer service response times are slow. |
| Strong innovation in defense solutions. | High pricing compared to competitors. |
| Consistent performance in critical applications. | Limited transparency on sustainability efforts. |
Overall, consumers praise L3Harris for its technological edge and product reliability. However, concerns about customer service and pricing recur, indicating areas for improvement to enhance user experience.
Risk Analysis
Key risks for L3Harris Technologies, Inc. include financial leverage, valuation multiples, and industry cyclicality:
| Category | Description | Probability | Impact |
|---|---|---|---|
| Financial Leverage | Debt to equity ratio is moderate but flagged as unfavorable, indicating potential balance sheet risk. | Medium | Medium |
| Valuation | High P/E of 35.5 suggests possible overvaluation versus aerospace peers and S&P 500 benchmarks. | High | High |
| Industry Cyclicality | Aerospace & defense sector faces government budget volatility and geopolitical tensions. | Medium | High |
| Liquidity | Current ratio at 1.19 is neutral but near caution threshold for short-term obligations. | Low | Medium |
| Operational Risk | Dependence on government contracts heightens exposure to regulatory and policy changes. | Medium | High |
The most pressing risk is valuation stretched beyond peers, increasing downside if defense budgets tighten or growth slows. Debt levels warrant monitoring but remain manageable. The company’s strong Piotroski score signals financial resilience despite a grey zone Altman Z-Score, underscoring moderate bankruptcy risk.
Should You Buy L3Harris Technologies, Inc.?
L3Harris appears to be a moderately profitable company with a deteriorating competitive moat, as declining ROIC suggests value destruction. Despite a manageable leverage profile, valuation metrics seem unfavorable. Overall, its investment rating could be seen as a cautious B.
Strength & Efficiency Pillars
L3Harris Technologies, Inc. posts solid operational margins with a gross margin of 25.73% and an EBIT margin of 11.57%, signaling operational discipline. The net margin stands at a moderate 7.35%, while the return on invested capital (ROIC) at 5.37% slightly trails the weighted average cost of capital (WACC) of 6.41%. Although ROIC falls short of WACC, indicating value erosion, the company maintains a strong Piotroski score of 9, reflecting robust financial strength across profitability and efficiency metrics.
Weaknesses and Drawbacks
The firm operates in the Altman Z-Score grey zone with a score of 2.69, suggesting moderate bankruptcy risk and warranting caution. Valuation is stretched, with a high price-to-earnings ratio of 35.53, implying premium pricing that may limit upside. Debt-to-equity stands at 0.53, which is moderate but paired with a current ratio of 1.19, this points to only marginal liquidity cushion. Investors should be wary of these financial leverage and valuation pressures amid uncertain macro conditions.
Our Final Verdict about L3Harris Technologies, Inc.
L3Harris presents a fundamentally mixed profile. Despite operational efficiency and strong financial health signals from the Piotroski score, the grey zone Altman Z-Score and elevated valuation metrics suggest moderate risk. The bullish overall stock trend and strong buyer dominance support potential upside, but recent liquidity and leverage caution imply a wait-and-see approach might be prudent before committing capital.
Disclaimer: This content is for informational purposes only and does not constitute financial, investment, or other professional advice. Investing in financial markets involves a significant risk of loss, and past performance is not indicative of future results.
Additional Resources
- Is L3Harris Technologies Inc Gaining or Losing Market Support? – Sahm (Feb 13, 2026)
- Freemont Management S.A. Sells 35,300 Shares of L3Harris Technologies Inc $LHX – MarketBeat (Feb 13, 2026)
- L3Harris Technologies, Inc. (LHX) Backlog Growth Drives Higher Price View at Bernstein – Yahoo Finance (Feb 09, 2026)
- Decoding L3Harris Technologies Inc (LHX): A Strategic SWOT Insig – GuruFocus (Feb 13, 2026)
- L3Harris Technologies (LHX) Releases Q4 2025 Earnings: Revenue Growth but EPS Falls Amid Strong Cash Generation – Quiver Quantitative (Feb 12, 2026)
For more information about L3Harris Technologies, Inc., please visit the official website: l3harris.com