Home > Analyses > Technology > KLA Corporation
KLA Corporation drives the semiconductor industry forward by delivering cutting-edge process control and yield management solutions that underpin modern electronics. Renowned for its precision inspection and metrology technologies, KLA’s innovations play a crucial role in enhancing chip manufacturing quality and efficiency worldwide. As a dominant player with a strong market presence and relentless innovation, the key question for investors in 2026 is whether KLA’s solid fundamentals continue to support its premium valuation and promising growth trajectory.
Table of contents
Business Model & Company Overview
KLA Corporation, founded in 1975 and headquartered in Milpitas, California, stands as a dominant player in the semiconductor industry. Its core mission revolves around delivering a comprehensive ecosystem of process control, inspection, metrology, and yield management solutions that span integrated circuits, specialty semiconductors, PCBs, and display markets. This integrated approach enables KLA to serve as a critical partner to semiconductor manufacturers worldwide.
The company’s revenue engine balances advanced hardware—such as wafer inspection and defect metrology systems—with sophisticated software that drives real-time process control and defect analysis. KLA’s global footprint spans the Americas, Europe, and Asia, positioning it to capitalize on the diverse demands of semiconductor manufacturing hubs. Its competitive advantage is reinforced by a robust portfolio that shapes industry standards and fosters long-term customer loyalty.
Financial Performance & Fundamental Metrics
This section provides a fundamental analysis of KLA Corporation, focusing on its income statement, key financial ratios, and dividend payout policy.
Income Statement
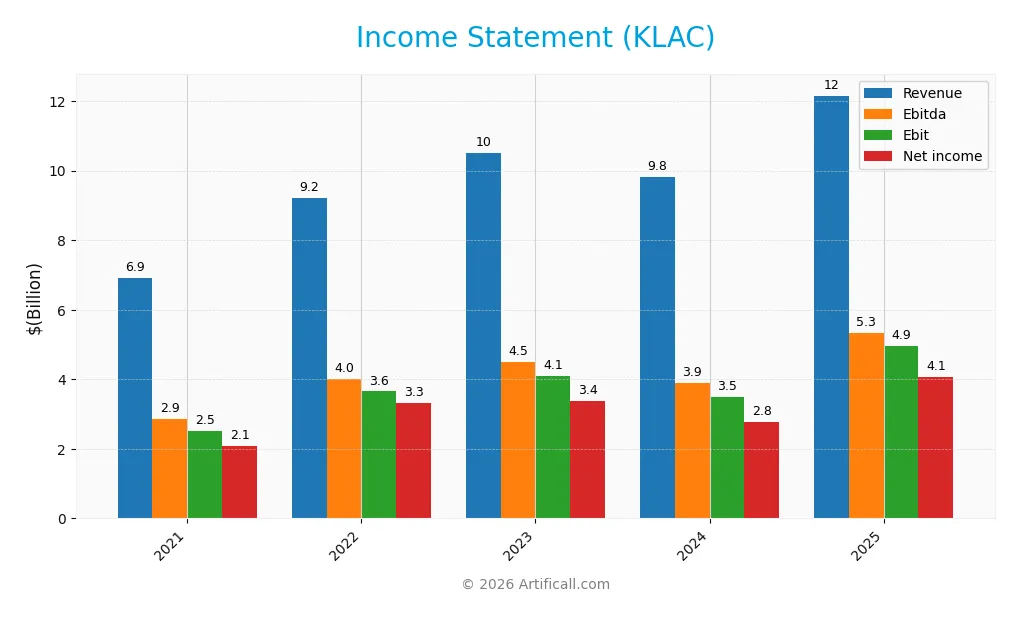
The table below presents KLA Corporation’s income statement highlights for fiscal years 2021 through 2025 in USD.
| 2021 | 2022 | 2023 | 2024 | 2025 | |
|---|---|---|---|---|---|
| Revenue | 6.9B | 9.2B | 10.5B | 9.8B | 12.2B |
| Cost of Revenue | 2.8B | 3.6B | 4.2B | 3.9B | 4.6B |
| Operating Expenses | 1.7B | 2.0B | 2.3B | 2.2B | 2.3B |
| Gross Profit | 4.1B | 5.6B | 6.3B | 5.9B | 7.6B |
| EBITDA | 2.9B | 4.0B | 4.5B | 3.9B | 5.3B |
| EBIT | 2.5B | 3.6B | 4.1B | 3.5B | 4.9B |
| Interest Expense | 157M | 160M | 297M | 311M | 302M |
| Net Income | 2.1B | 3.3B | 3.4B | 2.8B | 4.1B |
| EPS | 13.49 | 22.07 | 24.28 | 20.41 | 30.53 |
| Filing Date | 2021-08-06 | 2022-08-05 | 2023-08-04 | 2024-08-05 | 2025-08-08 |
Income Statement Evolution
KLA Corporation’s revenue showed strong growth from 6.9B in 2021 to 12.2B in 2025, a 75.7% increase over five years, with a notable 23.9% rise in the last year. Net income nearly doubled, growing 95.4% overall and 18.7% in the latest year. Margins improved steadily, with the net margin reaching 33.4% and the EBIT margin at 40.7%, reflecting operational efficiency gains.
Is the Income Statement Favorable?
The 2025 income statement reveals robust fundamentals, with revenue at 12.2B and net income at 4.1B. Gross margin stands favorably at 62.3%, supported by stable cost management. Operating expenses grew proportionally with revenue, preserving margin strength. Interest expense remains low at 2.5% of revenue. Overall, all key profitability and growth metrics are favorable, indicating a financially strong and well-managed business.
Financial Ratios
The table below presents key financial ratios for KLA Corporation (KLAC) over the fiscal years 2021 to 2025, offering insights into profitability, liquidity, leverage, and valuation metrics:
| Ratios | 2021 | 2022 | 2023 | 2024 | 2025 |
|---|---|---|---|---|---|
| Net Margin | 30% | 36% | 32% | 28% | 33% |
| ROE | 62% | 237% | 116% | 82% | 87% |
| ROIC | 27% | 36% | 34% | 27% | 38% |
| P/E | 24.0 | 14.5 | 20.0 | 40.6 | 29.3 |
| P/B | 14.8 | 34.3 | 23.2 | 33.3 | 25.4 |
| Current Ratio | 2.71 | 2.50 | 2.24 | 2.15 | 2.62 |
| Quick Ratio | 1.96 | 1.75 | 1.47 | 1.50 | 1.83 |
| D/E | 1.05 | 4.83 | 2.08 | 2.02 | 1.30 |
| Debt-to-Assets | 35% | 54% | 43% | 44% | 38% |
| Interest Coverage | 15.8 | 22.8 | 13.5 | 11.7 | 17.3 |
| Asset Turnover | 0.67 | 0.73 | 0.75 | 0.64 | 0.76 |
| Fixed Asset Turnover | 9.03 | 9.43 | 8.46 | 7.31 | 9.70 |
| Dividend Yield | 1.12% | 1.33% | 1.08% | 0.69% | 0.76% |
Evolution of Financial Ratios
From 2021 to 2025, KLA Corporation’s Return on Equity (ROE) showed a significant upward trend, reaching an exceptionally high 86.56% in 2025, indicating improved profitability. The Current Ratio increased steadily from 2.71 to 2.62 in 2025, showing consistent liquidity strength. Conversely, the Debt-to-Equity Ratio fluctuated, peaking above 4.8 in 2022 and declining to 1.3 by 2025, reflecting reduced reliance on debt financing.
Are the Financial Ratios Favorable?
In 2025, profitability metrics such as net margin (33.41%) and ROE (86.56%) were favorable, supported by strong returns on invested capital. Liquidity ratios including current (2.62) and quick ratios (1.83) were also positive, indicating solid short-term financial health. However, leverage remains a concern with an unfavorable debt-to-equity ratio of 1.3 and a weighted average cost of capital above 10%. Market valuation metrics like price-to-earnings (29.34) and price-to-book (25.39) ratios appear elevated, while asset turnover is neutral at 0.76, resulting in an overall slightly favorable assessment.
Shareholder Return Policy
KLA Corporation consistently pays dividends with a payout ratio around 22-28% and a modest yield near 0.7-1.3%. Dividend per share has steadily increased from $3.63 in 2021 to $6.80 in 2025, supported by strong free cash flow coverage above 90%. The company also engages in share buybacks, reinforcing capital return.
The balanced dividend policy, coupled with share repurchases, aligns with sustainable long-term value creation. Coverage ratios indicate distributions are well supported by earnings and cash flow, minimizing risks of unsustainable payouts or excessive leverage.
Score analysis
The radar chart below displays KLA Corporation’s key financial scores for a comprehensive evaluation:
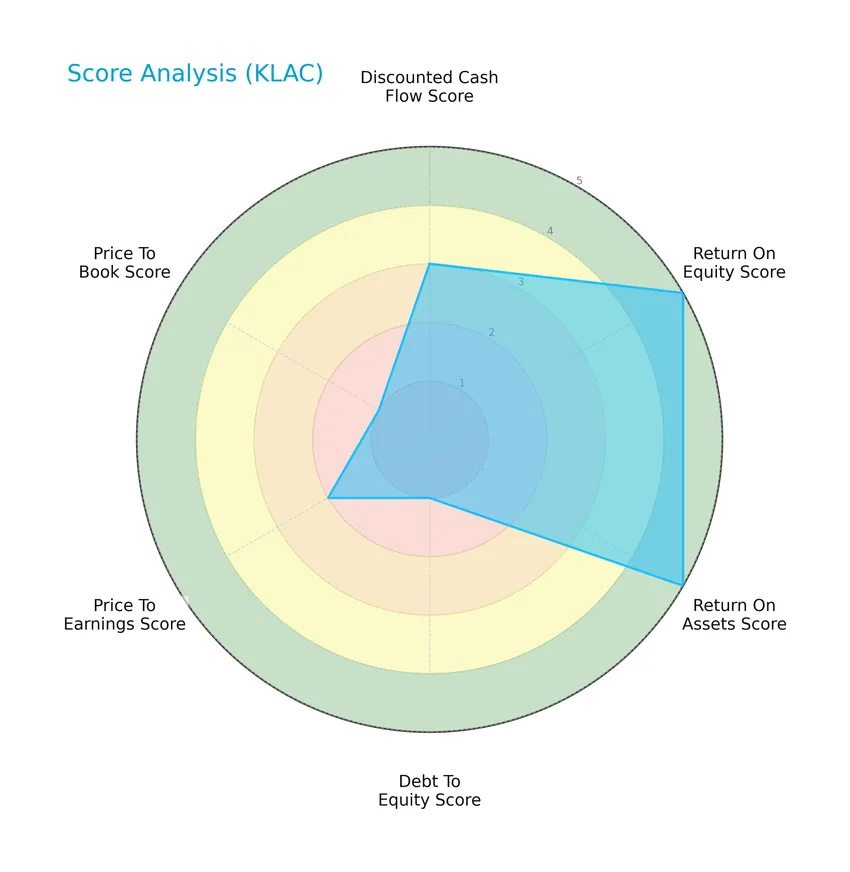
KLA Corporation shows very favorable returns on equity and assets, scoring 5 in both, while its discounted cash flow and price-to-earnings scores are moderate at 3 and 2 respectively. However, debt-to-equity and price-to-book scores are very unfavorable at 1 each, indicating leverage and valuation concerns.
Analysis of the company’s bankruptcy risk
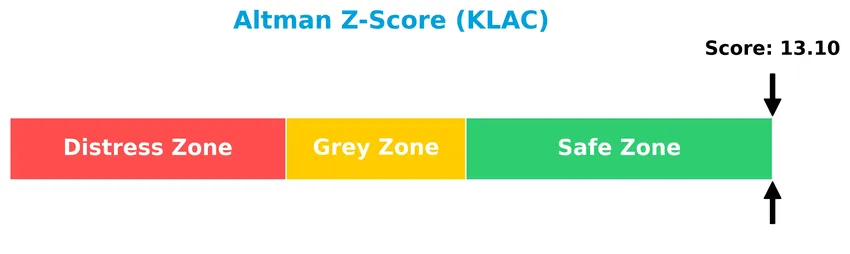
The Altman Z-Score indicates that KLA Corporation is well within the safe zone, suggesting low bankruptcy risk:
Is the company in good financial health?
The Piotroski diagram below presents the company’s financial health based on its Piotroski Score:
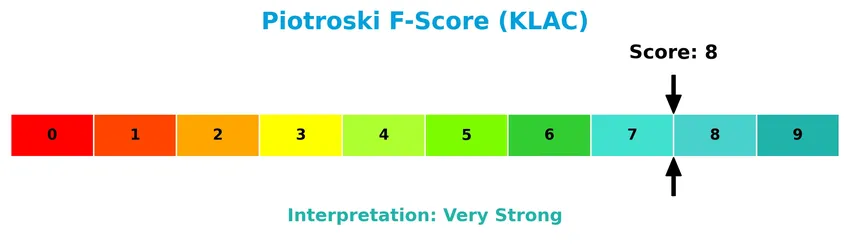
With a Piotroski Score of 8, KLA Corporation demonstrates very strong financial health, reflecting solid profitability, efficiency, and balance sheet strength.
Competitive Landscape & Sector Positioning
This sector analysis will explore KLA Corporation’s strategic positioning, revenue segments, key products, main competitors, and competitive advantages. I will assess whether KLA holds a competitive advantage over its industry peers in the semiconductor process control market.
Strategic Positioning
KLA Corporation maintains a diversified product portfolio spanning defect inspection, patterning, specialty semiconductor processes, PCB and component inspection, and services, with defect inspection and services dominating revenue. Geographically, it exhibits broad exposure, generating significant sales across China (4B), Taiwan (3.2B), Korea (1.45B), Japan (1.13B), and North America (1.36B), reflecting a global footprint focused on key semiconductor markets.
Revenue by Segment
This pie chart illustrates KLA Corporation’s revenue distribution by segment for the fiscal year 2025, highlighting the company’s diverse sources of income across its semiconductor equipment and services.
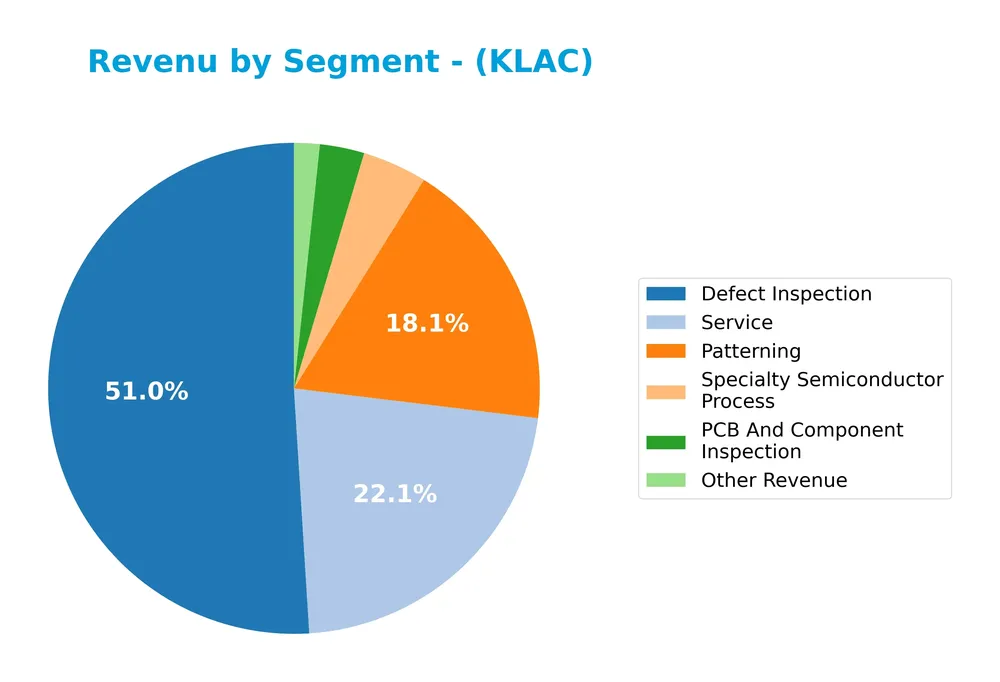
In 2025, Defect Inspection remains the dominant segment, generating $6.2B, showing strong growth compared to previous years. Service revenue also increased significantly to $2.7B, reflecting steady demand for support and maintenance. Patterning and Specialty Semiconductor Process contribute $2.2B and $517M respectively, indicating solid performance in advanced process technologies. PCB And Component Inspection and Other Revenue are smaller but stable contributors. The trend shows a concentration risk around Defect Inspection, although service growth helps balance the portfolio.
Key Products & Brands
The following table presents KLA Corporation’s key products and brands with their descriptions:
| Product | Description |
|---|---|
| Defect Inspection | Systems for wafer, substrate, and reticle defect inspection and metrology in semiconductor manufacturing. |
| Patterning | Technologies and solutions for etch, plasma dicing, deposition, and wafer processing in semiconductor fabrication. |
| Service | Software and support services including run-time process control, defect classification, process corrections, and diagnostics. |
| Specialty Semiconductor Process | Benchtop metrology, surface characterization, electrical property measurement, and wafer processing technologies for semiconductors. |
| PCB And Component Inspection | Direct imaging, inspection, optical shaping, and manufacturing solutions for printed circuit boards and related components. |
| Other Revenue | Additional revenue sources not classified within the main product segments. |
KLA Corporation’s portfolio spans advanced inspection, metrology, patterning, and service solutions critical to semiconductor and electronics manufacturing, supporting yield management and process control worldwide.
Main Competitors
There are 38 competitors in the semiconductor sector, with the top 10 leaders by market capitalization listed below:
| Competitor | Market Cap. |
|---|---|
| NVIDIA Corporation | 4.6T |
| Broadcom Inc. | 1.6T |
| Taiwan Semiconductor Manufacturing Company Limited | 1.6T |
| ASML Holding N.V. | 415B |
| Advanced Micro Devices, Inc. | 363B |
| Micron Technology, Inc. | 353B |
| Lam Research Corporation | 232B |
| Applied Materials, Inc. | 214B |
| QUALCOMM Incorporated | 185B |
| Intel Corporation | 173B |
KLA Corporation ranks 11th among 38 competitors in the semiconductor industry. Its market capitalization is approximately 4.3% of the sector leader, NVIDIA Corporation. KLA is positioned below the average market cap of the top 10 competitors (974.8B) but remains above the median market cap in the sector (30.7B). The company is about 12.9% smaller than its closest competitor above it.
Comparisons with competitors
Check out how we compare the company to its competitors:
Does KLAC have a competitive advantage?
KLA Corporation demonstrates a clear competitive advantage, as evidenced by its very favorable moat status and a ROIC exceeding its WACC by 27.6%, indicating consistent value creation and efficient capital use. The company’s growing ROIC trend of 43.0% over 2021-2025 further underscores its increasing profitability and durable competitive position in the semiconductor industry.
Looking ahead, KLA’s diverse product portfolio across semiconductor process control, specialty manufacturing, and inspection systems positions it well to capitalize on expanding markets and technological advancements. Continued innovation in yield management solutions and geographic revenue growth in Asia and North America suggest multiple opportunities for sustained competitive strength.
SWOT Analysis
This SWOT analysis provides a clear overview of KLA Corporation’s internal strengths and weaknesses, alongside external opportunities and threats, to assist investors in making informed decisions.
Strengths
- strong market position in semiconductor process control
- high profitability with 33.41% net margin
- very favorable ROE of 86.56%
Weaknesses
- high valuation multiples with PE at 29.34 and PB at 25.39
- elevated debt-to-equity ratio of 1.3
- relatively low dividend yield at 0.76%
Opportunities
- growing semiconductor demand globally
- expansion in Asia-Pacific markets, especially Taiwan and Korea
- innovation in advanced inspection and metrology technologies
Threats
- geopolitical tensions impacting supply chains
- intense competition in semiconductor equipment sector
- macroeconomic uncertainties affecting capital expenditure
KLA Corporation exhibits a robust competitive position with strong financial performance and a durable moat, but investors should be cautious about its high valuation and leverage. Strategic focus on innovation and geographic expansion can mitigate risks posed by external market and geopolitical challenges.
Stock Price Action Analysis
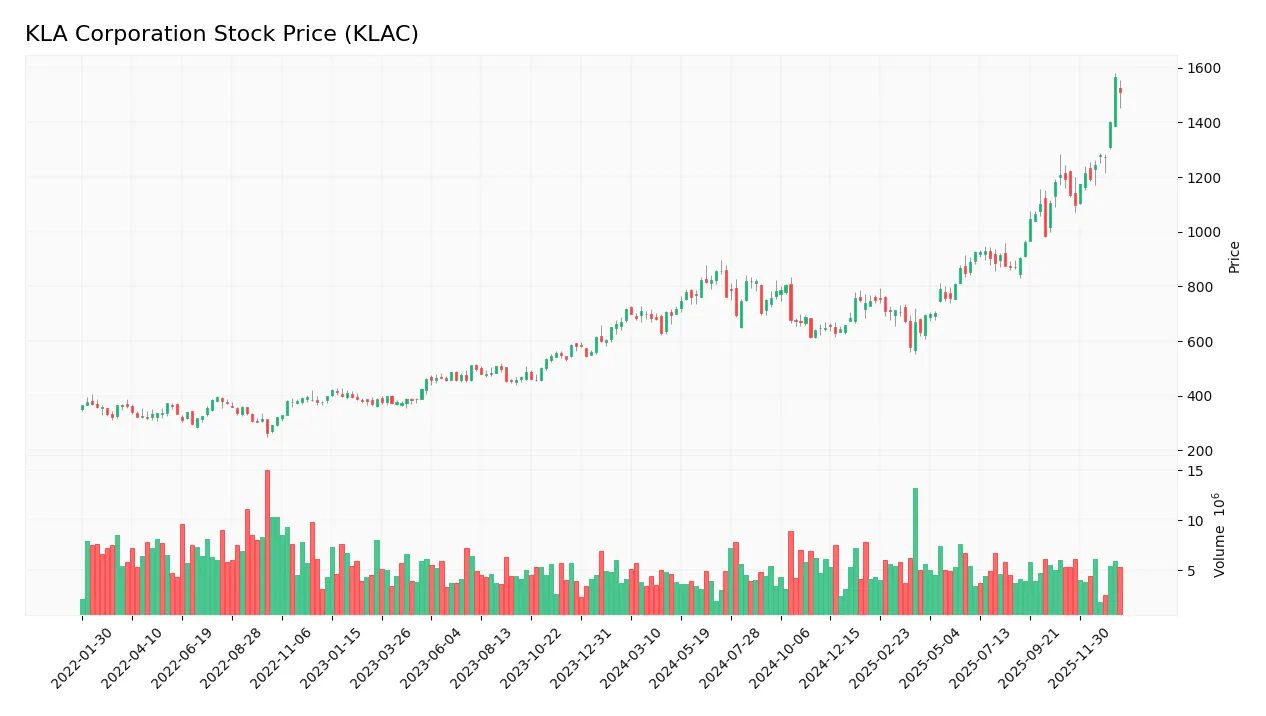
The weekly stock chart of KLA Corporation (KLAC) shows the price movements and trading activity over the past 12 months, highlighting key highs, lows, and volume trends:
Trend Analysis
Over the past 12 months, KLAC’s stock price increased by 110.82%, indicating a strong bullish trend with acceleration. The price ranged from a low of 576.53 to a high of 1567.82, reflecting significant upward momentum. Recent weeks show a 26.77% rise with a trend slope of 35.93, confirming continued strength.
Volume Analysis
Trading volume over the last three months has been increasing, with total volume reaching 59M shares. Buyer volume accounted for 57.22% overall, suggesting buyer-driven activity. However, in the recent period, buyer dominance dropped to 48.39%, indicating a neutral buyer behavior and balanced market participation.
Target Prices
The consensus target prices for KLA Corporation reflect a generally optimistic outlook from analysts.
| Target High | Target Low | Consensus |
|---|---|---|
| 1800 | 1280 | 1577.6 |
Analysts expect KLA’s stock to trade between 1280 and 1800, with a consensus target near 1578, indicating positive growth potential.

Don’t Let Luck Decide Your Entry Point
Optimize your entry points with our advanced ProRealTime indicators. You’ll get efficient buy signals with precise price targets for maximum performance. Start outperforming now!
Analyst & Consumer Opinions
This section reviews the latest analyst ratings and consumer feedback to provide insights on KLA Corporation’s performance.
Stock Grades
Here is the summary of recent verified stock grades for KLA Corporation from reputable financial institutions:
| Grading Company | Action | New Grade | Date |
|---|---|---|---|
| Deutsche Bank | Maintain | Hold | 2026-01-21 |
| UBS | Maintain | Neutral | 2026-01-20 |
| Needham | Maintain | Buy | 2026-01-20 |
| Wells Fargo | Upgrade | Overweight | 2026-01-15 |
| Stifel | Maintain | Buy | 2026-01-14 |
| B of A Securities | Maintain | Buy | 2026-01-13 |
| TD Cowen | Upgrade | Buy | 2026-01-13 |
| Cantor Fitzgerald | Maintain | Overweight | 2026-01-08 |
| Cantor Fitzgerald | Upgrade | Overweight | 2025-12-16 |
| Jefferies | Upgrade | Buy | 2025-12-15 |
The overall trend shows a positive shift with multiple upgrades from Hold to Buy or Overweight, reflecting increasing confidence in KLA Corporation’s prospects. Most recent grades cluster around Buy and Overweight, indicating a consensus leaning toward favorable sentiment.
Consumer Opinions
KLA Corporation enjoys a generally favorable reputation among its user base, reflecting strong product performance and customer service.
| Positive Reviews | Negative Reviews |
|---|---|
| “KLA’s equipment is highly reliable and precise, boosting our production efficiency.” | “Customer support response times can be slow during peak periods.” |
| “The technology KLA offers is cutting-edge, helping us stay competitive.” | “Pricing is on the higher side compared to some competitors.” |
| “Installation and integration were smooth, with clear guidance from their team.” | “Some software updates introduced bugs that delayed workflow.” |
Overall, consumers praise KLA for its advanced technology and reliability, while noting areas for improvement in customer support responsiveness and pricing structure.
Risk Analysis
Below is a concise overview of key risks associated with KLA Corporation, highlighting their probability and potential impact:
| Category | Description | Probability | Impact |
|---|---|---|---|
| Market Valuation | High P/E (29.34) and P/B (25.39) ratios suggest overvaluation risk amid market corrections. | Medium | High |
| Debt Levels | Elevated debt-to-equity ratio (1.3) raises financial leverage concerns despite strong coverage. | Medium | Medium |
| Industry Cyclicality | Semiconductor sector volatility could affect demand and revenue stability for KLA. | High | High |
| Competitive Pressure | Rapid technology changes require continuous innovation to maintain market leadership. | High | Medium |
| Economic Slowdown | Global economic uncertainties may reduce capital spending in electronics manufacturing. | Medium | High |
The most likely and impactful risks for KLA stem from semiconductor industry cyclicality and valuation pressures. Despite a strong Altman Z-Score (13.1) indicating financial safety, investors should watch market fluctuations and debt levels carefully.
Should You Buy KLA Corporation?
KLA Corporation appears to be demonstrating robust profitability supported by a durable competitive moat with growing operational efficiency. Despite a challenging leverage profile reflected in mixed debt ratings, the overall financial health could be seen as solid, warranting a B rating in this analytical interpretation.
Strength & Efficiency Pillars
KLA Corporation exhibits a robust financial profile underscored by a strong profitability framework. The company reports a net margin of 33.41% and an impressive return on equity (ROE) of 86.56%, reflecting effective capital utilization. Its return on invested capital (ROIC) stands at 38.11%, well above the weighted average cost of capital (WACC) of 10.47%, confirming KLA as a clear value creator. Financial health is solid, with an Altman Z-Score of 13.10 placing it in the safe zone, and a Piotroski Score of 8 indicating very strong financial strength. These metrics collectively signal durable competitive advantages and efficient value generation.
Weaknesses and Drawbacks
Despite its strengths, KLA faces notable valuation and leverage concerns. The price-to-earnings (P/E) ratio at 29.34 and price-to-book (P/B) ratio at 25.39 suggest a premium valuation that may temper upside potential. Leverage is elevated with a debt-to-equity ratio of 1.3, which is considered unfavorable, posing risks if interest rates rise or cash flows weaken. While liquidity ratios such as the current ratio (2.62) remain favorable, the high valuation multiples and leverage could introduce vulnerability to market corrections or economic downturns, warranting cautious risk management.
Our Verdict about KLA Corporation
KLA Corporation’s long-term fundamental profile is favorable, driven by strong profitability and financial health metrics. However, recent market dynamics show a slightly seller-dominant environment with buyer dominance near 48.39%, suggesting some short-term caution. Despite the company’s durable value creation and bullish overall trend, this recent market pressure might suggest a wait-and-see approach for investors seeking an optimal entry point. The profile may appear attractive for those with a tolerance for elevated valuation and leverage risk.
Disclaimer: This content is for informational purposes only and does not constitute financial, investment, or other professional advice. Investing in financial markets involves a significant risk of loss, and past performance is not indicative of future results.
Additional Resources
- KLA Corporation (KLAC) Shares Skyrocket, What You Need To Know – Yahoo Finance (Jan 09, 2026)
- Jim Cramer Calls KLA Corporation an “Incredibly Well-Run Company” – Insider Monkey (Jan 22, 2026)
- KLA Corp. in focus as Bernstein starts with Outperform rating (KLAC:NASDAQ) – Seeking Alpha (Jan 14, 2026)
- Analyst Upgrades Spotlight KLA As AI And Foundry Demand Builds – Sahm (Jan 21, 2026)
- Is It Too Late To Consider KLA (KLAC) After Its 101% One Year Surge? – simplywall.st (Jan 22, 2026)
For more information about KLA Corporation, please visit the official website: kla.com