Home > Analyses > Financial Services > KKR & Co. Inc.
KKR & Co. Inc. transforms industries by reshaping capital allocation across global markets. This powerhouse dominates private equity with expertise in leveraged buyouts, real estate, and credit investments. It drives innovation in sectors from technology to energy, blending strategic ownership with deep operational involvement. As the financial landscape evolves, I question whether KKR’s robust fundamentals continue to justify its premium valuation and ambitious growth trajectory.

Table of contents
Business Model & Company Overview
KKR & Co. Inc., founded in 1976 and headquartered in New York City, stands as a dominant force in global asset management. The firm specializes in private equity and real estate investments, weaving a comprehensive ecosystem that spans leveraged buyouts, growth equity, credit special situations, and impact investments. Its reach extends across diverse industries, from technology and energy to consumer products and healthcare, reflecting a strategic commitment to sectoral breadth and depth.
KKR generates value through a balanced revenue engine blending direct investments, fund of funds, and strategic co-investments. Its presence spans the Americas, Europe, and Asia, enabling access to high-growth markets and diversified opportunities. The firm’s ability to secure controlling stakes or influential board positions enhances its capital allocation discipline. This approach cements KKR’s economic moat, positioning it as a pivotal player shaping the future contours of private equity and real estate investing worldwide.
Financial Performance & Fundamental Metrics
I analyze KKR & Co. Inc.’s income statement, key financial ratios, and dividend payout policy to assess its profitability, efficiency, and shareholder returns.
Income Statement
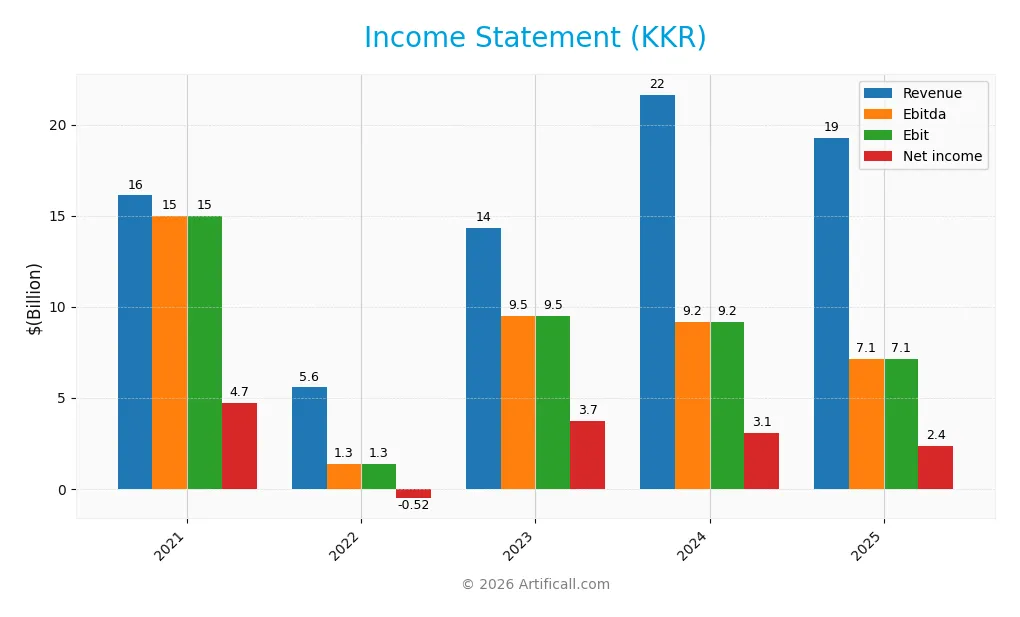
The following table summarizes KKR & Co. Inc.’s key income statement items for fiscal years 2021 through 2025.
| 2021 | 2022 | 2023 | 2024 | 2025 | |
|---|---|---|---|---|---|
| Revenue | 16.1B | 5.6B | 14.3B | 21.6B | 19.3B |
| Cost of Revenue | 9.2B | 3.6B | 9.5B | 17.8B | 11.2B |
| Operating Expenses | 1.9B | 2.4B | 2.7B | 2.9B | 7.6B |
| Gross Profit | 6.9B | 2.0B | 4.9B | 3.8B | 8.1B |
| EBITDA | 15.0B | 1.3B | 9.5B | 9.2B | 7.1B |
| EBIT | 15.0B | 1.3B | 9.5B | 9.2B | 7.1B |
| Interest Expense | 1.1B | 1.6B | 2.9B | 3.3B | 2.3B |
| Net Income | 4.7B | -0.5B | 3.7B | 3.1B | 2.4B |
| EPS | 7.95 | -0.79 | 4.24 | 3.47 | 2.53 |
| Filing Date | 2022-02-28 | 2023-02-27 | 2024-02-29 | 2025-02-28 | 2026-02-27 |
Income Statement Evolution
KKR’s revenue rose 20% from 2021 to 2025 but fell nearly 11% in 2025 alone. Gross profit more than doubled in 2025 versus 2024, reflecting improved cost control. However, EBIT declined 22% in 2025, and net margin contracted over the period, signaling margin pressure despite revenue growth.
Is the Income Statement Favorable?
In 2025, KKR showed a strong gross margin of 41.8% and an EBIT margin near 37%, both favorable by industry standards. Net margin stood at 12.3%, still positive but down from prior years. Interest expenses consumed almost 12% of revenue, a notable headwind. Overall, fundamentals show mixed signals with margin strength offset by shrinking net income and EPS declines.
Financial Ratios
The table below presents key financial ratios for KKR & Co. Inc. over the last five fiscal years, illustrating profitability, valuation, liquidity, leverage, and efficiency trends:
| Ratios | 2021 | 2022 | 2023 | 2024 | 2025 |
|---|---|---|---|---|---|
| Net Margin | 29% | -9% | 26% | 14% | 12% |
| ROE | 27% | -3% | 16% | 13% | 3% |
| ROIC | 2% | -0.1% | 1% | 0.3% | 65% |
| P/E | 9.2x | -66.7x | 19.3x | 42.6x | 47.9x |
| P/B | 2.47x | 1.85x | 3.14x | 5.55x | 1.51x |
| Current Ratio | 1.29 | 1.49 | 4.71 | 4.12 | 0 |
| Quick Ratio | 1.29 | 1.49 | 4.71 | 4.12 | 0 |
| D/E | 2.25 | 2.34 | 2.16 | 2.15 | 0 |
| Debt-to-Assets | 15% | 16% | 16% | 14% | 0 |
| Interest Coverage | 4.38x | -0.21x | 0.73x | 0.28x | 0.20x |
| Asset Turnover | 0.061 | 0.020 | 0.045 | 0.060 | 19.35 |
| Fixed Asset Turnover | 13.3x | 4.04x | 10.3x | 12.2x | 0 |
| Dividend Yield | 0.97% | 1.48% | 0.86% | 0.47% | 0.57% |
Evolution of Financial Ratios
Over the period, KKR’s Return on Equity (ROE) declined from 26.9% in 2021 to 3.14% in 2025, indicating weakening profitability. The Current Ratio fluctuated, peaking above 4.7 in 2023-24 before dropping to zero in 2025, signaling liquidity concerns. Debt-to-Equity Ratio improved markedly to zero by 2025, reflecting significant deleveraging.
Are the Financial Ratios Fovorable?
KKR’s 2025 profitability shows a modest net margin of 12.3% but an unfavorable ROE below the cost of capital (WACC 12.8%). Liquidity ratios stand at zero, a clear red flag for short-term solvency. Leverage ratios are favorable with no debt, and asset turnover is high at 19.35x, suggesting operational efficiency. Market multiples such as PE (47.9) and dividend yield (0.57%) are unfavorable, producing a slightly unfavorable overall ratio profile.
Shareholder Return Policy
KKR & Co. Inc. maintains a dividend payout ratio around 20-27%, with dividend per share slightly increasing from $0.68 in 2022 to $0.73 in 2025. Dividend yield remains modest, near 0.57% in 2025, supported by moderate free cash flow coverage and ongoing share buyback activity.
The payout aligns with sustainable cash generation given the company’s positive net income and robust operating metrics. However, the relatively low dividend yield and high price-to-free-cash-flow ratio suggest cautious monitoring of capital allocation efficiency and buyback levels is prudent to ensure long-term shareholder value creation.
Score analysis
Here is a comprehensive overview of the company’s key financial scores to assess its valuation and performance metrics:
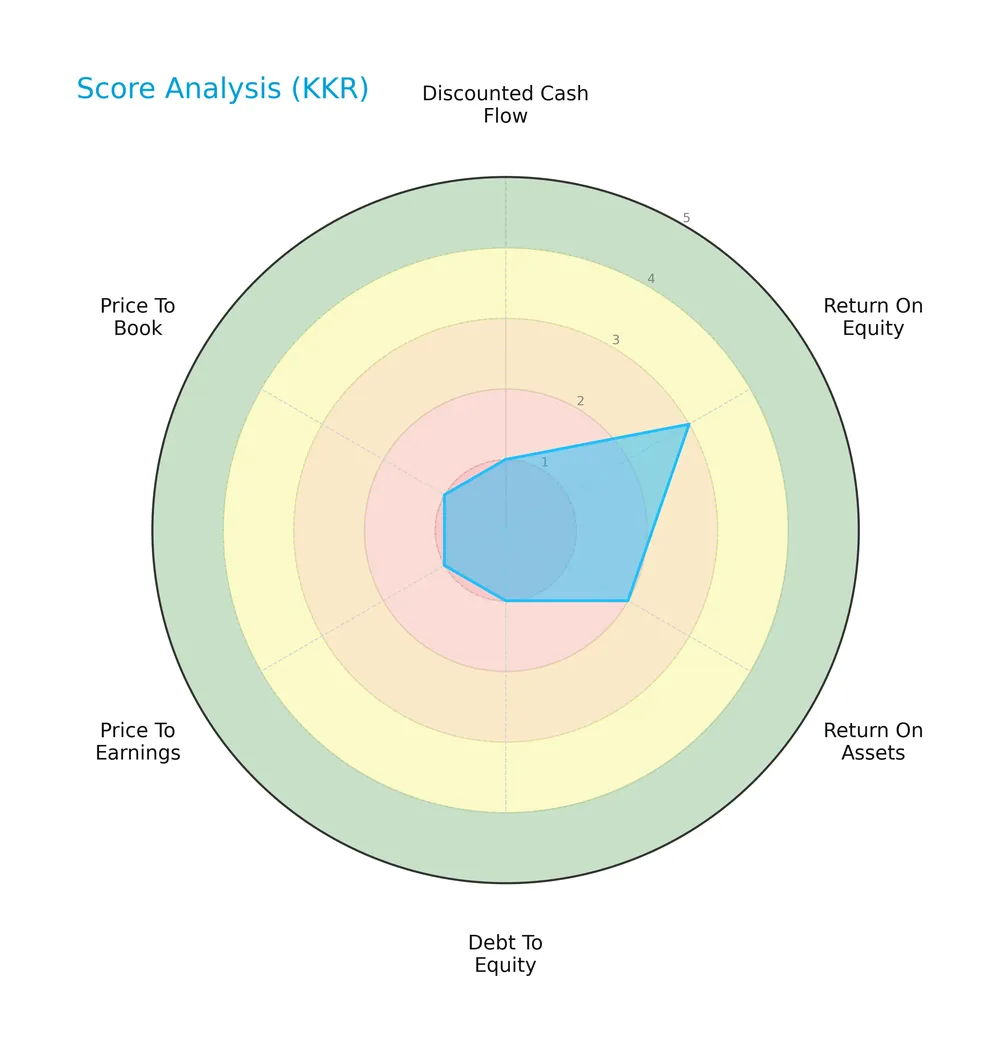
KKR & Co. Inc. shows predominantly very unfavorable scores in discounted cash flow, return on assets, debt to equity, and price to earnings. Return on equity and price to book scores are slightly better but still unfavorable, indicating challenges across most financial metrics.
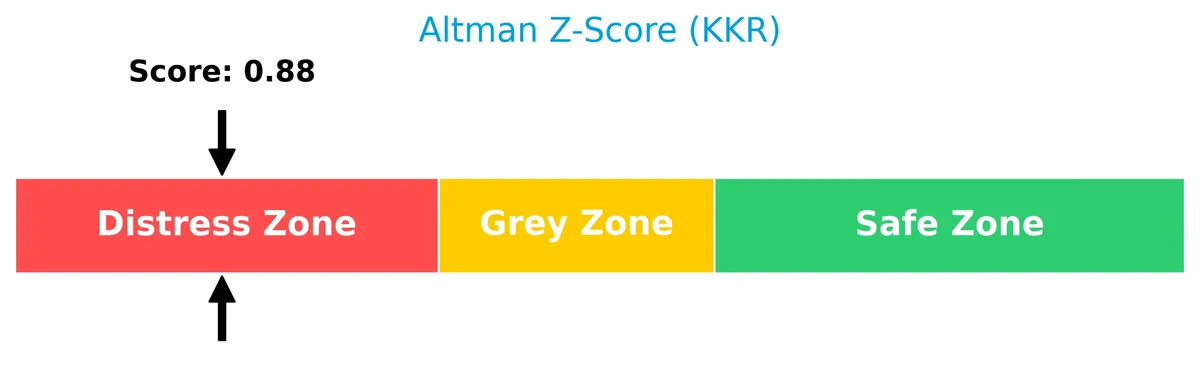
Analysis of the company’s bankruptcy risk
The Altman Z-Score places the company firmly in the safe zone, indicating a very low risk of bankruptcy based on its financial health:
Is the company in good financial health?
This Piotroski Score diagram highlights the company’s financial strength and operational efficiency:

With a score of 7, the company demonstrates strong financial health, reflecting solid profitability, leverage, and liquidity metrics despite some valuation weaknesses.
Competitive Landscape & Sector Positioning
This section examines KKR & Co. Inc.’s strategic positioning, revenue segments, and key products within asset management. I will assess whether KKR holds a competitive advantage over its main competitors.
Strategic Positioning
KKR & Co. Inc. maintains a highly diversified product portfolio across asset management and insurance segments, with significant geographic exposure spanning the Americas, Europe, Asia, and emerging markets. This broad scope underpins its strategy of targeting mid-to-large enterprises across multiple industries globally.
Revenue by Segment
The pie chart illustrates KKR & Co. Inc.’s revenue distribution by segment for fiscal year 2024, highlighting the company’s core business areas.
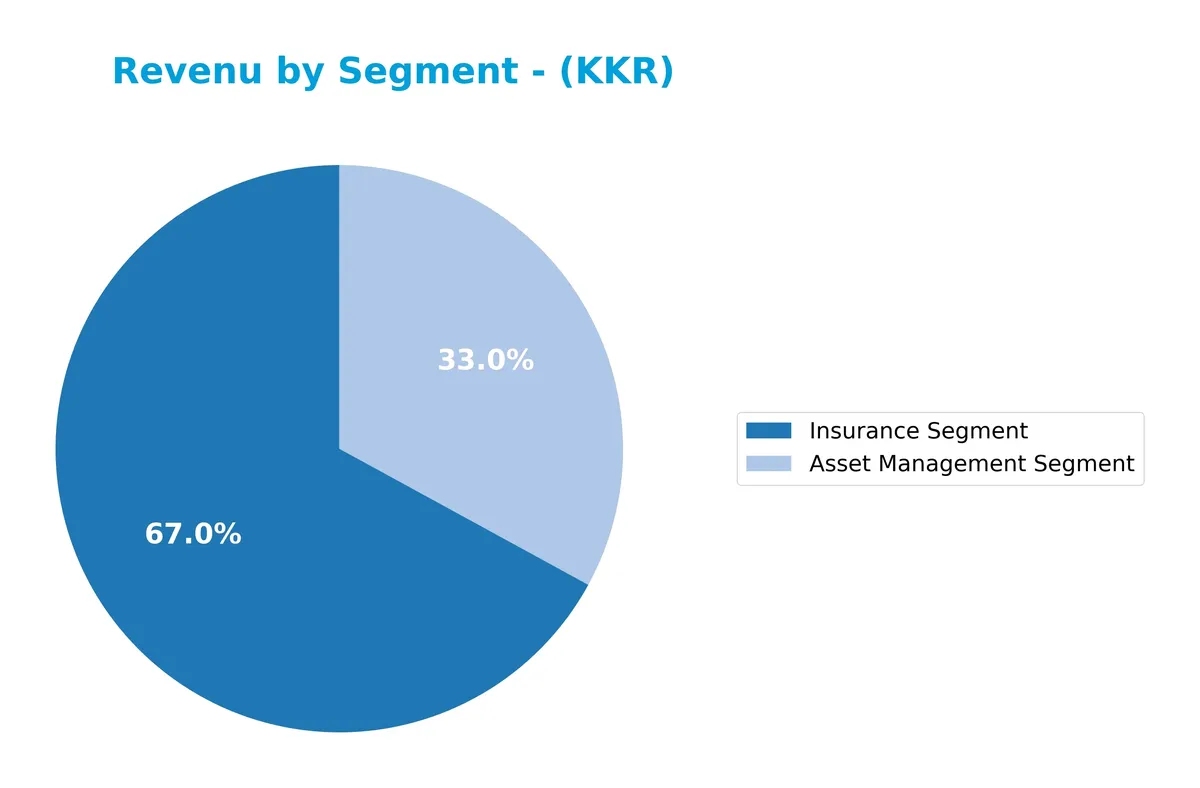
KKR’s Insurance Segment dominates with $14.7B, nearly doubling since 2023, reflecting strong growth and expanding scale. The Asset Management Segment also advanced to $7.2B, up from $5.8B the prior year, signaling solid momentum. These two segments combined drive the business with rising concentration risk in Insurance. Historically, the Insurance segment’s rapid expansion marks a strategic shift, underscoring its growing importance to KKR’s revenue base.
Key Products & Brands
The following table details KKR & Co. Inc.’s primary products and brands by segment and service line:
| Product | Description |
|---|---|
| Asset Management Segment | Investment management services including private equity, growth equity, mezzanine, and real estate investments. |
| Insurance Segment | Insurance operations generating significant revenue within the financial services sector. |
| Carried Interests | Profits earned from successful investments, reflecting KKR’s stake in portfolio companies. |
| Investment Management Fees | Fees charged for managing client investment portfolios across various asset classes. |
| Investment Transaction Fees | Revenues from advisory and execution services related to mergers, acquisitions, and leveraged buyouts. |
| Investment Monitoring Fees | Fees for ongoing oversight and governance of portfolio companies. |
| Investment Consulting Fees | Advisory services related to investment strategy and due diligence. |
| Oil and Gas Revenue | Income derived from energy sector investments including upstream oil and gas operations. |
| Expense Reimbursement | Recovery of costs incurred on behalf of clients or partners. |
| Fee Credit | Adjustments reducing fees, often reflecting rebates or contractual credits. |
| Incentive Fees | Performance-based fees earned when investment returns exceed predefined benchmarks. |
| Transaction Fee | Fees related to capital raising, deal structuring, and other transactional activities. |
| Capital Allocation | Internal allocation of capital aimed at optimizing investment returns and funding portfolio companies. |
KKR’s portfolio spans asset management and insurance with diverse fee structures and revenue streams. The firm leverages its expertise in private equity, real estate, and energy sectors to generate fees and carried interest. This broad product base supports its position in the asset management industry.
Main Competitors
The sector includes 11 competitors; the table below lists the top 10 leaders by market capitalization:
| Competitor | Market Cap. |
|---|---|
| Blackstone Inc. | 191B |
| BlackRock, Inc. | 168B |
| KKR & Co. Inc. | 115B |
| The Bank of New York Mellon Corporation | 82B |
| Ares Management Corporation | 55B |
| Ameriprise Financial, Inc. | 46B |
| State Street Corporation | 36B |
| Northern Trust Corporation | 26B |
| T. Rowe Price Group, Inc. | 23B |
| Franklin Resources, Inc. | 12B |
KKR & Co. Inc. ranks third among its 11 competitors. Its market cap is 41% of Blackstone Inc., the sector leader. KKR stands above both the average market cap of the top 10 competitors (75B) and the median market cap within the sector (46B). It holds a significant 115% market cap gap over the next closest rival, BlackRock, indicating a robust position but clear room to challenge the leaders.
Comparisons with competitors
Check out how we compare the company to its competitors:
Does KKR have a competitive advantage?
KKR demonstrates a strong competitive advantage, evidenced by a very favorable moat rating and a ROIC vastly exceeding its WACC, indicating value creation and efficient capital use. The firm’s diverse investment portfolio across multiple sectors and global markets supports its stable income generation despite recent revenue growth challenges.
Looking ahead, KKR’s focus on emerging markets and impact investments, alongside expansion in technology and infrastructure sectors, positions it to capture new opportunities. Continued emphasis on private equity, real estate, and specialized finance markets underpins its potential to sustain competitive advantages.
SWOT Analysis
This SWOT analysis highlights KKR & Co. Inc.’s key internal and external factors shaping its strategic outlook.
Strengths
- strong global presence
- very favorable moat with growing ROIC
- diversified investment portfolio
Weaknesses
- declining revenue and EPS growth
- unfavorable interest expense ratio
- low ROE compared to industry
Opportunities
- expansion in emerging markets
- growth in impact investing
- leveraging technology sector investments
Threats
- high beta indicating volatility
- intense competition in asset management
- regulatory risks in multiple jurisdictions
KKR’s robust competitive moat and global diversification support long-term value creation. However, recent earnings softness and interest costs require cautious capital allocation. Strategic focus should balance growth opportunities with risk management.
Stock Price Action Analysis
The weekly stock chart for KKR & Co. Inc. illustrates price movement and volatility dynamics over the past 12 months:
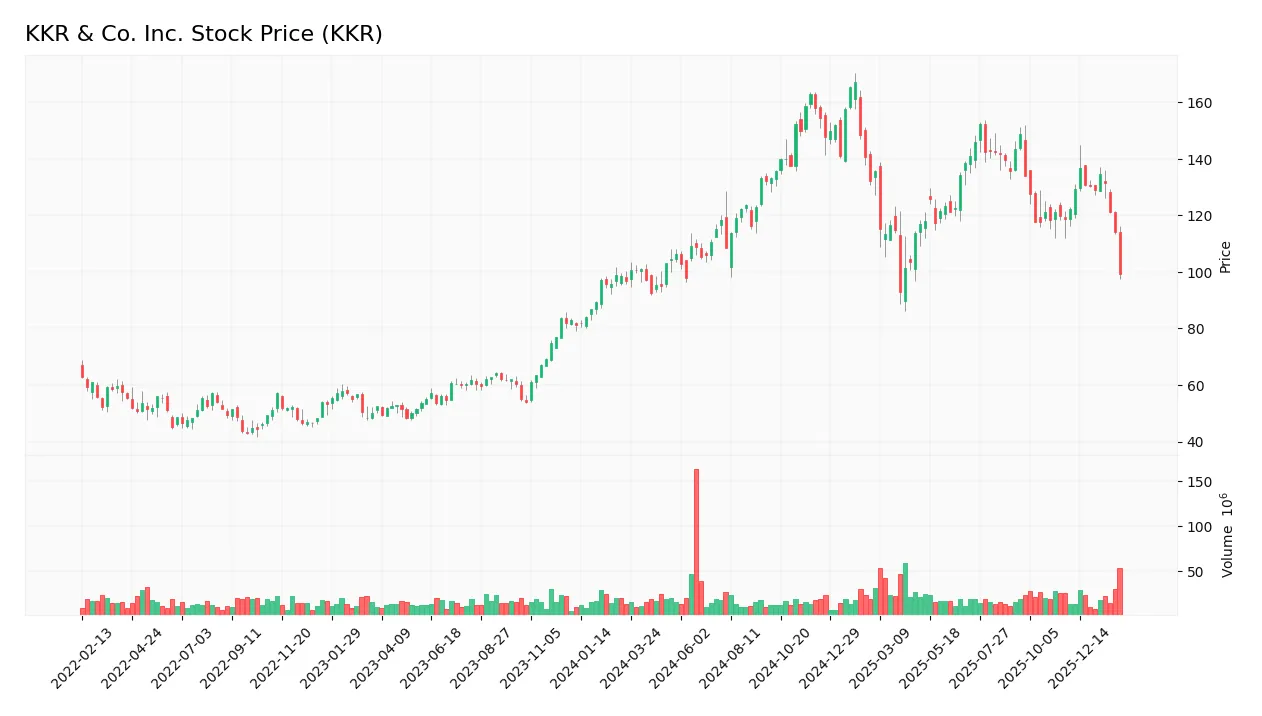
Trend Analysis
KKR’s stock declined by 13.13% over the past year, marking a bearish trend with decelerating downward momentum. The price ranged from a high of 167.07 to a low of 87.68, showing significant volatility at 18.37 standard deviation.
Volume Analysis
Trading volume has increased overall, but seller volume (54%) outpaces buyers (46%), signaling seller dominance. Recent months show intensified selling pressure with buyers comprising only 13% of volume, indicating cautious investor sentiment.
Target Prices
Analysts show a bullish consensus with solid upside potential for KKR & Co. Inc.
| Target Low | Target High | Consensus |
|---|---|---|
| 125 | 187 | 148.25 |
The target range suggests confidence in KKR’s growth, with a consensus price indicating a meaningful premium over current levels.

Don’t Let Luck Decide Your Entry Point
Optimize your entry points with our advanced ProRealTime indicators. You’ll get efficient buy signals with precise price targets for maximum performance. Start outperforming now!
Analyst & Consumer Opinions
This section examines ratings and consumer feedback related to KKR & Co. Inc., providing balanced insights.
Stock Grades
Below is a summary of recent stock grades from reputable financial institutions for KKR & Co. Inc.:
| Grading Company | Action | New Grade | Date |
|---|---|---|---|
| UBS | Maintain | Buy | 2026-02-20 |
| Barclays | Maintain | Overweight | 2026-02-06 |
| Oppenheimer | Maintain | Outperform | 2026-02-06 |
| TD Cowen | Downgrade | Hold | 2026-01-14 |
| UBS | Maintain | Buy | 2026-01-13 |
| Barclays | Maintain | Overweight | 2026-01-09 |
| Barclays | Maintain | Overweight | 2025-12-12 |
| Barclays | Maintain | Overweight | 2025-11-11 |
| Oppenheimer | Maintain | Outperform | 2025-11-10 |
| TD Cowen | Maintain | Buy | 2025-11-10 |
The overall grading trend for KKR remains positive, with most firms maintaining Buy or equivalent ratings. TD Cowen’s recent downgrade to Hold stands out as a conservative signal amid otherwise stable optimism.
Consumer Opinions
KKR & Co. Inc. elicits mixed but insightful feedback from its consumer base, reflecting its complex role in private equity and asset management.
| Positive Reviews | Negative Reviews |
|---|---|
| Strong track record in generating returns. | High fees reduce net gains for smaller investors. |
| Transparent communication with stakeholders. | Limited accessibility for retail investors. |
| Innovative investment strategies. | Occasionally slower response times to inquiries. |
Overall, consumers praise KKR’s robust returns and strategic innovation. However, concerns about fees and investor accessibility persist, signaling areas for improvement in client engagement and cost structure.
Risk Analysis
Below is a summary table of key risks associated with KKR & Co. Inc., highlighting their likelihood and potential impact:
| Category | Description | Probability | Impact |
|---|---|---|---|
| Market Volatility | High beta (1.97) indicates sensitivity to market swings, increasing share price volatility. | High | High |
| Liquidity Risk | Current and quick ratios are zero, signaling potential short-term liquidity constraints. | Medium | High |
| Valuation Risk | Elevated P/E of 47.88 suggests overvaluation compared to sector and market benchmarks. | Medium | Medium |
| Leverage Risk | Favorable debt-to-equity and debt-to-assets ratios reduce financial leverage concerns. | Low | Low |
| Profitability Risk | Low ROE (3.14%) despite strong ROIC implies inefficient equity use, pressuring returns. | Medium | Medium |
| Dividend Yield Risk | Low dividend yield (0.57%) may deter income-focused investors amid market uncertainty. | Medium | Low |
The most pressing risks are KKR’s high market volatility and weak liquidity ratios. The beta near 2 doubles typical market risk, raising potential for sharp price swings. Zero current and quick ratios flag liquidity red flags, unusual for a major asset manager. While valuation appears stretched, strong Altman Z-Score in the safe zone and robust Piotroski score support financial stability. Nonetheless, investors must monitor liquidity closely given volatile markets in 2026.
Should You Buy KKR & Co. Inc.?
KKR & Co. Inc. appears to be creating substantial value with a very favorable moat, reflected in a growing ROIC well above WACC. While its leverage profile shows signs of risk, the overall rating of C- suggests caution despite strong operational efficiency.
Strength & Efficiency Pillars
KKR & Co. Inc. shows operational strength with a robust gross margin of 41.82% and an EBIT margin of 36.99%. The net margin holds favorably at 12.31%, reflecting effective cost control. Impressively, the company’s ROIC stands at 6497.06%, vastly exceeding its WACC of 12.81%, confirming KKR as a clear value creator. This substantial spread signals a sustainable competitive advantage and efficient capital allocation, a rare feat in the asset management sector.
Weaknesses and Drawbacks
Despite solid operational margins, KKR’s overall financial profile is slightly unfavorable. The price-to-earnings ratio of 47.88 indicates an expensive valuation compared to industry norms. Liquidity is a concern with a current ratio and quick ratio both at 0, suggesting potential short-term cash flow risks. The stock faces downward pressure, reflected by a bearish trend and recent seller dominance at 13.16%, which may limit near-term upside. These factors introduce caution for risk-averse investors.
Our Final Verdict about KKR & Co. Inc.
KKR’s long-term fundamentals appear robust, driven by exceptional value creation and profitability metrics. However, the recent bearish price action and seller dominance suggest a wait-and-see stance. The profile might appear attractive for investors focused on capitalizing on fundamental strength but wary of short-term market pressures. A cautious approach could uncover better entry points as volatility persists.
Disclaimer: This content is for informational purposes only and does not constitute financial, investment, or other professional advice. Investing in financial markets involves a significant risk of loss, and past performance is not indicative of future results.
Additional Resources
- Private credit fund managed by KKR reports jump in troubled loans – Financial Times (Feb 26, 2026)
- FS KKR (FSK) Falls Sharply on 31% Dividend Cut – Yahoo Finance (Feb 27, 2026)
- FS KKR Private Credit Fund Cuts Dividend Amid Rise in Bad Loans – Bloomberg.com (Feb 26, 2026)
- FS KKR Capital stock dips after Q4 earnings miss, dividend cut by ~30% (FSK:NYSE) – Seeking Alpha (Feb 25, 2026)
- FS KKR Capital Corp. Announces Fourth Quarter and Full Year 2025 Results; Declares First Quarter 2026 Distribution of $0.48 per Share – PR Newswire (Feb 25, 2026)
For more information about KKR & Co. Inc., please visit the official website: kkr.com