Home > Analyses > Energy > Kinder Morgan, Inc.
Kinder Morgan, Inc. powers North America’s energy flow through a vast network of pipelines and terminals. Its infrastructure quietly fuels homes, industries, and transportation every day. As a dominant midstream player, Kinder Morgan commands one of the largest pipeline systems, combining natural gas, petroleum products, and CO2 services with a reputation for operational excellence. The critical question for investors is whether Kinder Morgan’s robust asset base and steady cash flow justify its current valuation and promise sustainable growth ahead.
Table of contents
Business Model & Company Overview
Kinder Morgan, Inc., founded in 1936 and headquartered in Houston, TX, stands as a dominant player in North America’s oil and gas midstream sector. It operates an integrated ecosystem of pipelines, terminals, and CO2 services that support energy infrastructure across multiple commodities. This cohesive network underpins its mission to efficiently transport and store vital energy resources.
The company’s revenue engine balances long-haul natural gas and petroleum pipelines with terminals handling liquids and bulk commodities. It also markets CO2 for enhanced oil recovery and manages renewable natural gas and liquefied natural gas facilities. Kinder Morgan’s extensive footprint spans the Americas, with strategic operations impacting energy flows across key global markets. Its vast pipeline system and terminal assets form a formidable economic moat, securing its role in shaping the industry’s future.
Financial Performance & Fundamental Metrics
I analyze Kinder Morgan, Inc.’s income statement, key financial ratios, and dividend payout policy to assess its underlying financial health and shareholder value distribution.
Income Statement
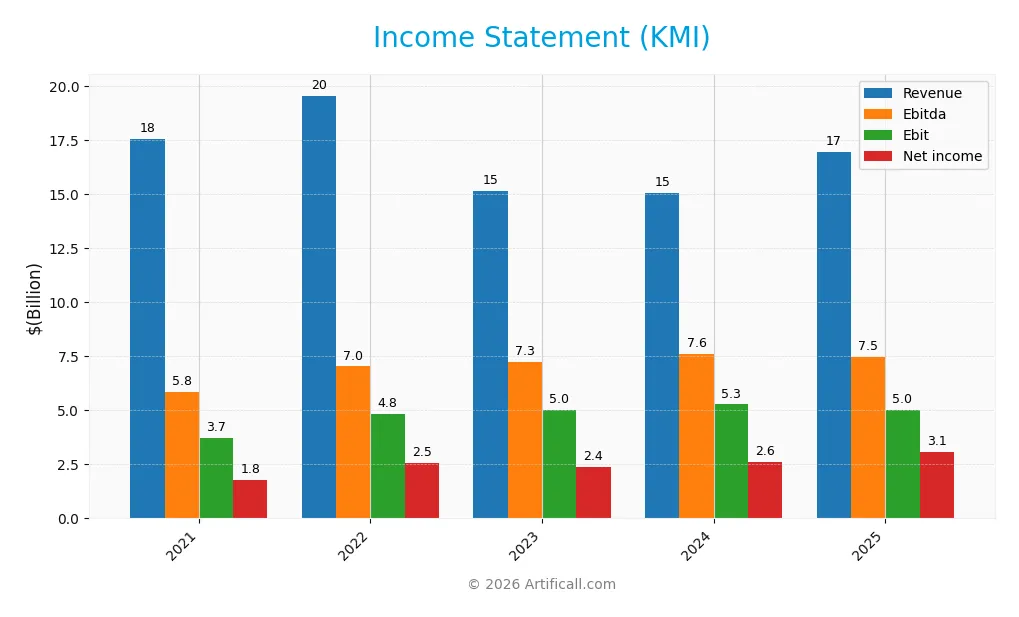
Below is Kinder Morgan, Inc.’s Income Statement for fiscal years 2021 through 2025, showing key profitability metrics in USD.
| 2021 | 2022 | 2023 | 2024 | 2025 | |
|---|---|---|---|---|---|
| Revenue | 17.53B | 19.55B | 15.16B | 15.07B | 16.95B |
| Cost of Revenue | 11.17B | 14.05B | 10.02B | 9.55B | 9.55B |
| Operating Expenses | 1.08B | 1.08B | 1.09B | 1.15B | 2.59B |
| Gross Profit | 6.37B | 5.50B | 5.13B | 5.53B | 7.40B |
| EBITDA | 5.85B | 7.03B | 7.25B | 7.63B | 7.48B |
| EBIT | 3.72B | 4.84B | 5.01B | 5.27B | 5.03B |
| Interest Expense | 1.50B | 1.51B | 1.80B | 1.87B | 1.80B |
| Net Income | 1.78B | 2.55B | 2.39B | 2.61B | 3.06B |
| EPS | 0.78 | 1.12 | 1.06 | 1.17 | 1.37 |
| Filing Date | 2022-02-07 | 2023-02-08 | 2024-02-20 | 2025-02-13 | 2026-02-13 |
Income Statement Evolution
Kinder Morgan’s revenue fluctuated over 2021-2025, with a 3.3% overall decline but a 12.5% rebound in 2025. Net income surged 71.3% over the period, supported by a 77.2% rise in net margin. Gross margin improved to 43.7%, while EBIT margin held steady near 30%, reflecting stable operational efficiency despite higher costs.
Is the Income Statement Favorable?
The 2025 income statement reveals robust fundamentals. Revenue increased 12.5% to $16.95B, with gross profit jumping 33.9%. EBIT dropped 4.7%, pressured by rising operating expenses and interest costs, the latter at 10.6% of revenue—a notable weakness. Still, a 4% net margin growth and 17% EPS increase underpin a generally favorable financial position.
Financial Ratios
The following table summarizes key financial ratios for Kinder Morgan, Inc. over recent fiscal years:
| Ratios | 2021 | 2022 | 2023 | 2024 | 2025 |
|---|---|---|---|---|---|
| Net Margin | 10.2% | 13.0% | 15.8% | 17.3% | 18.0% |
| ROE | 5.8% | 8.3% | 7.9% | 8.6% | 9.8% |
| ROIC | 6.6% | 6.3% | 5.0% | 5.1% | 5.8% |
| P/E | 20.1 | 16.0 | 16.5 | 23.3 | 20.0 |
| P/B | 1.17 | 1.33 | 1.30 | 1.99 | 1.96 |
| Current Ratio | 0.66 | 0.55 | 0.35 | 0.49 | 0.03 |
| Quick Ratio | 0.56 | 0.46 | 0.28 | 0.39 | 0.03 |
| D/E | 1.08 | 1.03 | 1.05 | 1.04 | 1.02 |
| Debt-to-Assets | 47.2% | 45.0% | 44.9% | 44.3% | 43.7% |
| Interest Coverage | 3.53 | 2.94 | 2.24 | 2.35 | 2.67 |
| Asset Turnover | 0.25 | 0.28 | 0.21 | 0.21 | 0.23 |
| Fixed Asset Turnover | 0.49 | 0.55 | 0.41 | 0.40 | 0.43 |
| Dividend Yield | 6.8% | 6.1% | 6.4% | 4.2% | 4.3% |
Evolution of Financial Ratios
Kinder Morgan’s Return on Equity (ROE) showed a slight upward trend but remained below 10%, reflecting modest profitability. The Current Ratio declined sharply to 0.03 in 2025, indicating worsening liquidity. Meanwhile, the Debt-to-Equity Ratio stayed relatively stable near 1.02, suggesting consistent leverage. Profit margins improved steadily, with net margin reaching 18% in 2025, signaling stronger operational efficiency.
Are the Financial Ratios Favorable?
In 2025, profitability metrics like net margin (18.03%) are favorable, yet ROE (9.81%) remains below the cost of capital, marking it unfavorable. Liquidity ratios, including current and quick ratios near 0.03, are clearly weak. Debt levels are neutral with a debt-to-assets ratio of 43.74%. Asset turnover and fixed asset turnover are unfavorable, reflecting efficiency challenges. Dividend yield at 4.26% is favorable, but overall, ratios indicate a slightly unfavorable financial position.
Shareholder Return Policy
Kinder Morgan, Inc. maintains a dividend payout ratio around 85%, with a steady dividend per share near $1.17 and a yield of approximately 4.3%. The company supports returns with share buybacks, covered by free cash flow and operating cash flow, though payout ratios above 80% suggest limited flexibility.
This return approach balances income distribution and capital retention, aiming to sustain long-term shareholder value. However, the relatively high payout ratio, combined with moderate free cash flow coverage, warrants caution regarding the durability of current dividend levels during market downturns or capital expenditure increases.
Score analysis
The radar chart below illustrates Kinder Morgan, Inc.’s key financial scores across valuation and profitability metrics:
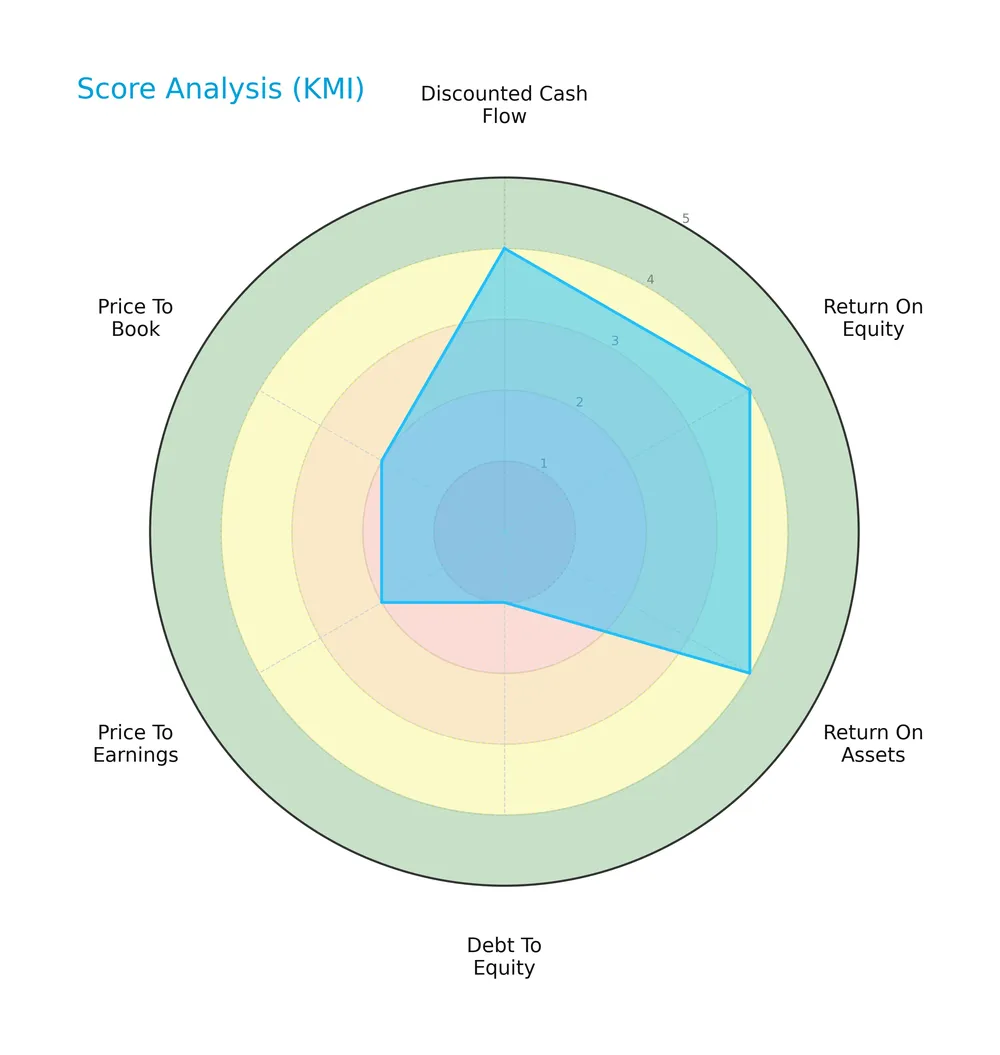
Kinder Morgan scores favorably on discounted cash flow, return on equity, and return on assets (all rated 4). However, its debt-to-equity score is very unfavorable (1), while price-to-earnings and price-to-book scores are unfavorable (2), indicating valuation concerns despite operational strength.
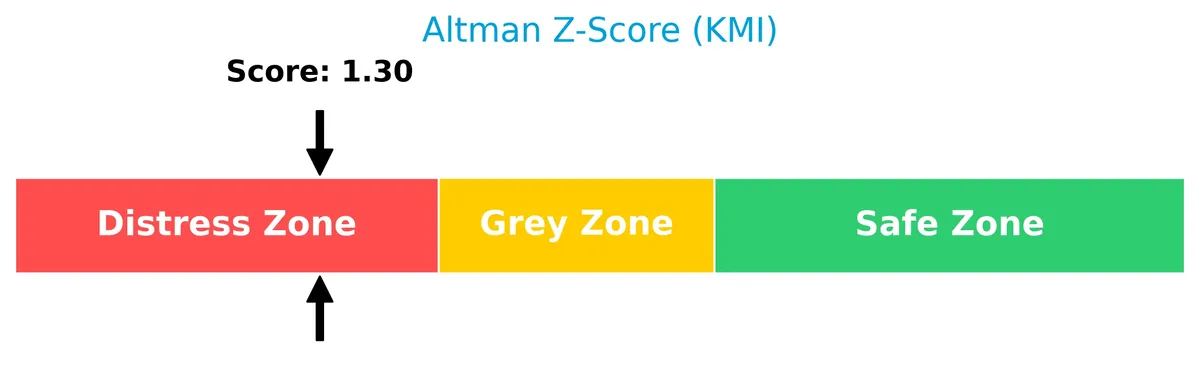
Analysis of the company’s bankruptcy risk
Kinder Morgan’s Altman Z-Score places it in the distress zone, signaling a high risk of financial distress and potential bankruptcy:
Is the company in good financial health?
The Piotroski Score diagram provides insight into Kinder Morgan’s overall financial health based on profitability, leverage, and efficiency:

With an average Piotroski Score of 6, Kinder Morgan demonstrates moderate financial strength, suggesting some resilience but room for improvement in operational and financial efficiency.
Competitive Landscape & Sector Positioning
This sector analysis reviews Kinder Morgan, Inc.’s strategic positioning and revenue by segment in the energy midstream industry. I will assess whether Kinder Morgan holds a competitive advantage over its main competitors.
Strategic Positioning
Kinder Morgan, Inc. concentrates revenue in North America, predominantly the U.S. with $16.9B in 2025. Its portfolio spans four core segments: Natural Gas Pipelines ($11B), Products Pipelines ($2.7B), Terminals ($2.1B), and CO2 ($1.2B), reflecting a diversified midstream energy infrastructure focus.
Revenue by Segment
This pie chart presents Kinder Morgan, Inc.’s revenue distribution by segment for fiscal year 2025, illustrating the relative contribution of each business unit to total sales.
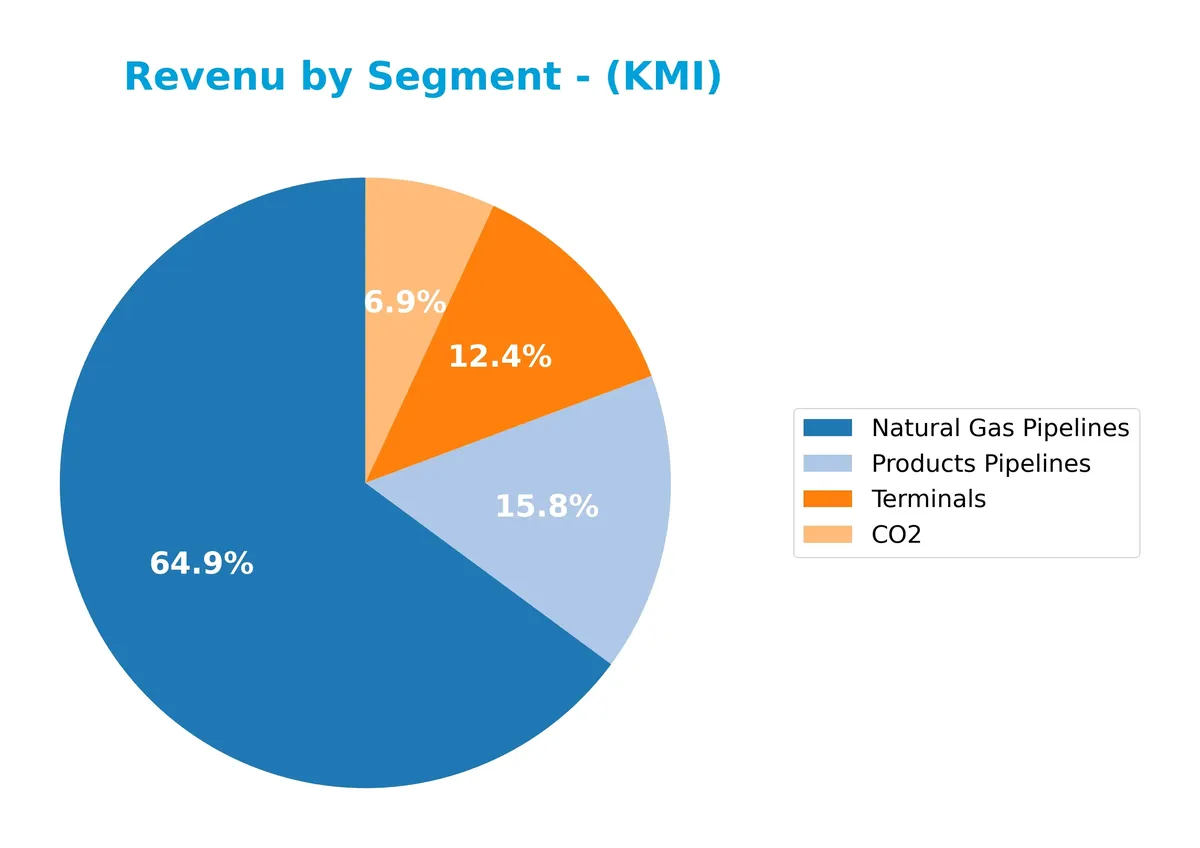
Natural Gas Pipelines remain the dominant revenue driver at 11B in 2025, reflecting steady growth since 2020. Products Pipelines and Terminals contribute 2.7B and 2.1B, respectively, showing mild declines from prior years. CO2 revenue has decreased to 1.17B, signaling a contraction in that segment. The business shows concentration risk in Natural Gas Pipelines but benefits from stable, diversified pipeline assets.
Key Products & Brands
Kinder Morgan’s core business segments and their descriptions are detailed below:
| Product | Description |
|---|---|
| Natural Gas Pipelines | Owns and operates interstate/intrastate pipelines, storage systems, gathering, processing, and LNG facilities. |
| Products Pipelines | Manages refined petroleum, crude oil, condensate pipelines, product terminals, and transmix facilities. |
| Terminals | Operates liquids and bulk terminals for gasoline, diesel, chemicals, ethanol, metals, and petroleum coke. |
| CO2 | Produces, transports, markets CO2 for oil recovery; owns oil fields, processing plants, RNG and LNG facilities. |
Kinder Morgan’s product portfolio spans extensive pipeline networks, terminals, and CO2 operations, reflecting a diversified midstream energy infrastructure platform.
Main Competitors
There are 4 main competitors in the Oil & Gas Midstream industry; below are the top 4 leaders by market capitalization:
| Competitor | Market Cap. |
|---|---|
| The Williams Companies, Inc. | 74.3B |
| Kinder Morgan, Inc. | 61.6B |
| ONEOK, Inc. | 46.8B |
| Targa Resources Corp. | 40.1B |
Kinder Morgan ranks 2nd among its competitors with a market cap at 96.8% of the leader’s size. It stands above both the average market cap of the top 10 competitors (55.7B) and the sector median (54.2B). The company maintains a narrow 3.35% gap from the leader, highlighting a tight competition at the top.
Comparisons with competitors
Check out how we compare the company to its competitors:
Does KMI have a competitive advantage?
Kinder Morgan, Inc. does not present a competitive advantage as its ROIC falls below WACC, indicating value destruction and declining profitability over 2021–2025. This trend signals inefficient capital use and diminishing economic moat in the midstream energy sector.
Looking ahead, Kinder Morgan operates extensive pipelines and terminals across North America, with potential growth in CO2 and renewable natural gas segments. Expansion in emerging energy infrastructure markets may offer new opportunities despite current financial headwinds.
SWOT Analysis
This analysis highlights Kinder Morgan’s core competitive position and risks to inform strategic decisions.
Strengths
- Extensive 83K miles pipeline network
- Diverse segments including CO2 and LNG
- Strong net margin of 18%
Weaknesses
- Low current and quick ratios (0.03) signal liquidity risks
- Declining ROIC below WACC indicates value destruction
- High debt-to-equity ratio weakens financial flexibility
Opportunities
- Growing US natural gas demand supports pipeline volumes
- Expansion potential in CO2 enhanced oil recovery
- Rising dividend yield (4.26%) attracts income investors
Threats
- Regulatory pressures on fossil fuels intensify
- Volatile commodity prices impact volumes and margins
- Competition from renewable energy alternatives
Kinder Morgan’s vast infrastructure and solid profitability provide a durable base. However, liquidity constraints and declining capital efficiency require cautious capital allocation. Strategic focus on gas infrastructure and CO2 markets could offset regulatory and competitive threats.
Stock Price Action Analysis
The weekly stock chart for Kinder Morgan, Inc. (KMI) depicts significant price movement and volatility over the past 12 months:
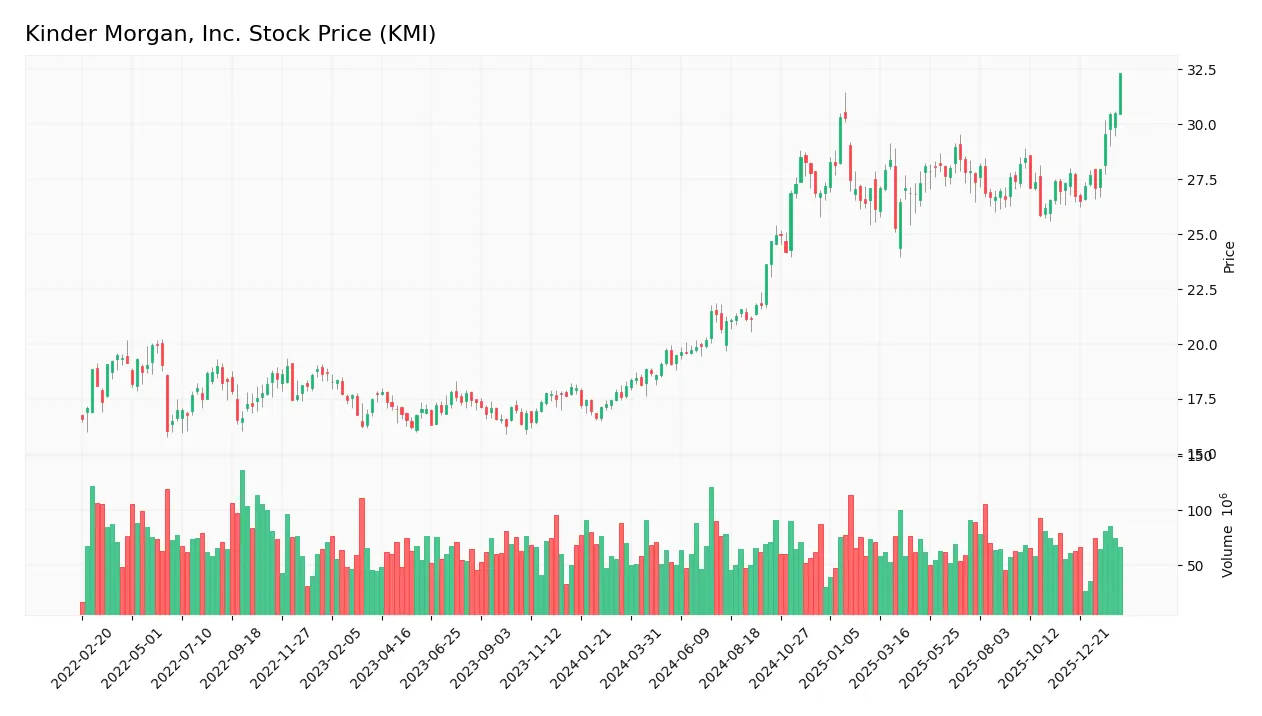
Trend Analysis
Over the past year, KMI’s stock price rose 79%, signaling a bullish trend with clear acceleration. The price ranged from a low of 18.06 to a high of 32.32. Volatility is moderate, with a standard deviation of 3.59, confirming sustained upward momentum.
Volume Analysis
Trading volume shows an increasing trend, with buyers dominating 57% overall and nearly 73% in the recent three months. This buyer-driven activity reflects strong investor confidence and heightened market participation. Seller volume remains significantly lower, reinforcing bullish sentiment.
Target Prices
Analysts set a clear target consensus for Kinder Morgan, Inc., reflecting moderate growth expectations.
| Target Low | Target High | Consensus |
|---|---|---|
| 30 | 38 | 34.33 |
The target range suggests analysts foresee upside potential around 10-15% from current levels. The consensus price of 34.33 signals confidence in steady cash flow and infrastructure demand.

Don’t Let Luck Decide Your Entry Point
Optimize your entry points with our advanced ProRealTime indicators. You’ll get efficient buy signals with precise price targets for maximum performance. Start outperforming now!
Analyst & Consumer Opinions
This section reviews Kinder Morgan, Inc.’s analyst ratings and consumer feedback to provide a comprehensive sentiment overview.
Stock Grades
Here is the latest verified grading data for Kinder Morgan, Inc. from established financial institutions:
| Grading Company | Action | New Grade | Date |
|---|---|---|---|
| Scotiabank | Maintain | Sector Perform | 2026-01-23 |
| TD Cowen | Maintain | Buy | 2026-01-22 |
| Jefferies | Maintain | Hold | 2026-01-22 |
| Jefferies | Maintain | Hold | 2025-12-23 |
| Mizuho | Maintain | Outperform | 2025-11-14 |
| RBC Capital | Maintain | Sector Perform | 2025-11-13 |
| Stifel | Maintain | Hold | 2025-11-11 |
| Morgan Stanley | Maintain | Equal Weight | 2025-10-01 |
| Scotiabank | Maintain | Sector Perform | 2025-09-19 |
| Stifel | Maintain | Hold | 2025-08-14 |
Grades consistently reflect a mixed but stable outlook, with most firms maintaining neutral or hold ratings. The consensus leans mildly positive, balancing buy and hold recommendations.
Consumer Opinions
Investor sentiment around Kinder Morgan, Inc. (KMI) reflects a mix of appreciation for its steady cash flow and concern over pipeline controversies.
| Positive Reviews | Negative Reviews |
|---|---|
| Reliable dividend payments offer consistent income. | Environmental concerns about pipeline safety persist. |
| Strong infrastructure assets provide market moat. | Regulatory hurdles create uncertainty. |
| Transparent communication builds investor trust. | Growth prospects appear limited amid energy transition. |
Overall, consumers praise Kinder Morgan’s stable income and robust asset base. However, environmental risks and regulatory challenges temper enthusiasm, signaling caution in long-term growth expectations.
Risk Analysis
Below is a summary of key risks Kinder Morgan, Inc. faces, categorized by likelihood and potential impact:
| Category | Description | Probability | Impact |
|---|---|---|---|
| Liquidity Risk | Extremely low current and quick ratios (0.03) limit short-term flexibility | High | High |
| Leverage Risk | Debt-to-equity ratio above 1.0 signals heavy reliance on debt | Moderate | High |
| Bankruptcy Risk | Altman Z-Score at 1.3 places company in distress zone | Moderate | High |
| Operational Risk | Asset turnover ratios below sector norms indicate inefficiency | Moderate | Medium |
| Market Risk | Beta of 0.69 implies less volatility but sensitive to energy prices | Moderate | Medium |
| Regulatory Risk | Exposure to energy infrastructure regulations may increase costs | Low | Medium |
The most pressing concerns are liquidity and leverage risks, given Kinder Morgan’s dangerously low liquidity ratios and a debt load exceeding equity. The distressed Altman Z-Score signals a material bankruptcy risk. Operational inefficiencies also weigh on returns, limiting the company’s ability to generate cash flow. Investors must monitor these vulnerabilities carefully.
Should You Buy Kinder Morgan, Inc.?
Kinder Morgan, Inc. appears to be facing operational challenges with declining ROIC and a deteriorating moat, suggesting weakening value creation. Despite substantial leverage and liquidity concerns, its profitability shows moderate resilience. The overall B rating reflects a cautiously favorable yet risk-aware profile.
Strength & Efficiency Pillars
Kinder Morgan, Inc. posts solid operational margins, with a gross margin of 43.66% and an EBIT margin of 29.65%, reflecting strong core business efficiency. The net margin stands at 18.03%, signaling profitability. However, the return on invested capital (ROIC) at 5.76% trails the weighted average cost of capital (WACC) of 6.1%, indicating the company is currently shedding value rather than creating it. This decline in ROIC points to challenges in capital allocation despite healthy margin profiles.
Weaknesses and Drawbacks
The company is in financial distress, as evidenced by its Altman Z-Score of 1.30, falling in the distress zone and signaling a high bankruptcy risk. This solvency issue overshadows profitability metrics. Additionally, leverage is problematic, with a debt-to-equity ratio of 1.02 and an alarmingly low current ratio of 0.03, exposing liquidity concerns. The interest expense ratio of 10.62% further burdens cash flow. Valuation metrics remain neutral, but these financial vulnerabilities pose significant risks.
Our Final Verdict about Kinder Morgan, Inc.
Despite operational strengths, Kinder Morgan’s solvency risk, as reflected by the Altman Z-Score in the distress zone, renders its investment profile highly speculative. The company’s inability to generate returns above its cost of capital, combined with liquidity and leverage red flags, suggests it is too risky for conservative capital. Caution is warranted until financial health improves and value creation resumes.
Disclaimer: This content is for informational purposes only and does not constitute financial, investment, or other professional advice. Investing in financial markets involves a significant risk of loss, and past performance is not indicative of future results.
Additional Resources
- Metis Global Partners LLC Purchases 53,616 Shares of Kinder Morgan, Inc. $KMI – MarketBeat (Feb 13, 2026)
- KINDER MORGAN, INC. SEC 10-K Report – TradingView (Feb 13, 2026)
- 3 Natural Gas Stocks to Buy as AI Energy Demand Skyrockets – Benzinga (Feb 13, 2026)
- Kinder Morgan, Inc. $KMI Shares Purchased by ING Groep NV – MarketBeat (Feb 13, 2026)
- Kinder Morgan (KMI) Gets Positive Analyst Updates After Q4 Results – Yahoo Finance (Feb 08, 2026)
For more information about Kinder Morgan, Inc., please visit the official website: kindermorgan.com