Home > Analyses > Real Estate > Kimco Realty Corporation
Kimco Realty shapes how millions shop by owning and operating vibrant, grocery-anchored shopping centers across North America. As one of the largest publicly traded REITs, it commands a vast portfolio focused on prime metropolitan markets. Kimco’s legacy of innovation and strategic asset management sets it apart in retail real estate. The pressing question now: does Kimco’s robust presence and steady dividends still justify its valuation and future growth potential?

Table of contents
Business Model & Company Overview
Kimco Realty Corporation, founded over 60 years ago and headquartered in Jericho, NY, stands as one of North America’s largest publicly traded owners and operators of open-air, grocery-anchored shopping centers and mixed-use assets. Its core business weaves together retail real estate acquisition, development, and management into a cohesive ecosystem, focused primarily on high-demand metropolitan markets. Listed on the NYSE since 1991 and included in the S&P 500, Kimco operates with a strategic vision shaped by decades of sector expertise.
The company’s revenue engine centers on leasing 70M square feet across 400 U.S. properties, generating stable cash flows from long-term tenants in retail hubs. Kimco balances property income with active asset management, leveraging its footprint across Americas markets. Its scale and specialization form a robust economic moat, positioning Kimco as a defining force in shaping the future of retail real estate.
Financial Performance & Fundamental Metrics
I analyze Kimco Realty Corporation’s income statement, key financial ratios, and dividend payout policy to assess its operational efficiency and shareholder value.
Income Statement
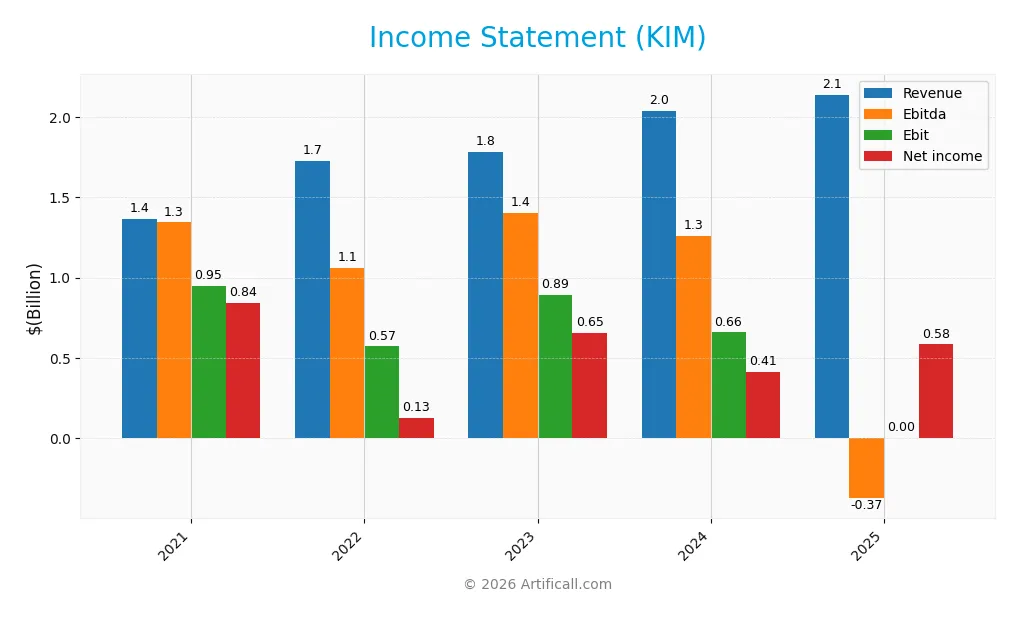
This table summarizes Kimco Realty Corporation’s key income statement figures over the past five fiscal years, reflecting revenue trends and profitability metrics.
| 2021 | 2022 | 2023 | 2024 | 2025 | |
|---|---|---|---|---|---|
| Revenue | 1.36B | 1.73B | 1.78B | 2.04B | 2.14B |
| Cost of Revenue | 418M | 531M | 557M | 638M | 970M |
| Operating Expenses | 522M | 631M | 588M | 770M | 417M |
| Gross Profit | 947M | 1.20B | 1.23B | 1.40B | 1.17B |
| EBITDA | 1.34B | 1.06B | 1.40B | 1.26B | 1.53B |
| EBIT | 949M | 572M | 894M | 659M | 908M |
| Interest Expense | 204M | 227M | 250M | 308M | 408M |
| Net Income | 844M | 126M | 654M | 411M | 584M |
| EPS | 1.61 | 0.16 | 1.02 | 0.55 | 0.83 |
| Filing Date | 2022-03-01 | 2023-02-24 | 2024-02-26 | 2025-02-21 | 2026-02-20 |
Income Statement Evolution
From 2021 to 2025, Kimco Realty’s revenue rose 57% to 2.14B, showing steady expansion. However, net income declined nearly 31%, signaling margin pressure. Gross margin fell notably in 2025 to 54.7%, down from prior years, while EBIT margin improved to 42.4%, reflecting tighter cost control despite rising expenses.
Is the Income Statement Favorable?
The 2025 income statement reveals solid fundamentals with revenue growth of 5.1% and a 38% surge in EBIT, boosting operating profitability. Net margin expanded 35% to 27.3%, driven by disciplined operating expenses. Interest expense remains a concern at 19% of revenue, dampening net income, but overall metrics suggest a generally favorable financial position.
Financial Ratios
The table below presents key financial ratios for Kimco Realty Corporation over the last five fiscal years, illustrating profitability, valuation, liquidity, leverage, efficiency, and dividend metrics:
| Ratios | 2021 | 2022 | 2023 | 2024 | 2025 |
|---|---|---|---|---|---|
| Net Margin | 61.9% | 7.3% | 36.7% | 20.2% | 27.3% |
| ROE | 8.5% | 1.3% | 6.9% | 3.9% | 5.6% |
| ROIC | 2.3% | 2.1% | 3.2% | 3.0% | 3.8% |
| P/E | 14.8 | 103.5 | 20.1 | 38.3 | 23.4 |
| P/B | 1.26 | 1.37 | 1.38 | 1.48 | 1.31 |
| Current Ratio | 8.0 | 4.9 | 6.4 | 3.6 | 0.0 |
| Quick Ratio | 8.0 | 4.9 | 6.4 | 3.6 | 0.0 |
| D/E | 0.77 | 0.76 | 0.81 | 0.81 | 0.81 |
| Debt-to-Assets | 41.2% | 40.8% | 42.3% | 42.2% | 42.8% |
| Interest Coverage | 2.1 | 2.5 | 2.6 | 2.0 | 1.8 |
| Asset Turnover | 0.07 | 0.10 | 0.10 | 0.10 | 0.11 |
| Fixed Asset Turnover | 9.3 | 12.9 | 13.9 | 16.1 | 16.8 |
| Dividend Yield | 3.1% | 4.2% | 5.0% | 4.4% | 5.0% |
Evolution of Financial Ratios
Kimco Realty’s Return on Equity (ROE) declined sharply from 61.85% in 2021 to 5.62% in 2025, signaling reduced profitability. The Current Ratio plunged from 7.98 in 2021 to 0 in 2025, indicating deteriorating liquidity. Debt-to-Equity remained stable around 0.81, reflecting consistent leverage despite profit compression.
Are the Financial Ratios Fovorable?
In 2025, Kimco shows favorable net margin (27.29%) and fixed asset turnover (16.77), supporting efficient profitability and asset use. However, ROE (5.62%), ROIC (3.8%), and asset turnover (0.11) are unfavorable, signaling operational and capital efficiency issues. Liquidity ratios are absent, a red flag. Debt metrics (D/E 0.81, debt-to-assets 42.8%) are neutral. Overall, the ratio profile is neutral but with notable weaknesses.
Shareholder Return Policy
Kimco Realty Corporation maintains a dividend payout ratio exceeding 100%, with a 2025 dividend per share of $1.01 and a yield near 5%. The dividend is well covered by free cash flow, supported by steady share buybacks, signaling a commitment to returning capital.
This distribution approach balances income with capital returns, yet the high payout ratio may pressure long-term sustainability if earnings falter. The combination of dividends and buybacks generally supports shareholder value, though vigilance on cash flow and debt levels remains crucial.
Score analysis
The following radar chart illustrates Kimco Realty Corporation’s key financial metric scores:
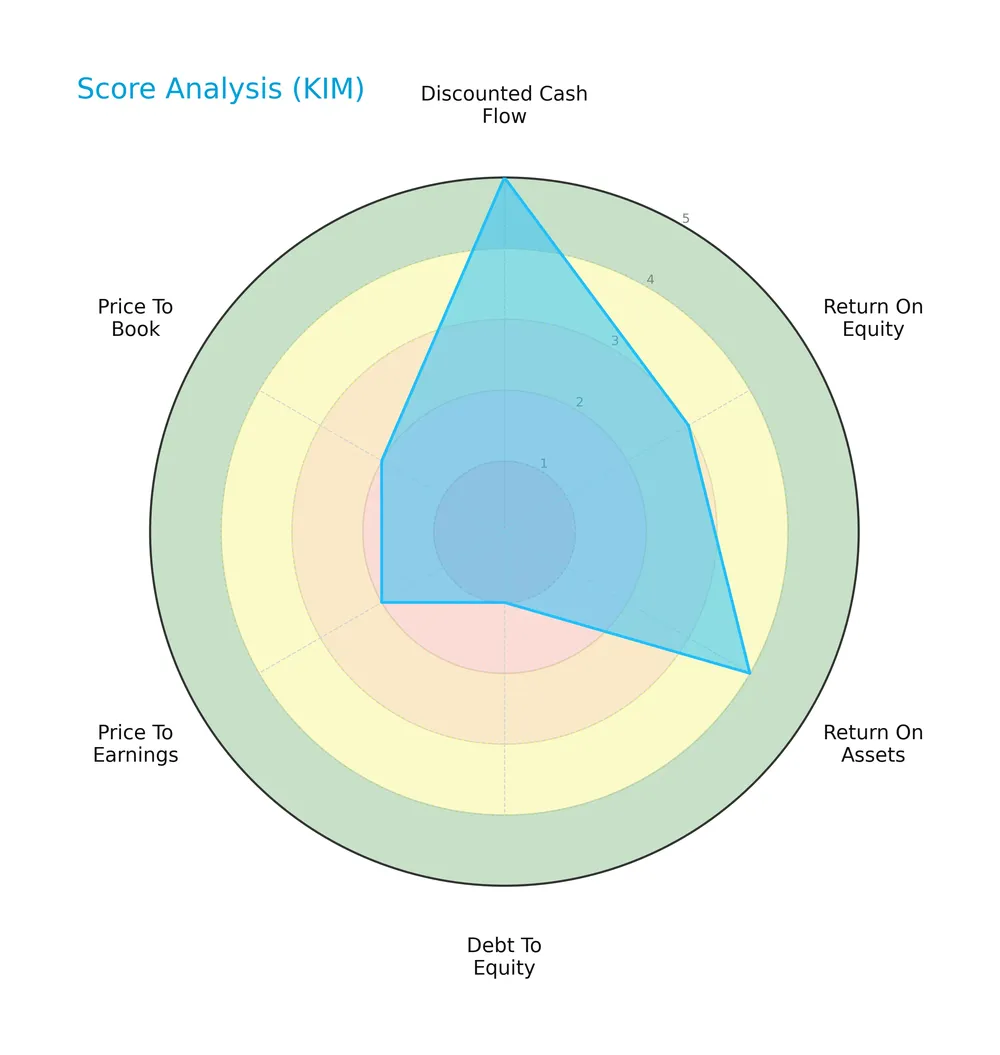
The company shows a very favorable discounted cash flow score of 5 and a favorable return on assets score of 4. Return on equity and debt-to-equity scores are moderate at 3. However, valuation metrics price-to-earnings and price-to-book scores lag at 2, indicating less attractive market multiples.
Analysis of the company’s bankruptcy risk
Kimco Realty Corporation’s Altman Z-Score places it in the distress zone, signaling elevated bankruptcy risk and financial vulnerability:

Is the company in good financial health?
The Piotroski Score diagram summarizes Kimco’s financial strength based on key criteria:

With a Piotroski Score of 6, Kimco Realty demonstrates average financial health. This suggests moderate operational efficiency and profitability, but not the strength typically associated with strong value investments.
Competitive Landscape & Sector Positioning
This section examines Kimco Realty Corporation’s strategic positioning, revenue segments, products, competitors, and competitive advantages. I will assess whether Kimco holds a sustainable advantage over its main rivals.
Strategic Positioning
Kimco Realty Corporation concentrates its portfolio on open-air, grocery-anchored shopping centers and mixed-use assets, primarily in major U.S. metropolitan markets. Its revenue streams focus heavily on rental properties, with limited diversification outside retail real estate.
Revenue by Segment
This pie chart illustrates Kimco Realty Corporation’s revenue distribution by segment for the fiscal year 2018, highlighting the company’s income sources and their relative scale.
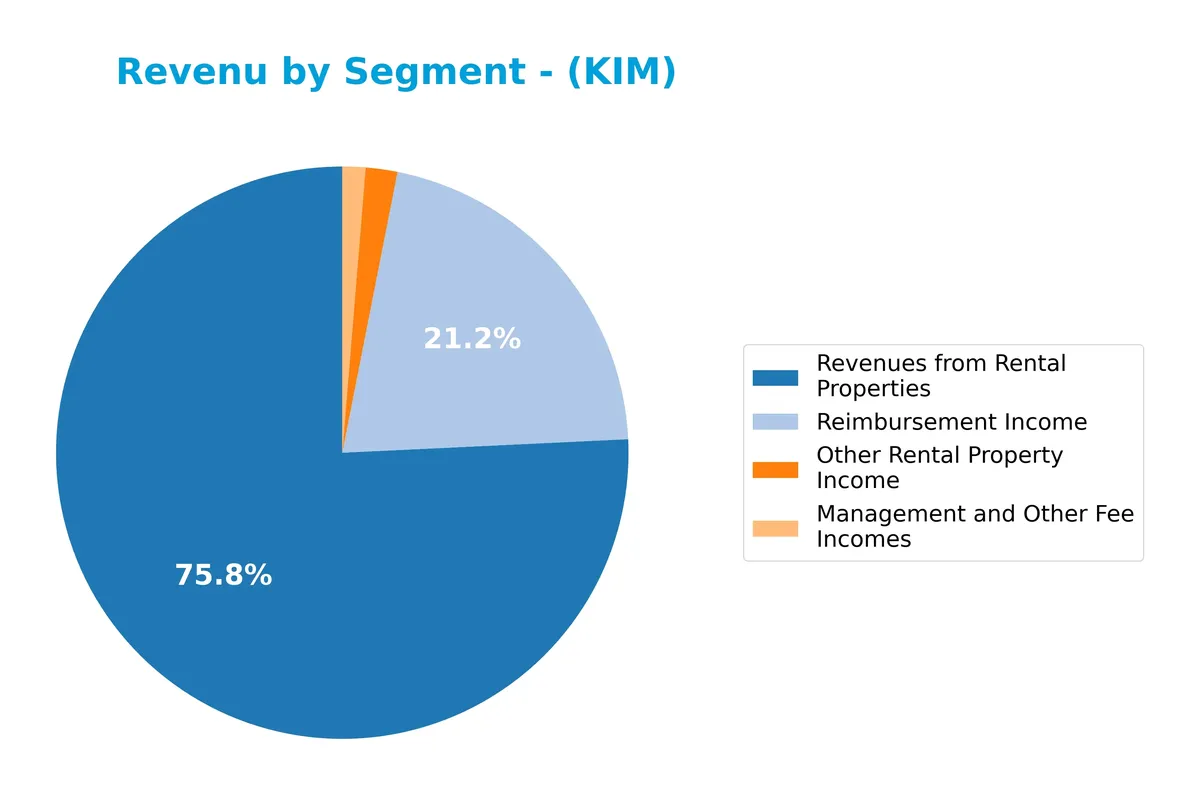
In 2018, revenue predominantly stemmed from Rental Properties at 882M, underscoring Kimco’s core business strength. Reimbursement Income also contributed significantly with 246M, reflecting operational cost recoveries. Other Rental Property Income and Management Fees were minor at 21M and 15M respectively. Compared to 2010’s limited retail lease revenue of 6M, the 2018 data shows strong diversification and scale expansion in the rental segments.
Key Products & Brands
Kimco Realty Corporation generates revenue through multiple leasing and fee income streams, detailed as follows:
| Product | Description |
|---|---|
| Revenues from Rental Properties | Income from leasing retail and mixed-use properties, totaling $882M in 2018. |
| Reimbursement Income | Payments received for reimbursable expenses related to property operations, $246M in 2018. |
| Other Rental Property Income | Additional rental income sources outside core leases, amounting to $21M in 2018. |
| Management and Other Fee Incomes | Fees earned from managing properties and related services, $15M in 2018. |
| Retail Store Leases | Revenue specifically from retail store leasing, reported as $5.9M in 2010. |
Kimco focuses on grocery-anchored shopping centers and mixed-use assets. Rental properties form the largest revenue source, supported by management fees and reimbursements. This diversified income mix reflects its role as a leading retail REIT.
Main Competitors
There are 5 competitors in total, with the table below listing the top 5 leaders by market capitalization:
| Competitor | Market Cap. |
|---|---|
| Simon Property Group, Inc. | 60B |
| Realty Income Corporation | 53B |
| Kimco Realty Corporation | 13.6B |
| Regency Centers Corporation | 12.3B |
| Federal Realty Investment Trust | 8.5B |
Kimco Realty Corporation ranks 3rd among its competitors. Its market cap is 26.13% of the sector leader, Simon Property Group. Kimco sits below the average market cap of the top 10 competitors (29.4B) but above the sector median (13.6B). The company holds a significant 236% market cap gap above its next closest rival, Regency Centers.
Comparisons with competitors
Check out how we compare the company to its competitors:
Does KIM have a competitive advantage?
Kimco Realty Corporation currently lacks a strong competitive advantage, as it is shedding value with an ROIC below its WACC. However, its gross margin of 54.7% and EBIT margin of 42.4% remain favorable compared to peers.
Looking ahead, KIM shows promise with a growing ROIC trend and positive EBIT and net margin growth. Expansion in grocery-anchored shopping centers and mixed-use assets in top U.S. markets offers potential opportunities.
SWOT Analysis
This analysis distills Kimco Realty Corporation’s core competitive position and risks to guide strategic decisions.
Strengths
- Large portfolio with 70M sq.ft. grocery-anchored centers
- Included in S&P 500, enhancing credibility
- Consistent dividend yield near 5%
Weaknesses
- ROIC below WACC, indicating value destruction
- Low liquidity ratios signal financial strain
- Declining net margin and EPS over the long term
Opportunities
- Growing ROIC trend suggests improving profitability
- Expansion in top metropolitan markets
- Potential to optimize asset turnover
Threats
- High interest expense pressure margins
- Retail REIT sector exposed to e-commerce shift
- Moderate bankruptcy risk per Altman Z-Score
Kimco’s strengths in scale and market positioning support resilience. However, persistent value destruction and liquidity gaps warrant caution. The improving ROIC trend offers strategic leverage if the company manages debt and adapts to retail disruption.
Stock Price Action Analysis
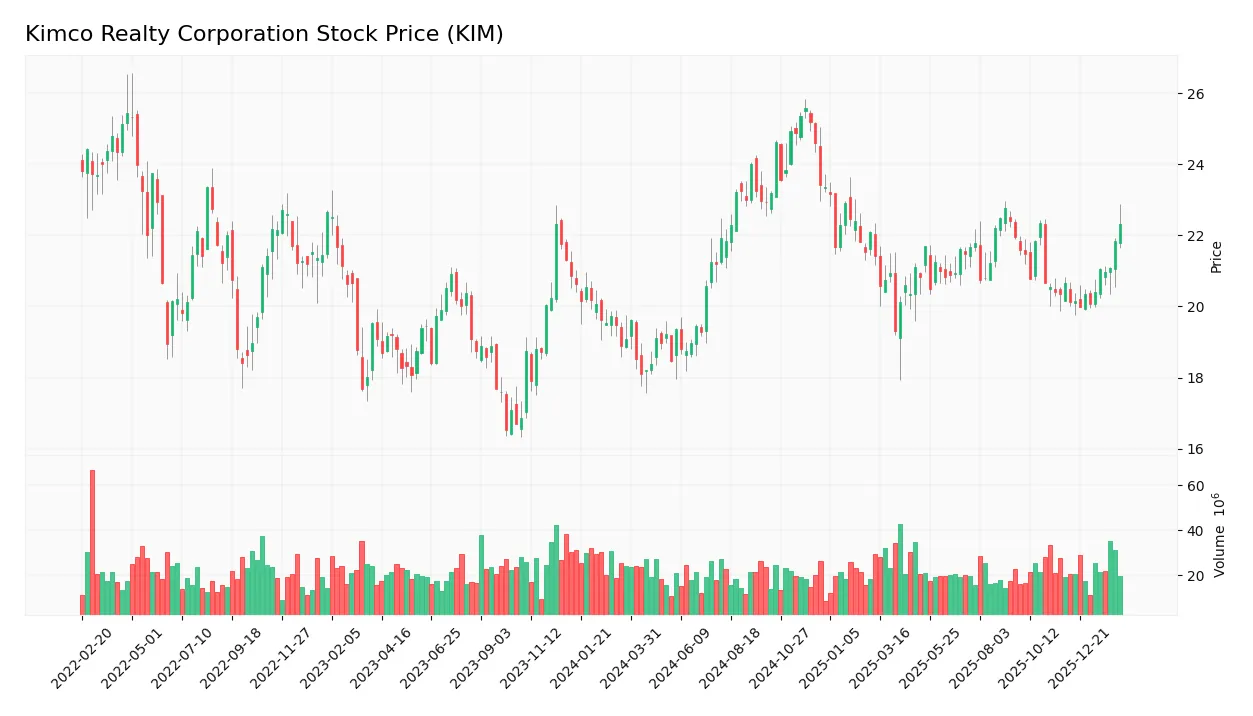
The weekly stock chart for Kimco Realty Corporation shows price movements and key levels over the past 100 weeks:
Trend Analysis
Over the past 100 weeks, the stock price increased by 18.15%, indicating a bullish trend with accelerating momentum. The price ranged between a low of 18.1 and a high of 25.57, with moderate volatility reflected by a standard deviation of 1.69. Recent months maintain a positive slope of 0.27 and a 15.1% rise.
Volume Analysis
Trading volume totals 2.7B shares, with buyers slightly edging sellers at 50.25%. However, volume is decreasing overall. In the last 3 months, buyer dominance surged to 71.12%, signaling strong buyer-driven activity and heightened investor interest despite shrinking market participation.
Target Prices
Analysts present a clear target price consensus for Kimco Realty Corporation.
| Target Low | Target High | Consensus |
|---|---|---|
| 21 | 26 | 24.14 |
The target range suggests moderate upside potential, with consensus pointing to a price near $24. This reflects cautious optimism about Kimco’s recovery and growth prospects in 2026.

Don’t Let Luck Decide Your Entry Point
Optimize your entry points with our advanced ProRealTime indicators. You’ll get efficient buy signals with precise price targets for maximum performance. Start outperforming now!
Analyst & Consumer Opinions
This section reviews recent analyst ratings and consumer feedback related to Kimco Realty Corporation (KIM) performance and reputation.
Stock Grades
The following table presents the latest verified stock grades for Kimco Realty Corporation from leading financial firms:
| Grading Company | Action | New Grade | Date |
|---|---|---|---|
| Piper Sandler | Maintain | Overweight | 2026-02-17 |
| Evercore ISI Group | Maintain | In Line | 2026-02-13 |
| Truist Securities | Maintain | Hold | 2026-01-20 |
| UBS | Maintain | Buy | 2026-01-08 |
| Wells Fargo | Maintain | Equal Weight | 2025-12-15 |
| Citigroup | Maintain | Neutral | 2025-12-03 |
| Argus Research | Maintain | Buy | 2025-12-01 |
| Scotiabank | Maintain | Sector Perform | 2025-11-13 |
| Barclays | Maintain | Overweight | 2025-10-06 |
| Evercore ISI Group | Maintain | In Line | 2025-09-08 |
The consensus grade remains steady at Hold, reflecting broad analyst caution. Most firms maintain their previous ratings, signaling no significant shifts in outlook.
Consumer Opinions
Consumers express a mix of appreciation and concerns regarding Kimco Realty Corporation’s service and property management.
| Positive Reviews | Negative Reviews |
|---|---|
| Well-maintained shopping centers with clean facilities. | Some locations suffer from slow maintenance response. |
| Friendly and helpful management staff. | Parking availability is limited during peak hours. |
| Convenient retail mix attracting diverse shoppers. | Occasional issues with tenant turnover affecting store variety. |
Overall, consumers praise Kimco’s property upkeep and management approach. However, recurring complaints about maintenance delays and parking constraints suggest areas for operational improvement.
Risk Analysis
Below is a summary of key risks facing Kimco Realty Corporation, highlighting their probability and potential impact:
| Category | Description | Probability | Impact |
|---|---|---|---|
| Financial Health | Altman Z-Score at 1.31 signals distress zone, indicating bankruptcy risk. | High | High |
| Liquidity | Current and quick ratios at 0 show critical short-term liquidity issues. | High | High |
| Profitability | ROE (5.62%) and ROIC (3.8%) below WACC (7.21%) reflect weak capital returns. | Medium | Medium |
| Market Volatility | Beta of 1.08 indicates slightly above-market volatility risk. | Medium | Medium |
| Debt Levels | Debt to assets at 42.8% and interest coverage at 2.23 indicate moderate leverage risk. | Medium | Medium |
| Valuation | PE (23.39) and PB (1.31) are neutral to favorable but price-to-earnings score is unfavorable. | Low | Low |
The most critical risk is Kimco’s distressed Altman Z-Score combined with zero liquidity ratios, which signals urgent financial vulnerability. Despite a robust net margin (27.3%) and favorable dividend yield (4.98%), weak returns on equity and capital raise concerns about long-term value creation. Investors must weigh these risks against steady income generation in a historically cyclical retail REIT sector.
Should You Buy Kimco Realty Corporation?
Kimco Realty Corporation appears to be shedding value despite improving profitability, suggesting a slightly unfavorable moat. While its leverage profile shows moderate risks and financial distress signals, the overall B+ rating could reflect resilient operational efficiency and cautious value creation.
Strength & Efficiency Pillars
Kimco Realty Corporation posts a strong net margin of 27.29%, reflecting solid profitability. Its EBIT margin is also robust at 42.42%, underscoring efficient core operations. However, the return on invested capital (ROIC) stands at 3.8%, below the weighted average cost of capital (WACC) of 7.21%, indicating the company is currently destroying value despite improving profitability trends. The dividend yield of 4.98% adds income appeal, but overall, operational margins remain the primary strength in this scenario.
Weaknesses and Drawbacks
Kimco is in financial distress with an Altman Z-Score of 1.31, signaling a high bankruptcy risk. This solvency warning overshadows other metrics. The company’s current and quick ratios are critically weak at 0, raising liquidity concerns. While debt-to-equity at 0.81 appears moderate, interest expense consumes 19.04% of earnings, pressuring cash flow. Valuation metrics show a mixed picture: P/E is neutral at 23.39, but P/B is favorable at 1.31. Market demand is strong with buyer dominance at 71.12%, yet the distress zone status is a red flag.
Our Final Verdict about Kimco Realty Corporation
Despite positive operational margins and a bullish stock trend, Kimco’s financial distress marked by a Z-Score of 1.31 makes the investment profile highly speculative. The solvency risk outweighs profitability gains, suggesting the stock may be too risky for conservative capital. Investors might consider waiting for a clearer improvement in financial health before committing significant capital.
Disclaimer: This content is for informational purposes only and does not constitute financial, investment, or other professional advice. Investing in financial markets involves a significant risk of loss, and past performance is not indicative of future results.
Additional Resources
- Decoding Kimco Realty Corp (KIM): A Strategic SWOT Insight – GuruFocus (Feb 21, 2026)
- Why Kimco Realty (KIM) is a Top Dividend Stock for Your Portfolio – Yahoo Finance (Feb 20, 2026)
- Aberdeen Group plc Increases Position in Kimco Realty Corporation $KIM – MarketBeat (Feb 19, 2026)
- Kimco Realty: High-Quality REIT With Better Value In The Preferreds (NYSE:KIM) – Seeking Alpha (Feb 19, 2026)
- Kimco Realty (KIM) Upgraded to Buy: Here’s What You Should Know – Nasdaq (Feb 20, 2026)
For more information about Kimco Realty Corporation, please visit the official website: kimcorealty.com