Home > Analyses > Consumer Defensive > Kimberly-Clark Corporation
Kimberly-Clark shapes daily life through trusted personal care and tissue products found in millions of homes worldwide. Its iconic brands—Huggies, Kleenex, Kotex—set industry standards for quality and innovation. As a stalwart in consumer essentials, Kimberly-Clark balances tradition with forward-thinking product development. The key question for investors: Does its resilient market position still support attractive growth and valuation in today’s evolving consumer landscape?

Table of contents
Business Model & Company Overview
Kimberly-Clark Corporation, founded in 1872 and headquartered in Dallas, TX, dominates the household and personal products industry. It delivers a cohesive ecosystem of trusted brands across personal care, consumer tissue, and professional segments. This integrated portfolio fuels everyday hygiene and comfort for millions globally under iconic names like Huggies, Kleenex, and Kotex.
The company’s revenue engine blends durable consumer staples and recurring purchases through diverse channels, including supermarkets and e-commerce, across the Americas, Europe, and Asia. Its balanced mix of personal care and tissue products creates steady cash flow. Kimberly-Clark’s enduring brand equity and distribution scale form a formidable economic moat, shaping the future of essential care products worldwide.
Financial Performance & Fundamental Metrics
I analyze Kimberly-Clark Corporation’s income statement, key financial ratios, and dividend payout policy to assess its profitability, efficiency, and shareholder returns.
Income Statement
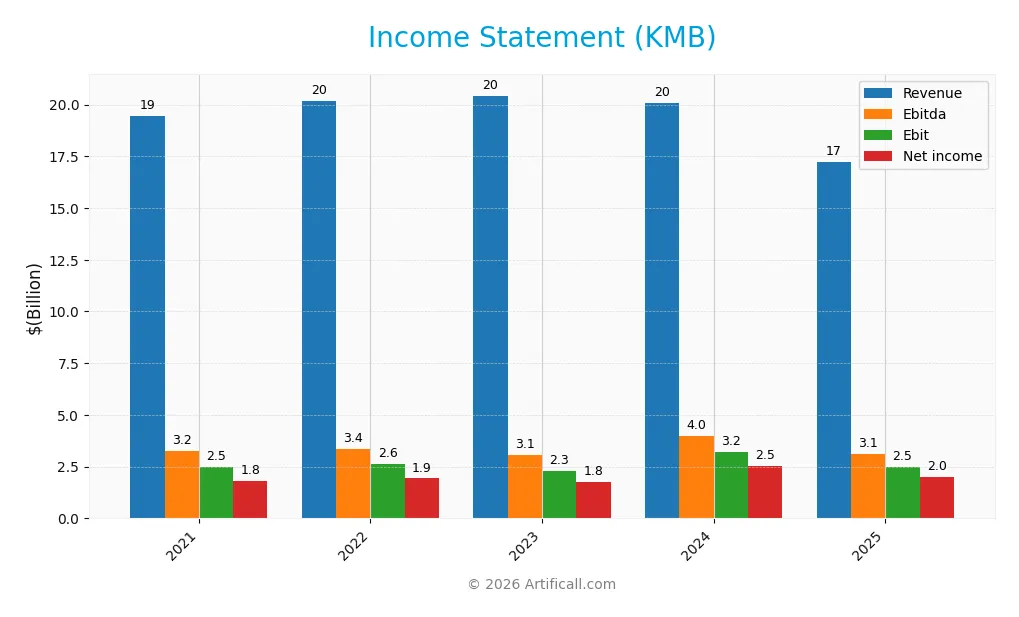
The table below presents Kimberly-Clark Corporation’s key income statement figures for fiscal years 2021 through 2025, reflecting revenue, expenses, profits, and earnings per share.
| 2021 | 2022 | 2023 | 2024 | 2025 | |
|---|---|---|---|---|---|
| Revenue | 19.4B | 20.2B | 20.4B | 20.1B | 17.2B |
| Cost of Revenue | 13.5B | 14.0B | 13.4B | 12.9B | 11.1B |
| Operating Expenses | 3.4B | 3.5B | 4.7B | 4.0B | 3.6B |
| Gross Profit | 6.0B | 6.2B | 7.0B | 7.2B | 6.1B |
| EBITDA | 3.2B | 3.4B | 3.1B | 4.0B | 3.1B |
| EBIT | 2.5B | 2.6B | 2.3B | 3.2B | 2.5B |
| Interest Expense | 256M | 282M | 293M | 270M | 256M |
| Net Income | 1.8B | 1.9B | 1.8B | 2.5B | 2.0B |
| EPS | 5.38 | 5.73 | 5.21 | 7.58 | 6.08 |
| Filing Date | 2022-02-10 | 2023-02-09 | 2024-02-08 | 2025-02-13 | 2026-02-12 |
Income Statement Evolution
Kimberly-Clark’s revenue declined by 11.4% from 2021 to 2025, with a sharper 14.2% drop in 2025 alone. Net income, however, grew 11.4% over the period, supported by a 25.8% expansion in net margin. Gross and EBIT margins remain favorable at 35.6% and 14.5%, respectively, despite last year’s margin compression.
Is the Income Statement Favorable?
In 2025, Kimberly-Clark reported $17.2B revenue, down 14.2% year-over-year, and $2.02B net income, down 20%. Margins stayed solid with an 11.7% net margin and a 1.5% interest expense ratio, reflecting disciplined cost control. The income statement shows mixed signals: strong profitability but recent top-line weakness, resulting in a neutral overall assessment.
Financial Ratios
The following table summarizes Kimberly-Clark Corporation’s key financial ratios for the fiscal years 2021 through 2025:
| Ratios | 2021 | 2022 | 2023 | 2024 | 2025 |
|---|---|---|---|---|---|
| Net Margin | 9.3% | 9.6% | 8.6% | 12.7% | 11.7% |
| ROE | 3.53 | 3.54 | 1.93 | 3.03 | 1.24 |
| ROIC | 17.2% | 18.2% | 16.4% | 25.3% | 17.6% |
| P/E | 26.6 | 23.7 | 23.3 | 17.4 | 16.6 |
| P/B | 93.8 | 83.7 | 45.0 | 52.6 | 20.6 |
| Current Ratio | 0.82 | 0.78 | 0.82 | 0.80 | 0.75 |
| Quick Ratio | 0.49 | 0.47 | 0.54 | 0.54 | 0.54 |
| D/E | 16.9 | 15.6 | 8.9 | 9.4 | 4.4 |
| Debt-to-Assets | 48.8% | 47.6% | 46.8% | 47.8% | 41.6% |
| Interest Coverage | 10.0 | 9.5 | 8.0 | 11.9 | 9.7 |
| Asset Turnover | 1.09 | 1.12 | 1.18 | 1.21 | 1.00 |
| Fixed Asset Turnover | 2.40 | 2.56 | 2.58 | 2.67 | 2.54 |
| Dividend Yield | 3.1% | 3.4% | 3.9% | 3.7% | 4.9% |
Evolution of Financial Ratios
Return on Equity (ROE) showed volatility, peaking above 3% in 2022-24, then falling sharply to 1.24% in 2025. The Current Ratio declined steadily from 0.82 in 2021 to 0.75 in 2025, indicating tighter liquidity. Debt-to-Equity Ratio improved from an extreme 16.9 in 2021 to 4.4 in 2025, reflecting a moderate deleveraging trend. Profitability margins stabilized around 11-12% net margin by 2025.
Are the Financial Ratios Favorable?
In 2025, profitability ratios such as net margin (11.74%) and ROE (123.99%, likely a data anomaly) were favorable, supported by a strong return on invested capital (17.62%) above the WACC (4.67%). Liquidity ratios (Current Ratio 0.75, Quick Ratio 0.54) remain unfavorable, signaling potential short-term risk. Leverage is high with a Debt-to-Equity of 4.4, rated unfavorable, while interest coverage (9.73) is comfortable. Market valuations show mixed signals: PE ratio neutral at 16.63, but Price-to-Book ratio at 20.62 is unfavorable. Overall, the financial ratios appear slightly favorable with caution on liquidity and leverage.
Shareholder Return Policy
Kimberly-Clark maintains a steady dividend payout, with a payout ratio around 82% in 2025 and a yield near 4.9%. Dividend coverage by free cash flow remains adequate, and the company continues share buybacks, supporting shareholder returns.
This payout policy aligns with sustainable long-term value creation, balancing cash distribution and reinvestment needs. However, the relatively high payout ratio suggests limited flexibility during downturns. The ongoing buybacks complement dividends, enhancing capital return without overleveraging.
Score analysis
The following radar chart summarizes Kimberly-Clark Corporation’s key financial scores across valuation and profitability metrics:
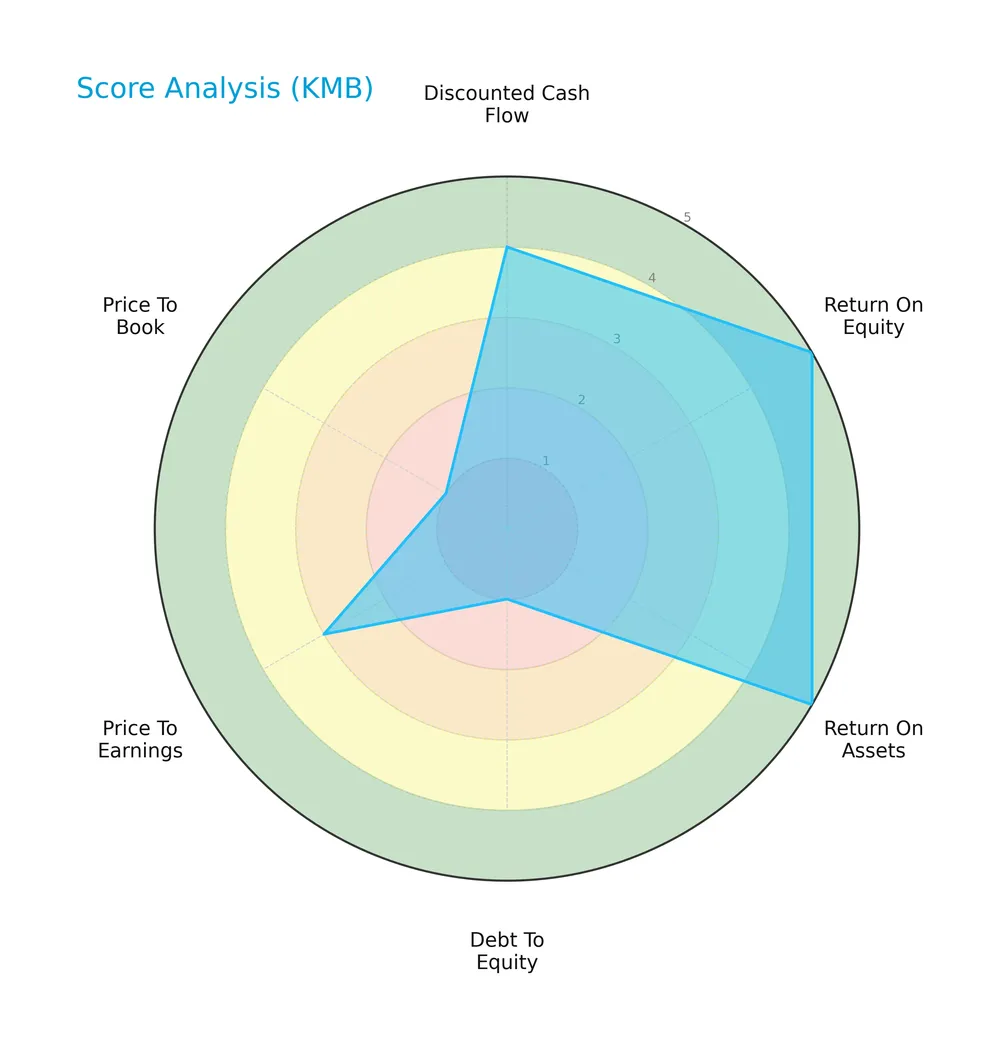
The company scores very favorably on return on equity and assets, reflecting strong profitability. Discounted cash flow is favorable, but debt-to-equity and price-to-book ratios are very unfavorable, signaling leverage and valuation concerns. Price-to-earnings is moderate.
Analysis of the company’s bankruptcy risk
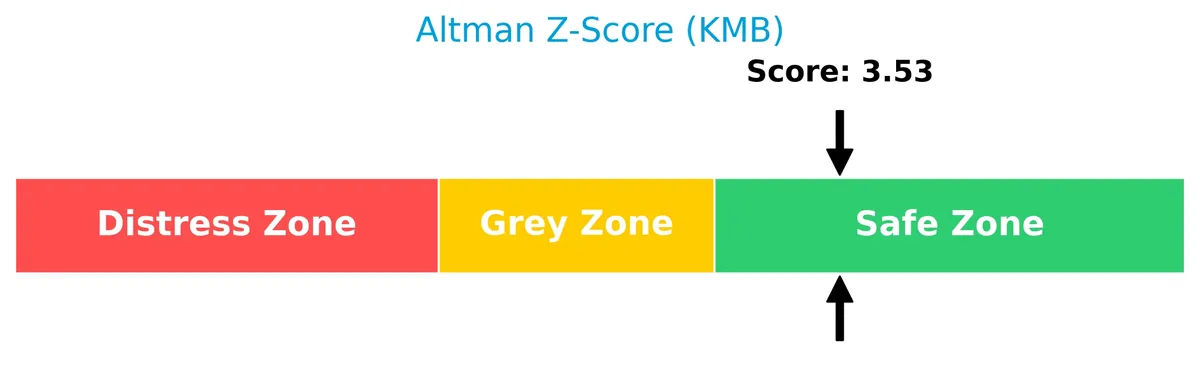
Kimberly-Clark’s Altman Z-Score places it firmly in the safe zone, indicating a low risk of bankruptcy and solid financial stability:
Is the company in good financial health?
The Piotroski Score diagram highlights Kimberly-Clark’s strong financial health, scoring 7 out of 9 based on profitability, leverage, liquidity, and operational efficiency:
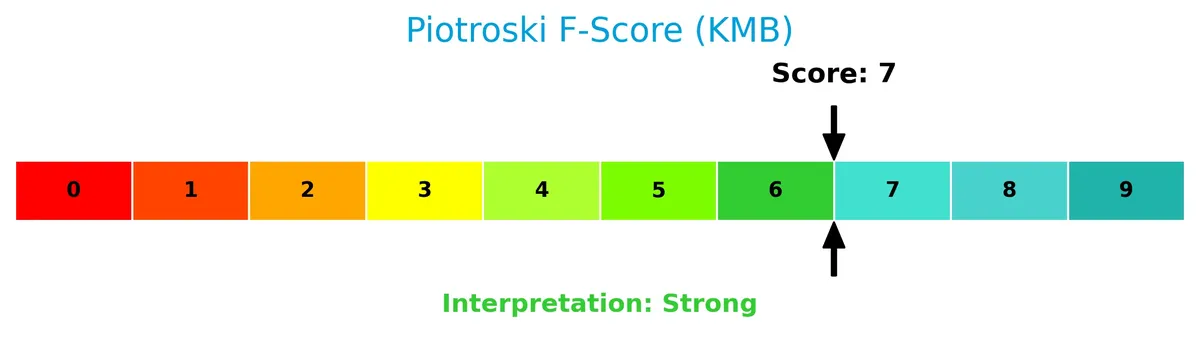
A score of 7 suggests robust financial strength, positioning the company well above average in managing its balance sheet and earnings quality.
Competitive Landscape & Sector Positioning
This analysis explores Kimberly-Clark’s strategic positioning, revenue segments, products, and competitors in household and personal products. I will assess whether Kimberly-Clark holds a competitive advantage against its main rivals.
Strategic Positioning
Kimberly-Clark concentrates its portfolio in three segments: Personal Care (~$10.7B), Consumer Tissue (~$6.2B), and K-C Professional (~$3.4B). Its geographic revenue is diversified, with significant exposure in the US (~$10.5B), Asia/Latin America/Other (~$7.9B), and Europe (~$3.2B), reflecting broad market reach.
Revenue by Segment
The pie chart illustrates Kimberly-Clark Corporation’s revenue breakdown by segment for fiscal year 2023, highlighting key business drivers and their contribution to total sales.
In 2023, Personal Care leads with $10.7B, driving the bulk of revenue. Consumer Tissue and K-C Professional follow with $6.3B and $3.4B, respectively. The Personal Care segment shows steady growth, while Consumer Tissue dipped slightly from prior years. K-C Professional remains stable, underscoring balanced diversification but with clear reliance on Personal Care for growth momentum.
Key Products & Brands
The table below outlines Kimberly-Clark Corporation’s main products and their brand portfolios:
| Product | Description |
|---|---|
| Personal Care | Disposable diapers, training and youth pants, baby wipes, feminine and incontinence care products under brands like Huggies, Pull-Ups, Kotex, Depend, and Poise. |
| Consumer Tissue | Facial and bathroom tissues, paper towels, napkins, and related products marketed under Kleenex, Scott, Cottonelle, Viva, Andrex, and Neve. |
| K-C Professional | Wipers, tissues, towels, apparel, soaps, and sanitizers for commercial use under Kleenex, Scott, WypAll, Kimtech, and KleenGuard brands. |
Kimberly-Clark’s product lineup spans consumer and professional segments, anchored by globally recognized brands. Personal Care consistently generates the largest revenue share, followed by Consumer Tissue and K-C Professional.
Main Competitors
Seventeen competitors operate in the Household & Personal Products industry; the table shows the top 10 leaders by market capitalization:
| Competitor | Market Cap. |
|---|---|
| The Procter & Gamble Company | 331B |
| Unilever PLC | 143B |
| Colgate-Palmolive Company | 63B |
| The Estée Lauder Companies Inc. | 38B |
| Kimberly-Clark Corporation | 34B |
| Kenvue Inc. | 33B |
| Church & Dwight Co., Inc. | 20B |
| The Clorox Company | 12B |
| e.l.f. Beauty, Inc. | 4.3B |
| Inter Parfums, Inc. | 2.7B |
Kimberly-Clark ranks 5th among 17 competitors, with a market cap at 10.84% of the leader, Procter & Gamble. It stands below the average market cap of the top 10 (68B) but above the sector median (4.3B). The 7.11% gap to the next competitor above, Estée Lauder, indicates moderate competitive proximity.
Comparisons with competitors
Check out how we compare the company to its competitors:
Does Kimberly-Clark have a competitive advantage?
Kimberly-Clark demonstrates a very favorable competitive advantage, evidenced by a ROIC exceeding WACC by nearly 13%, signaling consistent value creation. Its growing ROIC trend confirms efficient capital allocation and rising profitability.
Looking ahead, Kimberly-Clark’s established brands across personal care and consumer tissue position it well for continued market presence. Expansion opportunities exist via emerging markets and innovation in hygiene products, supporting sustainable growth potential.
SWOT Analysis
This SWOT analysis highlights Kimberly-Clark’s key strategic factors to guide informed investment decisions.
Strengths
- strong brand portfolio
- favorable net margin of 11.74%
- very favorable moat with growing ROIC
- robust dividend yield at 4.94%
Weaknesses
- declining revenue growth over recent years
- unfavorable liquidity ratios (current ratio 0.75, quick ratio 0.54)
- high debt-to-equity ratio of 4.4
Opportunities
- expanding emerging markets exposure
- innovation in sustainable personal care products
- growth in e-commerce channels
Threats
- intense competition in consumer products
- raw material cost volatility
- currency fluctuations impacting global sales
Kimberly-Clark maintains a durable competitive advantage and strong profitability but faces pressure from declining top-line growth and liquidity constraints. Strategic focus should prioritize revenue revitalization and debt management to harness growth opportunities while mitigating risks.
Stock Price Action Analysis
The weekly stock chart for Kimberly-Clark Corporation (KMB) shows price movements and volume trends over the past 12 months:
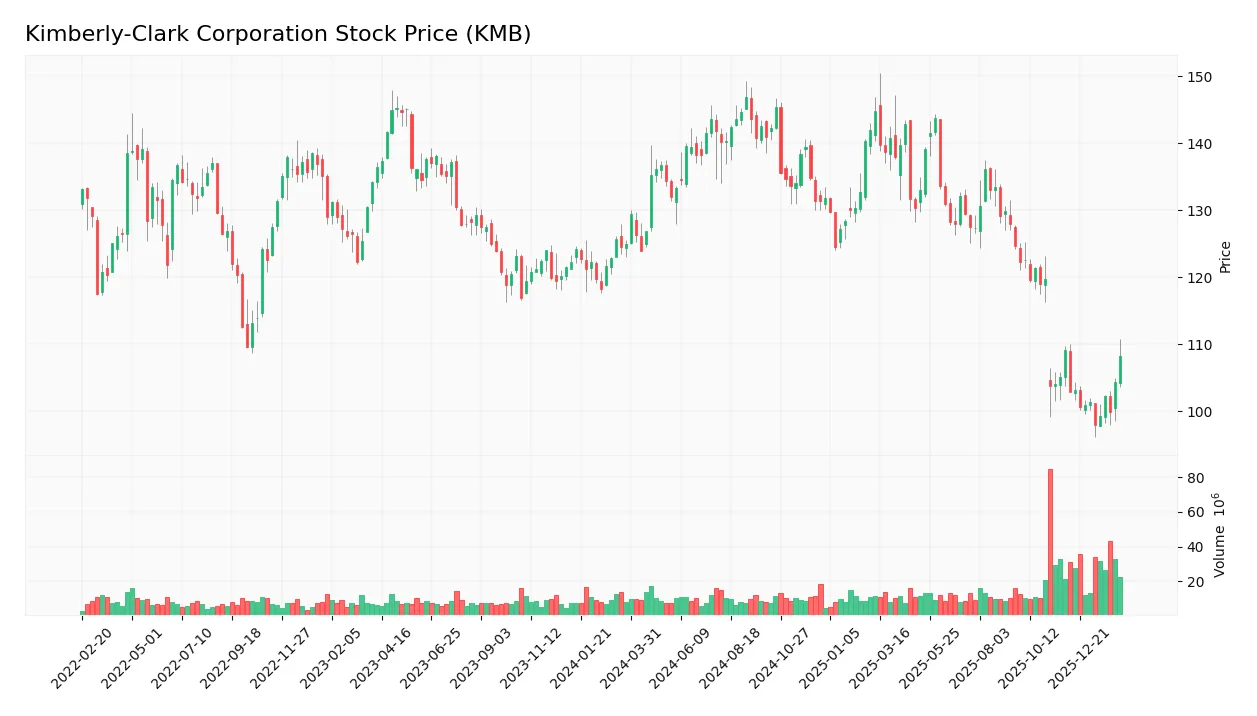
Trend Analysis
Over the past 12 months, KMB stock declined by 13.34%, signaling a bearish trend with accelerating downward momentum. Price volatility is elevated, with a 12.9 standard deviation. The stock peaked at 146.91 and bottomed at 97.92, confirming a significant downtrend.
Volume Analysis
Trading volume is increasing, with buyers accounting for 53.04% overall. In the recent three months, buyer dominance rose to 56.72%, indicating slightly buyer-driven activity. This suggests cautious optimism amid the broader bearish price trend and growing market participation.
Target Prices
Analysts set a clear target consensus for Kimberly-Clark Corporation, reflecting moderate upside potential.
| Target Low | Target High | Consensus |
|---|---|---|
| 102 | 162 | 122.38 |
The target range spans from 102 to 162, with a consensus near 122, indicating cautious optimism among analysts.

Don’t Let Luck Decide Your Entry Point
Optimize your entry points with our advanced ProRealTime indicators. You’ll get efficient buy signals with precise price targets for maximum performance. Start outperforming now!
Analyst & Consumer Opinions
I present an overview of Kimberly-Clark Corporation’s analyst ratings and consumer feedback to gauge market sentiment.
Stock Grades
Here are the latest verified stock grades for Kimberly-Clark Corporation from established financial firms:
| Grading Company | Action | New Grade | Date |
|---|---|---|---|
| UBS | Maintain | Neutral | 2026-01-28 |
| UBS | Maintain | Neutral | 2026-01-14 |
| Citigroup | Maintain | Sell | 2026-01-14 |
| TD Cowen | Maintain | Hold | 2026-01-08 |
| Wells Fargo | Maintain | Equal Weight | 2026-01-05 |
| Citigroup | Maintain | Sell | 2025-12-17 |
| BNP Paribas Exane | Maintain | Neutral | 2025-12-01 |
| Argus Research | Upgrade | Buy | 2025-11-13 |
| Morgan Stanley | Maintain | Equal Weight | 2025-11-04 |
| Wells Fargo | Maintain | Equal Weight | 2025-11-04 |
The consensus leans toward a Hold rating, with a notable balance between neutral and hold grades. Sell ratings persist from Citigroup, while Argus Research recently upgraded to Buy, indicating mixed sentiment.
Consumer Opinions
Consumers express a mix of admiration and frustration toward Kimberly-Clark Corporation’s products, reflecting strong brand loyalty alongside areas for improvement.
| Positive Reviews | Negative Reviews |
|---|---|
| “Consistently reliable quality in hygiene products.” | “Prices have increased noticeably over the past year.” |
| “Soft and durable paper towels and tissues.” | “Packaging could be more sustainable and eco-friendly.” |
| “Wide availability in stores and online.” | “Some products feel overpriced compared to competitors.” |
Overall, consumers praise Kimberly-Clark’s product quality and availability. However, rising prices and environmental concerns about packaging frequently appear as drawbacks.
Risk Analysis
Below is a table summarizing Kimberly-Clark’s key risks, their probability, and impact on the company’s outlook:
| Category | Description | Probability | Impact |
|---|---|---|---|
| Liquidity Risk | Current ratio at 0.75 signals weaker short-term liquidity | High | Moderate |
| Leverage Risk | Debt-to-equity ratio of 4.4 indicates significant financial leverage | Medium | High |
| Valuation Risk | Price-to-book ratio of 20.62 suggests potential overvaluation | Medium | Moderate |
| Market Risk | Low beta (0.277) reduces sensitivity to market swings | Low | Low |
| Operational Risk | Dependence on consumer staples amid inflationary pressures | Medium | Moderate |
Kimberly-Clark’s most pressing risks are its high leverage and weak liquidity, which could constrain flexibility during economic downturns. Despite a safe Altman Z-score of 3.53, the debt-to-equity ratio of 4.4 stands out as a red flag. The company’s elevated price-to-book multiple increases valuation risk relative to the sector. These factors require cautious monitoring despite favorable profitability and dividend yield.
Should You Buy Kimberly-Clark Corporation?
Kimberly-Clark appears to be a robust value creator with a durable competitive moat, supported by a growing ROIC well above WACC. Despite a challenging leverage profile, its overall rating of B+ suggests a generally favorable but cautious investment appeal.
Strength & Efficiency Pillars
Kimberly-Clark Corporation showcases robust profitability with a net margin of 11.74% and an exceptional return on equity of 123.99%. Its return on invested capital (ROIC) stands at 17.62%, significantly outpacing the weighted average cost of capital (WACC) of 4.67%, signaling clear value creation. The company maintains a favorable interest coverage ratio of 9.73, underscoring operational resilience. Historically in consumer staples, such metrics reflect strong operational efficiency and disciplined capital allocation, reinforcing Kimberly-Clark’s sustainable competitive advantage.
Weaknesses and Drawbacks
Despite solid profitability, Kimberly-Clark’s valuation and leverage present notable risks. The company’s price-to-book ratio is an unfavorable 20.62, indicating potential overvaluation relative to net assets. Moreover, a high debt-to-equity ratio of 4.4 signals elevated financial leverage, which could constrain flexibility during market stress. Liquidity concerns arise from a current ratio of 0.75 and quick ratio of 0.54, both below the safe threshold of 1.0. These factors raise caution, particularly as the stock has experienced a bearish trend with a 13.34% decline overall, despite recent slight buyer dominance.
Our Final Verdict about Kimberly-Clark Corporation
Kimberly-Clark’s profile appears attractive for long-term exposure due to its strong fundamental profitability and value creation. However, the recent bearish price trend and high leverage suggest a cautious stance. Investors might consider waiting for improved market momentum or balance sheet deleveraging before increasing exposure. The company’s strong Piotroski score of 7 supports operational strength, but valuation and liquidity risks temper enthusiasm. Overall, Kimberly-Clark could offer potential, but risks warrant careful monitoring.
Disclaimer: This content is for informational purposes only and does not constitute financial, investment, or other professional advice. Investing in financial markets involves a significant risk of loss, and past performance is not indicative of future results.
Additional Resources
- Kimberly-Clark: Bigger Is Not Likely The Answer (NASDAQ:KMB) – Seeking Alpha (Feb 12, 2026)
- Kimberly-Clark Corporation (KMB) Receives Boost on Kenvue Acquisition Push as Evercore ISI Warns of Competition Pressure – Yahoo! Finance Canada (Feb 12, 2026)
- Illinois Municipal Retirement Fund Acquires 33,829 Shares of Kimberly-Clark Corporation $KMB – MarketBeat (Feb 12, 2026)
- KIMBERLY CLARK CORP SEC 10-K Report – TradingView (Feb 12, 2026)
- Kimberly-Clark Reports Strong Finish to Second Year of Transformation – PR Newswire (Jan 27, 2026)
For more information about Kimberly-Clark Corporation, please visit the official website: kimberly-clark.com