Home > Analyses > Technology > Keysight Technologies, Inc.
Keysight Technologies, Inc. powers the invisible backbone of modern technology, enabling breakthroughs in communications, aerospace, automotive, and semiconductor industries. Renowned for its cutting-edge electronic design and test solutions, Keysight leads with innovation, delivering precision instruments and software that drive quality and efficiency worldwide. As the company navigates evolving tech demands and competitive pressures, the critical question remains: do its strong fundamentals and market position still support its growth potential and valuation?

Table of contents
Business Model & Company Overview
Keysight Technologies, Inc., founded in 1939 and headquartered in Santa Rosa, California, stands as a leading provider in electronic design and test solutions. Its comprehensive ecosystem serves diverse sectors including communications, aerospace, automotive, and semiconductor industries. By integrating hardware and software solutions, Keysight supports innovation and efficiency across the product lifecycle, reinforcing its dominant position in the Hardware, Equipment & Parts industry.
The company’s revenue engine blends sophisticated hardware like oscilloscopes and multimeters with advanced software and recurring services such as design verification and technical support. Keysight maintains a strategic global footprint, reaching customers across the Americas, Europe, and Asia Pacific. This balanced portfolio and international presence form a robust economic moat, positioning Keysight as a pivotal force shaping the future of electronic test and measurement.
Financial Performance & Fundamental Metrics
In this section, I analyze Keysight Technologies, Inc.’s income statement, key financial ratios, and dividend payout policy to assess its financial health and investment potential.
Income Statement
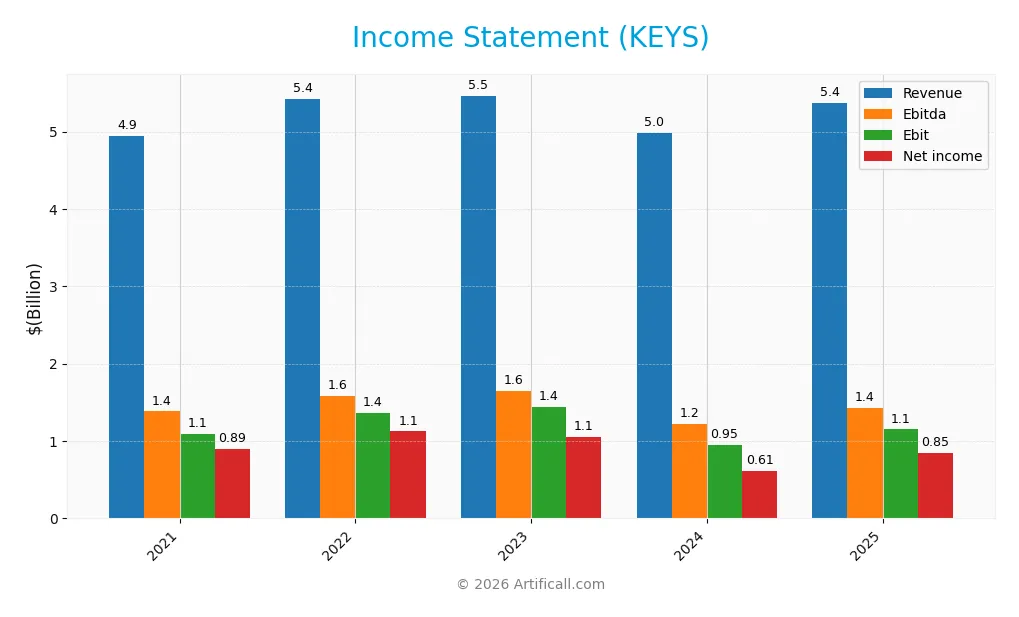
The table below presents Keysight Technologies, Inc.’s annual income statement figures for fiscal years 2021 through 2025, expressed in USD.
| 2021 | 2022 | 2023 | 2024 | 2025 | |
|---|---|---|---|---|---|
| Revenue | 4.94B | 5.42B | 5.46B | 4.98B | 5.38B |
| Cost of Revenue | 1.87B | 1.97B | 1.93B | 1.85B | 2.04B |
| Operating Expenses | 1.99B | 2.12B | 2.17B | 2.30B | 2.39B |
| Gross Profit | 3.07B | 3.45B | 3.53B | 3.13B | 3.34B |
| EBITDA | 1.38B | 1.59B | 1.65B | 1.22B | 1.43B |
| EBIT | 1.09B | 1.36B | 1.44B | 949M | 1.15B |
| Interest Expense | 79M | 79M | 78M | 84M | 96M |
| Net Income | 894M | 1.12B | 1.06B | 614M | 846M |
| EPS | 4.83 | 6.24 | 5.94 | 3.53 | 4.90 |
| Filing Date | 2021-12-17 | 2022-12-15 | 2023-12-15 | 2024-12-17 | 2025-12-17 |
Income Statement Evolution
From 2021 to 2025, Keysight Technologies showed a generally favorable revenue growth trend with an 8.78% increase over the period, although the net income declined by 5.37%. Revenue growth was steady but modest at 7.95% in the last year. Margins demonstrated strength, with a gross margin of 62.08% and an EBIT margin of 21.4%, both marked as favorable, though net margin saw a slight overall decline.
Is the Income Statement Favorable?
The 2025 income statement reflects solid fundamentals with a net income of $846M and a net margin of 15.74%, both favorable. Operating performance improved markedly, evidenced by a 21.18% rise in EBIT and a 27.63% increase in net margin year-on-year. EPS grew strongly by 39.03%, underscoring effective cost management and profitability despite some challenges in net income over the longer term. Overall, the income statement is viewed as favorable.
Financial Ratios
The table below presents key financial ratios for Keysight Technologies, Inc. over the fiscal years 2021 to 2025, offering a snapshot of profitability, valuation, liquidity, leverage, and operational efficiency:
| Ratios | 2021 | 2022 | 2023 | 2024 | 2025 |
|---|---|---|---|---|---|
| Net Margin | 18% | 21% | 19% | 12% | 16% |
| ROE | 24% | 27% | 23% | 12% | 14% |
| ROIC | 15% | 17% | 15% | 7% | 8% |
| P/E | 37.5 | 27.9 | 20.6 | 42.2 | 37.4 |
| P/B | 8.9 | 7.5 | 4.7 | 5.1 | 5.4 |
| Current Ratio | 2.93 | 3.01 | 2.35 | 2.98 | 2.35 |
| Quick Ratio | 2.34 | 2.40 | 1.87 | 2.27 | 1.78 |
| D/E | 0.53 | 0.48 | 0.44 | 0.40 | 0.51 |
| Debt-to-Assets | 26% | 25% | 23% | 22% | 26% |
| Interest Coverage | 13.7 | 16.9 | 17.4 | 9.9 | 9.9 |
| Asset Turnover | 0.64 | 0.67 | 0.63 | 0.54 | 0.48 |
| Fixed Asset Turnover | 5.63 | 5.96 | 5.54 | 4.94 | 5.21 |
| Dividend Yield | 0% | 0% | 0% | 0% | 0% |
Evolution of Financial Ratios
Over the recent fiscal years, Keysight Technologies, Inc. displayed a declining trend in Return on Equity (ROE), dropping from 27.0% in 2022 to 14.4% in 2025, indicating reduced profitability efficiency. The Current Ratio showed some volatility, peaking near 3.0 in 2022-2024 before moderating to 2.35 in 2025, signaling a slight decrease in liquidity. The Debt-to-Equity Ratio remained relatively stable around 0.40-0.53, suggesting consistent leverage management.
Are the Financial Ratios Favorable?
In 2025, profitability metrics such as net margin (15.74%) are favorable, yet ROE (14.4%) and return on invested capital (8.02%) are neutral, reflecting moderate earnings relative to equity and capital employed. Liquidity ratios like Current Ratio (2.35) and Quick Ratio (1.78) are favorable, indicating solid short-term financial health. Debt levels appear balanced with a favorable debt-to-assets ratio (26.31%) and neutral debt-to-equity (0.51). Market valuation ratios, including a high price-to-earnings (37.41) and price-to-book (5.39), are unfavorable, while asset turnover (0.48) is also marked unfavorable, tempering overall efficiency impressions. The global evaluation rates the financial ratios as slightly favorable.
Shareholder Return Policy
Keysight Technologies, Inc. does not pay dividends, reflecting a reinvestment strategy likely focused on sustaining growth and innovation. The absence of dividend payments is consistent across recent years, with no dividend yield or payout ratio reported.
The company does not disclose share buyback programs in the provided data. This lack of direct shareholder distributions suggests a prioritization of capital allocation toward long-term value creation, potentially through R&D and operational investments, supporting sustainable shareholder returns over time.
Score analysis
The following radar chart presents a comprehensive view of Keysight Technologies, Inc.’s key financial performance scores:
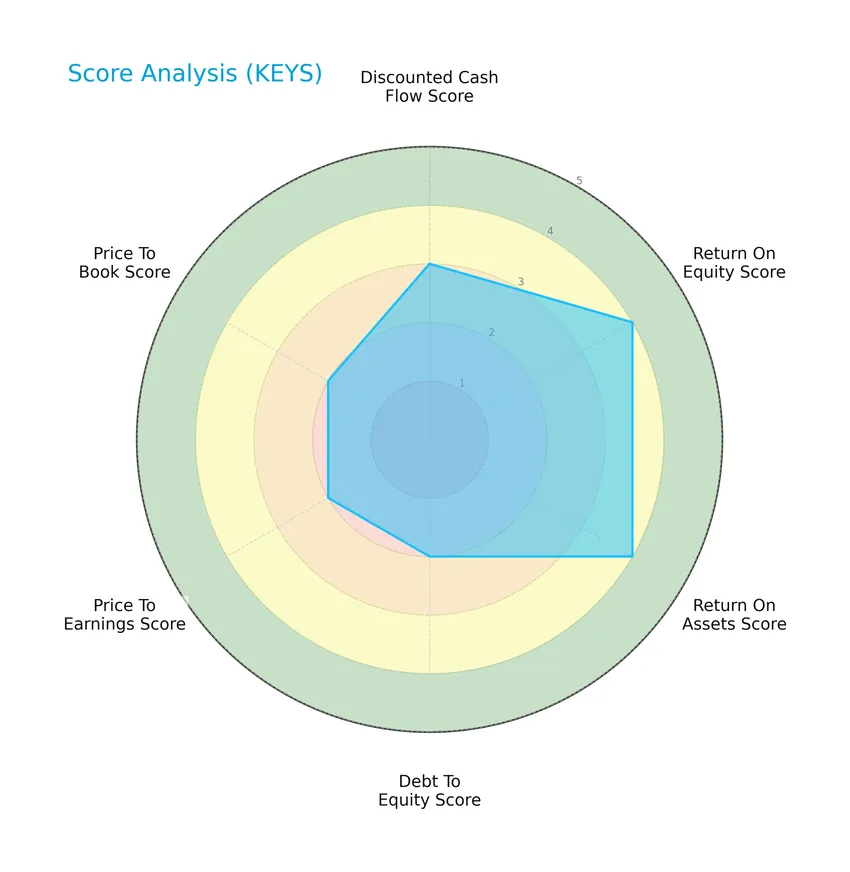
Keysight’s scores reveal moderate valuation metrics with discounted cash flow, debt-to-equity, price-to-earnings, and price-to-book scores at 2 or 3. Profitability indicators such as return on equity and return on assets are favorable, both scoring 4, reflecting solid operational efficiency.
Analysis of the company’s bankruptcy risk
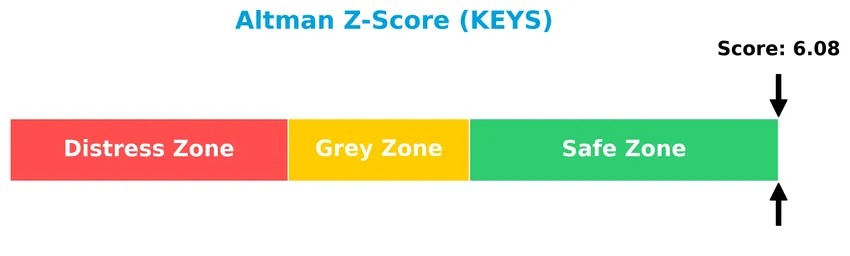
The Altman Z-Score places Keysight Technologies comfortably in the safe zone, indicating a low risk of bankruptcy and solid financial stability:
Is the company in good financial health?
The Piotroski Score diagram below illustrates Keysight Technologies’ financial health assessment based on nine criteria:

With a Piotroski Score of 4, Keysight shows average financial health. This score suggests moderate strength in profitability, leverage, liquidity, and operational efficiency, indicating room for improvement.
Competitive Landscape & Sector Positioning
This sector analysis will examine Keysight Technologies, Inc.’s strategic positioning, revenue by segment, key products, main competitors, competitive advantages, and SWOT analysis. I will assess whether the company holds a competitive advantage over its peers in the hardware, equipment, and parts industry.
Strategic Positioning
Keysight Technologies, Inc. operates with a diversified product portfolio across two main segments: Communications Solutions Group ($3.42B in 2024) and Electronic Industrial Solutions Group ($1.56B). Geographically, revenue is balanced among Americas ($2.06B), Asia Pacific ($1.99B), and Europe ($0.93B), reflecting broad global exposure in technology hardware and test solutions.
Revenue by Segment
This pie chart illustrates Keysight Technologies’ revenue distribution by segment for the fiscal year 2024, highlighting the company’s primary sources of income.
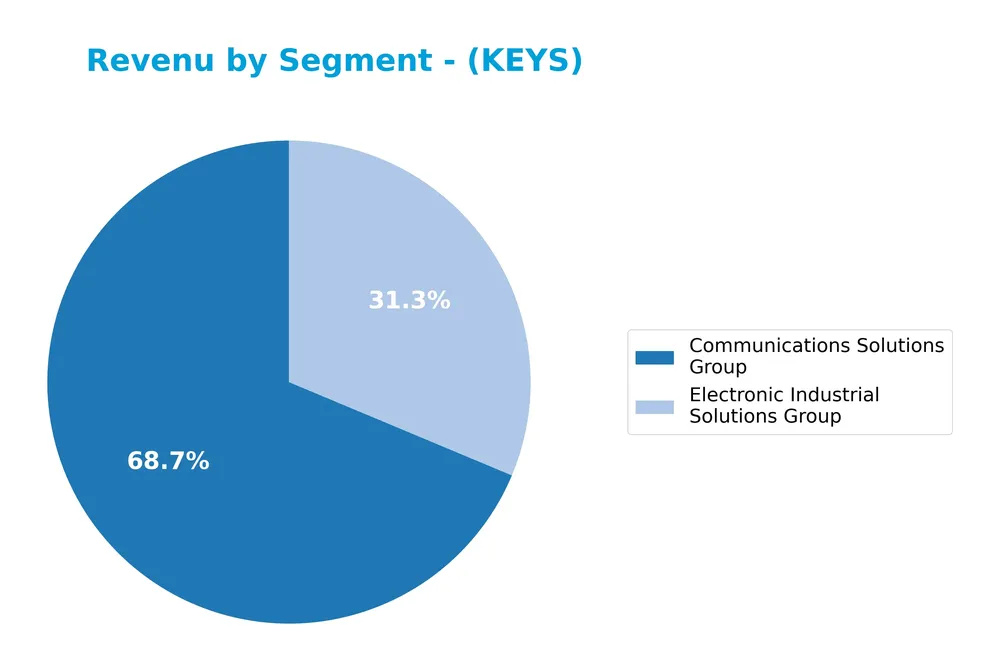
In 2024, Keysight’s revenue was predominantly driven by the Communications Solutions Group, generating $3.42B, followed by the Electronic Industrial Solutions Group at $1.56B. The Communications segment continues to lead but experienced a revenue decline from $3.68B in 2023, indicating a slowdown. Meanwhile, the Electronic Industrial Solutions Group also saw a decrease from $1.78B. This shift suggests a mild contraction in key segments, raising attention to potential concentration risks if diversification does not improve.
Key Products & Brands
The table below presents Keysight Technologies’ main products and brands with concise descriptions:
| Product | Description |
|---|---|
| Communications Solutions Group | Electronic design automation (EDA) software; RF and microwave test solutions; hardware and virtual network test platforms; oscilloscopes; logic analyzers; optical measurement devices; refurbished equipment resale. |
| Electronic Industrial Solutions Group | Design and verification tools; digital multimeters; function generators; frequency counters; data acquisition systems; audio analyzers; LCR meters; thermal imagers; source measure units; power supplies; printed-circuit-board testers; integrated circuit parametric testers; test and measurement products and software. |
| Customer Support & Services | Product support, technical support, training, and consulting services. |
| Measurement Solutions | A broad range of test and measurement instruments and platforms (historical segment, last reported in 2015). |
Keysight Technologies offers extensive electronic design and test solutions across communications and industrial sectors, supported by comprehensive customer services.
Main Competitors
There are 20 competitors in total, with the table below listing the top 10 leaders by market capitalization:
| Competitor | Market Cap. |
|---|---|
| Amphenol Corporation | 171B |
| Corning Incorporated | 77.7B |
| TE Connectivity Ltd. | 68.6B |
| Sandisk Corporation | 40.0B |
| Garmin Ltd. | 38.9B |
| Keysight Technologies, Inc. | 35.5B |
| Celestica Inc. | 34.0B |
| Coherent, Inc. | 28.7B |
| Jabil Inc. | 25.7B |
| Teledyne Technologies Incorporated | 24.4B |
Keysight Technologies, Inc. ranks 6th among its top 10 competitors by market capitalization. Its market cap is approximately 21.4% of the leader, Amphenol Corporation. Keysight is positioned below the average market cap of the top 10 competitors (54.4B) but above the median market cap of its sector (21.6B). It maintains a 6.46% gap below the next competitor above, Garmin Ltd., indicating a moderate distance to its closest rival.
Comparisons with competitors
Check out how we compare the company to its competitors:
Does KEYS have a competitive advantage?
Keysight Technologies, Inc. currently does not present a competitive advantage, as its return on invested capital (ROIC) is below its weighted average cost of capital (WACC), indicating value destruction and declining profitability. The company’s ROIC trend over 2021-2025 is strongly negative, signaling worsening efficiency in capital use.
Looking ahead, Keysight serves diverse sectors including aerospace, defense, semiconductor, and automotive with advanced electronic design and test solutions, offering potential growth through innovation in hardware and software platforms. Expansion in emerging markets and new product lines could present future opportunities despite current challenges in value creation.
SWOT Analysis
This analysis highlights the key internal and external factors impacting Keysight Technologies, Inc., aiding investors in making informed decisions.
Strengths
- strong gross margin at 62%
- favorable EBIT margin at 21.4%
- diversified product portfolio across multiple industries
Weaknesses
- declining net income over 2021-2025
- high P/E ratio at 37.4 signaling possible overvaluation
- moderate Piotroski score indicating average financial strength
Opportunities
- growth in emerging markets, especially Asia Pacific
- increasing demand for advanced electronic test solutions
- expansion in automotive and aerospace sectors
Threats
- intense competition in technology hardware sector
- macroeconomic uncertainty impacting capital expenditure
- supply chain disruptions affecting production costs
Overall, Keysight benefits from solid profitability and diverse markets but faces challenges with value destruction and valuation concerns. Strategic focus on innovation and market expansion is essential to counterbalance these risks.
Stock Price Action Analysis
The weekly stock chart for Keysight Technologies, Inc. highlights price movements and volume trends over the analyzed period:
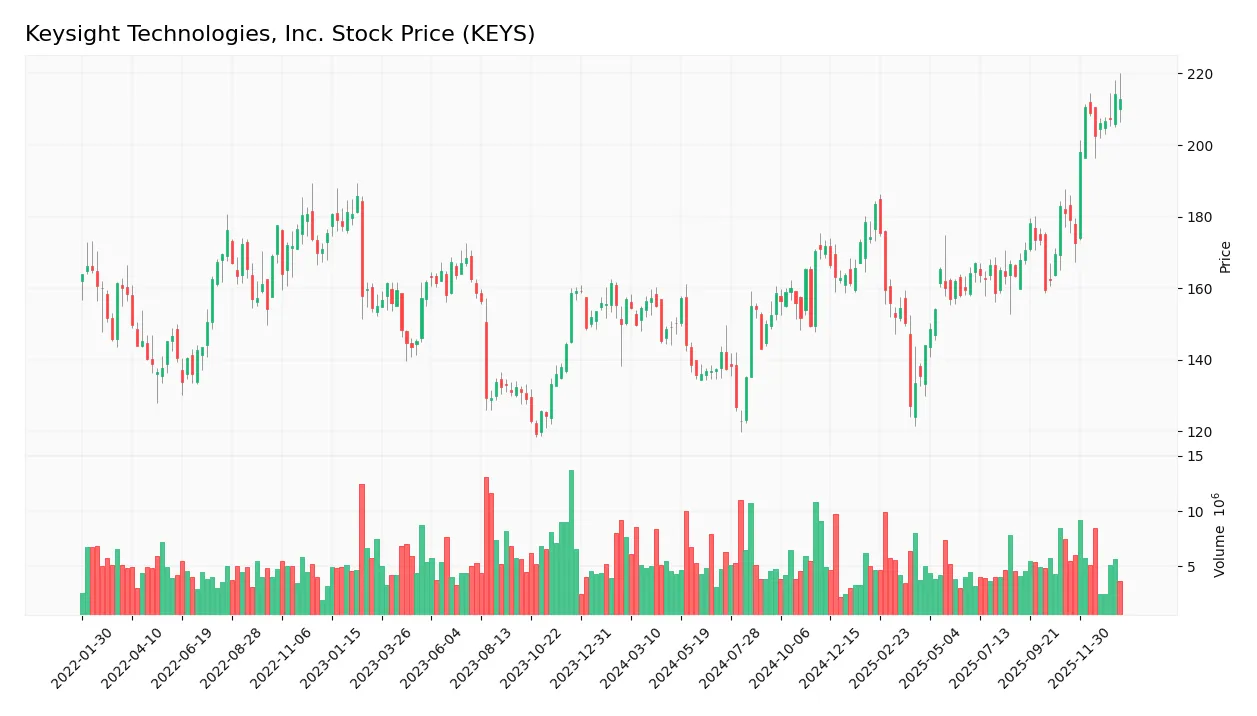
Trend Analysis
Over the past 12 months, KEYS stock price increased by 35.57%, indicating a bullish trend with acceleration. The stock traded between a low of 122.87 and a high of 214.2, showing notable upward momentum amid a standard deviation of 19.32. Recent weeks maintain this positive slope.
Volume Analysis
Trading volume for KEYS is decreasing overall, with buyers accounting for 54.76% of total volume historically. However, in the recent period, volume shows a slight seller dominance at 45.89% buyer share, suggesting cautious investor sentiment and moderated market participation.
Target Prices
The consensus target prices for Keysight Technologies, Inc. suggest a positive outlook among analysts.
| Target High | Target Low | Consensus |
|---|---|---|
| 243 | 210 | 226.5 |
Analysts expect the stock to trade between $210 and $243, with a consensus target near $226.5, indicating moderate upside potential.

Don’t Let Luck Decide Your Entry Point
Optimize your entry points with our advanced ProRealTime indicators. You’ll get efficient buy signals with precise price targets for maximum performance. Start outperforming now!
Analyst & Consumer Opinions
This section reviews the latest grades and consumer feedback regarding Keysight Technologies, Inc. (KEYS).
Stock Grades
Here is the latest summary of stock grades for Keysight Technologies, Inc. from recognized financial institutions:
| Grading Company | Action | New Grade | Date |
|---|---|---|---|
| Morgan Stanley | Maintain | Equal Weight | 2025-12-17 |
| Jefferies | Maintain | Hold | 2025-12-10 |
| Baird | Maintain | Outperform | 2025-11-26 |
| JP Morgan | Maintain | Overweight | 2025-11-25 |
| Citigroup | Maintain | Buy | 2025-11-25 |
| Jefferies | Maintain | Hold | 2025-11-25 |
| Morgan Stanley | Maintain | Equal Weight | 2025-11-25 |
| UBS | Maintain | Buy | 2025-11-25 |
| Wells Fargo | Maintain | Overweight | 2025-11-25 |
| Susquehanna | Maintain | Positive | 2025-11-25 |
The overall grades reflect a stable outlook with most firms maintaining their previous views, predominantly favoring a buy or overweight stance, indicating consistent confidence in the stock. No downgrade or upgrade actions were noted in the most recent updates.
Consumer Opinions
Consumer sentiment about Keysight Technologies, Inc. reflects a generally positive view of its innovation and product quality, alongside some concerns about pricing and customer support.
| Positive Reviews | Negative Reviews |
|---|---|
| “Keysight’s test equipment is highly reliable and accurate, essential for our R&D projects.” | “Customer service response times can be slow during peak periods.” |
| “The software interface is intuitive and greatly improves testing efficiency.” | “Some products are priced higher compared to competitors, impacting budget.” |
| “Excellent technical support from knowledgeable staff when issues arise.” | “Occasional delays in shipping and delivery affect project timelines.” |
Overall, consumers appreciate Keysight’s cutting-edge technology and dependable performance, while recurring concerns focus on pricing and customer service responsiveness.
Risk Analysis
Below is a table summarizing the key risks associated with investing in Keysight Technologies, Inc. (KEYS), highlighting their likelihood and potential impact:
| Category | Description | Probability | Impact |
|---|---|---|---|
| Market Valuation | High P/E of 37.41 and P/B of 5.39 indicate potential overvaluation, raising risk of price correction. | Medium | High |
| Competitive Pressure | Intense competition in hardware and test solutions sectors could affect market share and margins. | Medium | Medium |
| Technological Change | Rapid innovation demands continual investment in R&D; failure to keep pace could reduce competitiveness. | Medium | High |
| Economic Cycles | Exposure to global economic slowdowns may impact demand in aerospace, defense, and commercial sectors. | Medium | Medium |
| Dividend Policy | No dividend yield, limiting income appeal to some investors and possibly affecting stock attractiveness. | Low | Low |
| Financial Leverage | Moderate debt-to-equity ratio (0.51) and favorable interest coverage mitigate financial distress risk. | Low | Low |
The most significant risks for KEYS are its relatively high valuation multiples, which could lead to price volatility, and the need to maintain technological leadership amid fast innovation cycles. Despite these, its strong liquidity and safe Altman Z-Score (6.08) reduce bankruptcy risk considerably.
Should You Buy Keysight Technologies, Inc.?
Keysight Technologies appears to be a company with improving profitability and manageable leverage, yet its competitive moat could be seen as very unfavorable due to declining value creation. Despite this, the firm’s overall B rating and safe Altman Z-Score suggest moderate financial health and operational efficiency.
Strength & Efficiency Pillars
Keysight Technologies, Inc. exhibits solid profitability with a net margin of 15.74% and a return on equity (ROE) standing at 14.4%, reflecting moderate efficiency in generating shareholder returns. The company’s Altman Z-Score of 6.08 firmly places it in the safe zone, underscoring strong financial health and low bankruptcy risk. While the Piotroski Score is average at 4, operational metrics such as a favorable gross margin of 62.08% and a current ratio of 2.35 reinforce its liquidity and operational effectiveness. However, the return on invested capital (ROIC) at 8.02% slightly trails the weighted average cost of capital (WACC) of 8.93%, indicating that Keysight is currently not a value creator.
Weaknesses and Drawbacks
The valuation metrics present notable headwinds: a high price-to-earnings (P/E) ratio of 37.41 and price-to-book (P/B) ratio of 5.39 suggest the stock is trading at a premium, potentially limiting upside in a market correction. The company’s debt-to-equity ratio at 0.51 is moderate but warrants monitoring, especially given the slightly seller-dominant recent trading behavior where buyer dominance dropped to 45.89%, indicating short-term market pressure. Additionally, an unfavorable asset turnover ratio of 0.48 points to less efficient asset utilization, while the absence of dividend yield may deter income-focused investors.
Our Verdict about Keysight Technologies, Inc.
The company’s long-term fundamental profile may appear moderately favorable, supported by strong profitability and robust financial health, yet tempered by a lack of value creation as ROIC fails to exceed WACC. Despite a bullish overall stock trend with a 35.57% price increase, recent seller dominance and premium valuation metrics suggest a cautious stance. Thus, while Keysight might be attractive for long-term exposure, investors could consider a wait-and-see approach for a more opportune entry point.
Disclaimer: This content is for informational purposes only and does not constitute financial, investment, or other professional advice. Investing in financial markets involves a significant risk of loss, and past performance is not indicative of future results.
Additional Resources
- Jennison Associates LLC Has $141.65 Million Position in Keysight Technologies Inc. $KEYS – MarketBeat (Jan 24, 2026)
- Earnings Preview: What to Expect From Keysight Technologies’ Report – Yahoo Finance (Jan 20, 2026)
- Keysight Deepens EV Charging And Satellite 5G Role With Airbus Collaboration – Sahm (Jan 23, 2026)
- Keysight Collaborates with Airbus UpNext on 5G NTN SpaceRAN Demonstrator – news.satnews.com (Jan 20, 2026)
- Keysight Powers the Future of E-Mobility with Test Solutions for High-Power and Megawatt Charging (2026-01-21) – Seeking Alpha (Jan 21, 2026)
For more information about Keysight Technologies, Inc., please visit the official website: keysight.com