Home > Analyses > Financial Services > KeyCorp
KeyCorp underpins the financial lives of millions, fueling everyday dreams with tailored banking solutions. It commands a strong presence in regional banking, blending traditional retail services with sophisticated commercial finance. Known for innovation and a broad product suite, KeyCorp empowers individuals and businesses alike. As market dynamics evolve, I ask: does KeyCorp’s solid foundation still justify its valuation and promise sustainable growth in 2026?

Table of contents
Business Model & Company Overview
KeyCorp, founded in 1849 and headquartered in Cleveland, Ohio, stands as a dominant regional bank serving the United States. Its ecosystem integrates retail and commercial banking, blending personal finance, asset management, and capital markets into a cohesive financial services platform. With nearly 17K employees and a network of 999 branches and 1,317 ATMs across 15 states, KeyCorp offers a comprehensive suite of products tailored to individuals and small-to-mid-sized businesses.
The company’s revenue engine balances traditional banking—deposits, lending, and credit cards—with growing recurring services like wealth management and financial advisory. Its footprint spans major U.S. markets with expanding digital channels, enhancing customer reach beyond physical branches. KeyCorp’s economic moat lies in its broad service mix and strong regional presence, positioning it as a key architect of the evolving financial landscape.
Financial Performance & Fundamental Metrics
I analyze KeyCorp’s income statement, key financial ratios, and dividend payout policy to assess its profitability, efficiency, and shareholder returns.
Income Statement
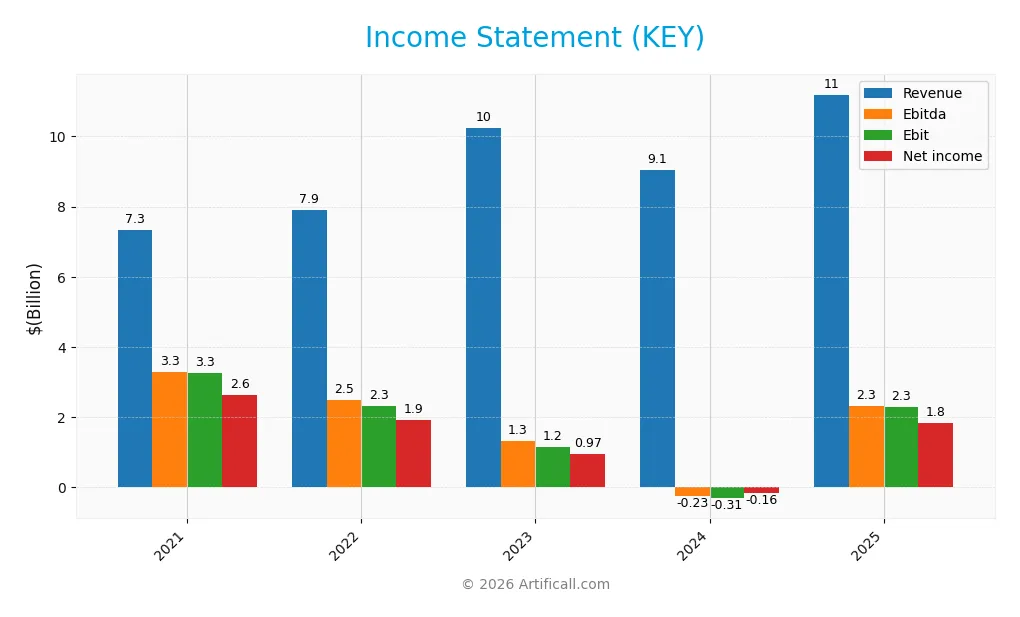
The table below summarizes KeyCorp’s annual income statement figures from 2021 to 2025, reflecting revenue, expenses, profits, and earnings per share in USD.
| 2021 | 2022 | 2023 | 2024 | 2025 | |
|---|---|---|---|---|---|
| Revenue | 7.33B | 7.91B | 10.23B | 9.06B | 11.19B |
| Cost of Revenue | -122M | 1.39B | 4.50B | 4.99B | 4.22B |
| Operating Expenses | 4.20B | 4.19B | 4.57B | 4.36B | 4.66B |
| Gross Profit | 7.46B | 6.52B | 5.73B | 4.06B | 6.97B |
| EBITDA | 3.29B | 2.50B | 1.31B | -233M | 2.32B |
| EBIT | 3.25B | 2.33B | 1.16B | -306M | 2.30B |
| Interest Expense | 296M | 885M | 4.01B | 4.66B | 3.75B |
| Net Income | 2.63B | 1.92B | 967M | -161M | 1.83B |
| EPS | 2.66 | 1.94 | 0.89 | -0.32 | 1.66 |
| Filing Date | 2022-02-22 | 2023-02-22 | 2024-02-22 | 2025-02-21 | 2026-02-23 |
Income Statement Evolution
KeyCorp’s revenue rose 53% from 2021 to 2025, with a notable 24% jump in 2025 alone. Gross margins remained strong, improving to 62.3%, while net income declined 30% over the full period but surged 1,019% in 2025. Operating expenses grew in line with revenue, supporting margin recovery after a prior dip.
Is the Income Statement Favorable?
In 2025, KeyCorp reported a robust 16.4% net margin and 20.6% EBIT margin, indicating solid profitability. Despite a high interest expense ratio of 33.5%, the income statement fundamentals appear favorable due to significant earnings growth and margin improvements. This reflects effective cost control and strong revenue expansion in a challenging environment.
Financial Ratios
The table below presents key financial ratios for KeyCorp over the last five fiscal years, enabling a clear view of profitability, liquidity, leverage, and market valuation trends:
| Ratios | 2021 | 2022 | 2023 | 2024 | 2025 |
|---|---|---|---|---|---|
| Net Margin | 36% | 24% | 9% | -2% | 16% |
| ROE | 15% | 14% | 7% | -1% | 9% |
| ROIC | 9% | 5% | 2% | -0.4% | 6% |
| P/E | 8.3x | 8.4x | 13.8x | -101x | 12.4x |
| P/B | 1.26x | 1.20x | 0.91x | 0.90x | 1.11x |
| Current Ratio | 0.39 | 0.30 | 0.35 | 0.17 | 0.77 |
| Quick Ratio | 0.39 | 0.30 | 0.35 | 0.17 | 0.77 |
| D/E | 0.73 | 2.14 | 1.55 | 0.78 | 0.54 |
| Debt-to-Assets | 7% | 15% | 12% | 8% | 6% |
| Interest Coverage | 11.0x | 2.6x | 0.29x | -0.07x | 0.61x |
| Asset Turnover | 0.04 | 0.04 | 0.05 | 0.05 | 0.06 |
| Fixed Asset Turnover | 10.8x | 12.4x | 15.5x | 14.7x | 17.8x |
| Dividend Yield | 3.8% | 5.3% | 6.8% | 5.7% | 4.0% |
Evolution of Financial Ratios
Return on Equity (ROE) declined from 15.07% in 2021 to 8.97% in 2025, showing a slowdown in profitability. The Current Ratio remained below 1, improving modestly from 0.39 in 2021 to 0.77 in 2025, indicating persistent liquidity constraints. Debt-to-Equity Ratio decreased from 1.55 in 2023 to 0.54 in 2025, reflecting reduced leverage over time.
Are the Financial Ratios Favorable?
Profitability is mixed: net margin at 16.35% is favorable, but ROE at 8.97% and WACC at 14.18% are unfavorable, suggesting returns do not cover capital costs. Liquidity ratios are unfavorable, with a Current Ratio below 1. Debt-to-Assets at 5.97% is favorable, while interest coverage at 0.61 signals risk. Asset turnover is weak, but fixed asset turnover and dividend yield at 3.97% are favorable. Overall, the ratio profile is neutral.
Shareholder Return Policy
KeyCorp maintains a consistent dividend policy, with a 2025 payout ratio near 49% and a dividend per share of $0.82, yielding roughly 4%. The dividend appears well covered by free cash flow, supporting a prudent balance between shareholder returns and capital retention.
The company also engages in share buybacks, enhancing capital return without jeopardizing liquidity. This disciplined approach aligns with sustainable long-term value creation, balancing stable income distributions and reinvestment capacity.
Score analysis
Here is a radar chart illustrating KeyCorp’s key financial scores across valuation, profitability, and leverage metrics:
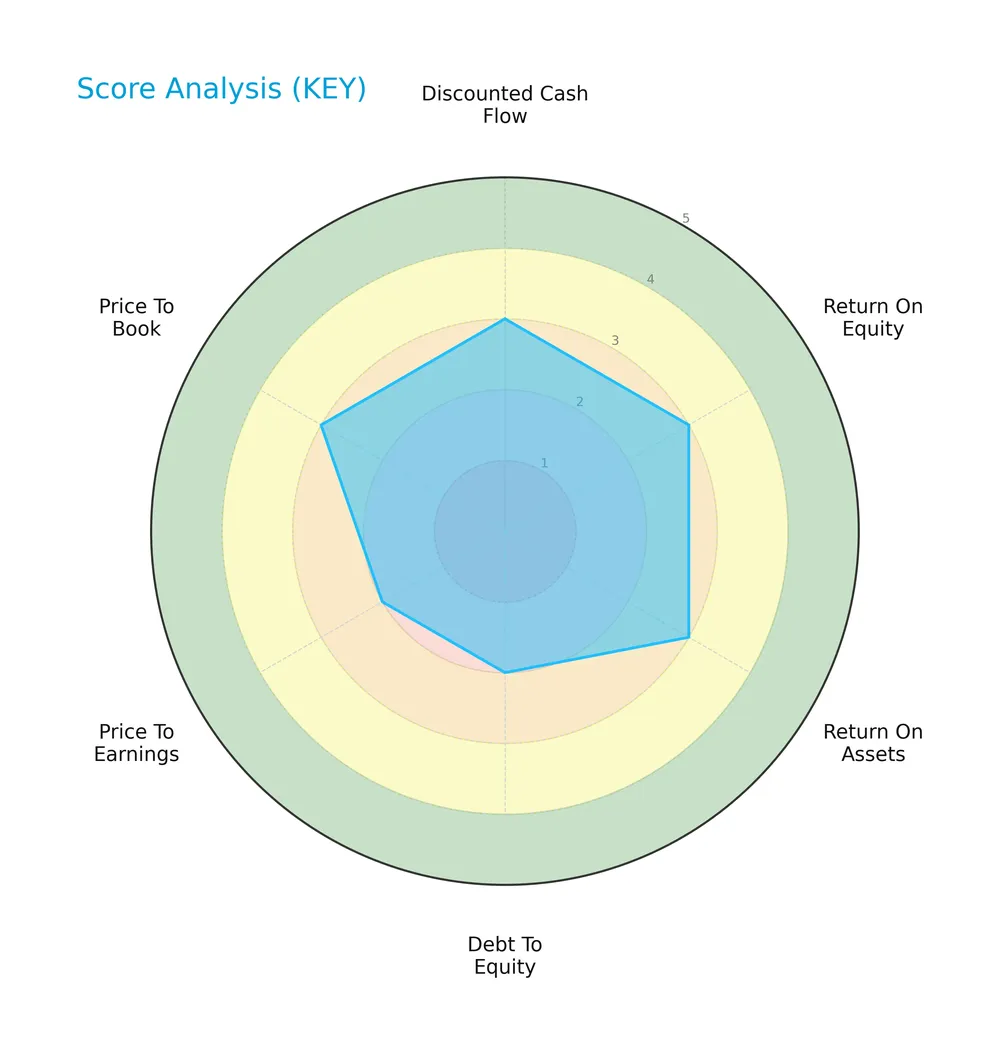
KeyCorp shows moderate scores in discounted cash flow, ROE, ROA, and price-to-book ratios. However, debt-to-equity and price-to-earnings scores are unfavorable, indicating some concerns in leverage and valuation metrics.
Analysis of the company’s bankruptcy risk
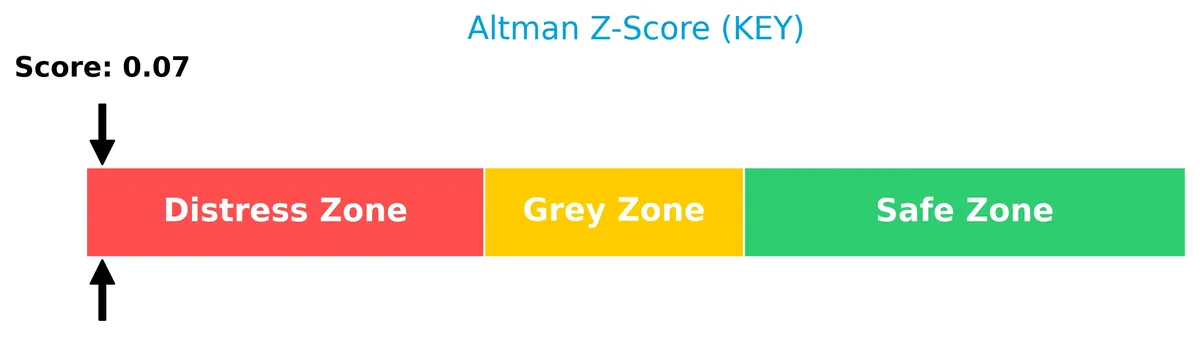
The Altman Z-Score places KeyCorp in the distress zone, signaling a high probability of financial distress and potential bankruptcy risk:
Is the company in good financial health?
The Piotroski Score diagram highlights KeyCorp’s financial strength based on profitability, leverage, and efficiency criteria:

With a very strong Piotroski Score of 8, KeyCorp demonstrates robust financial health, suggesting solid fundamentals despite other risk factors.
Competitive Landscape & Sector Positioning
This sector analysis examines KeyCorp’s strategic positioning, revenue streams, and core products within regional banking. I will assess whether KeyCorp holds a competitive advantage over its main rivals.
Strategic Positioning
KeyCorp concentrates its operations within the US, serving consumer and commercial banking sectors. It offers a diversified product portfolio spanning retail banking, investment banking, asset management, and specialized lending. Its presence across 15 states with nearly 1,000 branches underscores a regional focus rather than broad geographic diversification.
Revenue by Segment
This pie chart displays KeyCorp’s revenue breakdown by segment for the full year 2025, highlighting key business drivers and income sources.
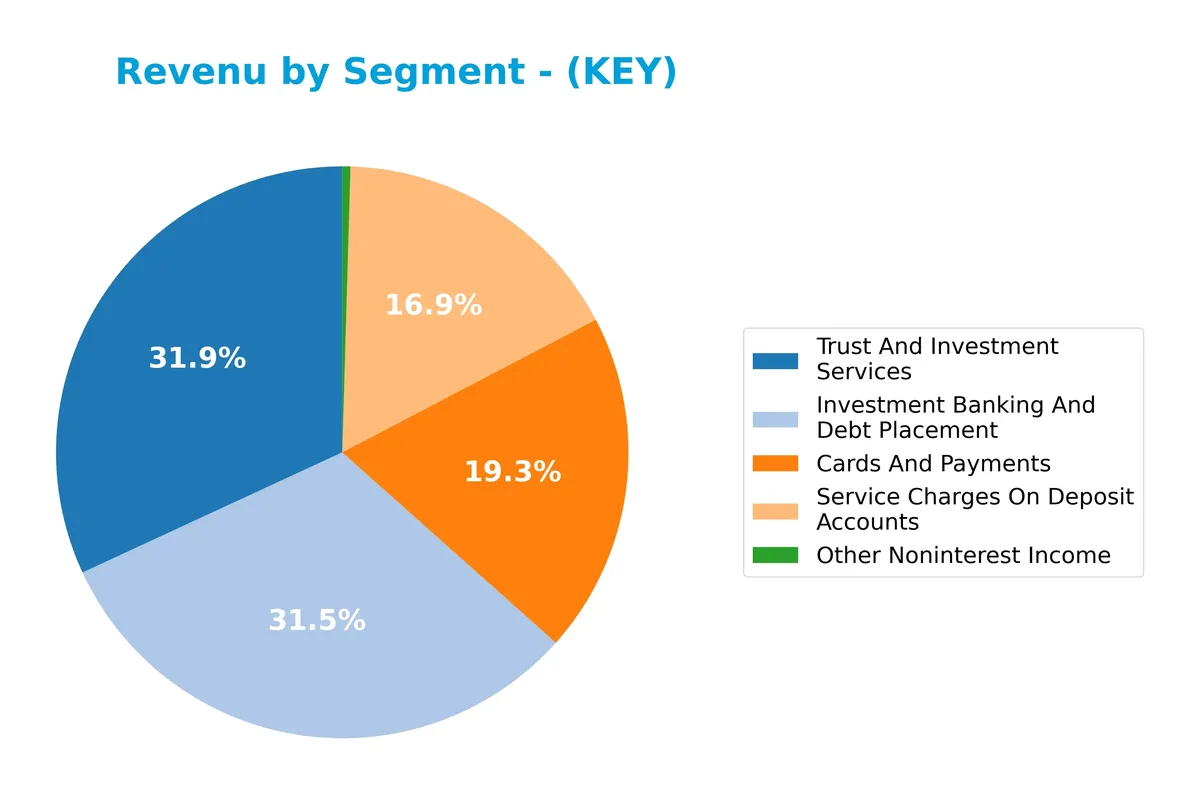
In 2025, Investment Banking And Debt Placement leads with $551M, closely followed by Trust And Investment Services at $558M. Cards And Payments contributes $337M, while Service Charges On Deposit Accounts add $295M. Other Noninterest Income remains minor at $8M. The data reveals a stable shift towards investment and trust services, signaling increased focus on fee-based income amid a competitive banking sector.
Key Products & Brands
The following table summarizes KeyCorp’s main products and services by category and description:
| Product | Description |
|---|---|
| Cards And Payments | Credit and debit card services generating $337M revenue in 2025, facilitating consumer and business transactions. |
| Investment Banking And Debt Placement | Services including underwriting and capital market products, with $551M revenue in 2025. |
| Service Charges On Deposit Accounts | Fees from deposit accounts, contributing $295M revenue in 2025. |
| Trust And Investment Services | Wealth management, asset management, and trust services, producing $558M revenue in 2025. |
| Community Banking | Retail banking services focusing on individuals and small businesses (historical revenue context). |
| Corporate Banking | Commercial banking services for middle-market clients (historical revenue context). |
| Other Noninterest Income | Various miscellaneous income streams, totaling $8M in 2025, down from previous years. |
KeyCorp operates a diverse range of banking and financial services. Its revenue mix balances traditional deposit and lending products with investment banking and wealth management. The firm’s scale supports both retail and commercial client segments.
Main Competitors
The following table lists the top 9 competitors of KeyCorp by market capitalization in the regional banks sector:
| Competitor | Market Cap. |
|---|---|
| U.S. Bancorp | 83.8B |
| The PNC Financial Services Group, Inc. | 82.9B |
| Truist Financial Corporation | 64.6B |
| Fifth Third Bancorp | 31.5B |
| M&T Bank Corporation | 31.4B |
| Huntington Bancshares Incorporated | 25.5B |
| Citizens Financial Group, Inc. | 25.5B |
| Regions Financial Corporation | 24.9B |
| KeyCorp | 22.9B |
KeyCorp ranks 9th among its 9 competitors by market cap. It holds 27.6% of the market cap of the leader, U.S. Bancorp. The company sits below both the average market cap of 43.7B and the sector median of 31.4B. KeyCorp is 7.3% smaller than Regions Financial Corporation, its nearest larger rival, highlighting a modest gap at the lower end of this competitive set.
Comparisons with competitors
Check out how we compare the company to its competitors:
Does KeyCorp have a competitive advantage?
KeyCorp currently lacks a competitive advantage, as its return on invested capital (ROIC) falls significantly below its weighted average cost of capital (WACC), indicating value destruction and declining profitability. The company’s profitability metrics, such as net margin, remain favorable, but the overall trend shows diminishing returns on capital invested.
Looking ahead, KeyCorp’s diverse banking products and services across retail, commercial, and capital markets offer avenues for growth. Its broad geographic footprint and digital banking capabilities provide opportunities to capture new clients and enhance revenue streams despite existing challenges in capital efficiency.
SWOT Analysis
This SWOT analysis highlights KeyCorp’s critical internal and external factors shaping its strategic outlook.
Strengths
- Strong dividend yield at 3.97%
- Favorable net margin of 16.35%
- Moderate valuation with PE of 12.36
Weaknesses
- Low current and quick ratios at 0.77 signal liquidity risk
- ROE under 9% lags industry benchmarks
- Negative ROIC trend indicates value destruction
Opportunities
- Expansion in commercial and consumer banking
- Growth potential in digital banking services
- Leveraging wealth and asset management segments
Threats
- Rising interest expenses at 33.52% of revenue
- Intense regional bank competition
- Economic downturn increasing credit risk
KeyCorp benefits from solid profitability and attractive dividends but faces liquidity and profitability challenges. The company must prioritize strengthening its balance sheet and operational efficiency while capitalizing on digital growth to mitigate competitive and economic threats.
Stock Price Action Analysis
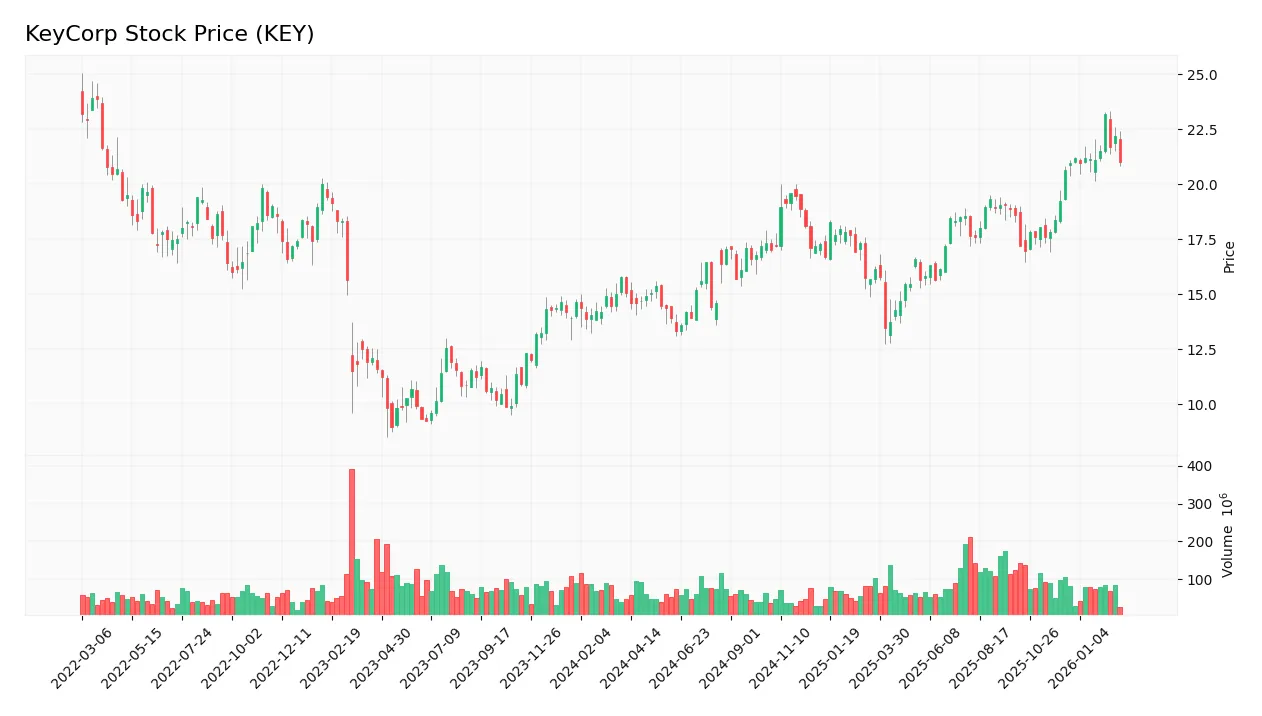
The weekly stock chart of KeyCorp (KEY) highlights price movement and volume trends from late 2025 through early 2026:
Trend Analysis
Over the past twelve months, KEY’s price rose 39.51%, confirming a bullish trend with accelerating momentum. The price ranged from a low of 13.36 to a high of 23.21, reflecting strong upward movement supported by moderate volatility (2.19 std dev). Recent three-month gains show a neutral trend with a 1.69% increase and lower volatility (0.66 std dev).
Volume Analysis
Trading volume over the last three months is increasing and strongly buyer-driven. Buyers accounted for 65.54% of activity, signaling robust demand and growing investor confidence. This buyer dominance amid rising volume suggests heightened market participation and positive sentiment around KEY’s shares.
Target Prices
Analysts present a target consensus reflecting moderate upside potential.
| Target Low | Target High | Consensus |
|---|---|---|
| 18 | 26 | 23 |
The target range from 18 to 26 indicates cautious optimism, with a consensus price of 23 suggesting room for appreciation.

Don’t Let Luck Decide Your Entry Point
Optimize your entry points with our advanced ProRealTime indicators. You’ll get efficient buy signals with precise price targets for maximum performance. Start outperforming now!
Analyst & Consumer Opinions
This section examines KeyCorp’s recent analyst ratings alongside consumer feedback to provide balanced market insight.
Stock Grades
Here is the latest set of verified analyst grades for KeyCorp from recognized financial institutions:
| Grading Company | Action | New Grade | Date |
|---|---|---|---|
| JP Morgan | Maintain | Neutral | 2026-02-09 |
| Evercore ISI Group | Maintain | Outperform | 2026-02-05 |
| Truist Securities | Maintain | Hold | 2026-01-26 |
| TD Cowen | Maintain | Buy | 2026-01-07 |
| Baird | Downgrade | Underperform | 2026-01-06 |
| Barclays | Maintain | Equal Weight | 2026-01-05 |
| Truist Securities | Maintain | Hold | 2025-12-22 |
| Keefe, Bruyette & Woods | Maintain | Outperform | 2025-12-17 |
| DA Davidson | Maintain | Buy | 2025-12-10 |
| Truist Securities | Maintain | Hold | 2025-10-17 |
The consensus trend shows a predominance of buy and hold ratings, with a notable downgrade to underperform by Baird. This mix indicates a cautious but generally favorable view on KeyCorp’s near-term prospects.
Consumer Opinions
Consumer sentiment about KeyCorp reveals a mix of appreciation for its service and concerns over digital experience.
| Positive Reviews | Negative Reviews |
|---|---|
| Friendly and knowledgeable staff | Mobile app frequently crashes |
| Quick issue resolution | Long wait times during peak hours |
| Transparent fee structure | Customer service sometimes unresponsive |
| Convenient branch locations | Limited online banking features |
Overall, customers praise KeyCorp’s helpful staff and clear fees. However, recurring complaints about digital tools and wait times highlight areas needing urgent improvement.
Risk Analysis
The following table summarizes KeyCorp’s primary risks, assessing their likelihood and potential impact on shareholder value:
| Category | Description | Probability | Impact |
|---|---|---|---|
| Financial Health | Altman Z-Score signals high bankruptcy risk, indicating distress. | High | Severe |
| Liquidity | Low current and quick ratios (0.77) suggest tight short-term cash. | Medium | Moderate |
| Profitability | ROE (8.97%) below WACC (14.18%) implies value destruction risk. | Medium | High |
| Interest Coverage | Interest coverage ratio at 0.61 signals difficulty servicing debt. | Medium | High |
| Market Volatility | Beta of 1.068 exposes stock to market swings near market average. | Medium | Moderate |
| Debt Management | Moderate debt-to-equity ratio (0.54) is manageable but watchful. | Low | Moderate |
KeyCorp faces significant financial distress risks, highlighted by its Altman Z-Score deep in the distress zone. This contrasts sharply with a very strong Piotroski Score, reflecting operational efficiency but not enough to offset solvency concerns. The low interest coverage ratio and unfavorable ROE vs. WACC spread raise red flags about capital allocation effectiveness. Investors must weigh these risks carefully amid a competitive regional banking sector.
Should You Buy KeyCorp?
KeyCorp appears to be shedding value with a very unfavorable moat and declining profitability, despite demonstrating moderate operational efficiency and a very strong Piotroski score. Supported by a manageable but cautious leverage profile, its overall B rating suggests a balanced yet cautious investment profile.
Strength & Efficiency Pillars
KeyCorp shows solid operational margins, with a gross margin of 62.27% and an EBIT margin of 20.59%, signaling efficient core business activities. The net margin at 16.35% confirms profitable operations. However, return on invested capital (ROIC) is 5.83%, trailing the weighted average cost of capital (WACC) at 14.18%, indicating the company is not a value creator. Despite moderate profitability, the capital allocation erodes shareholder value, reflecting challenges in sustaining competitive advantage.
Weaknesses and Drawbacks
KeyCorp is in financial distress, with an Altman Z-Score of 0.073, signaling a high bankruptcy risk. This overshadows profitability strengths. Additional concerns include unfavorable interest coverage at 0.61, indicating difficulties servicing debt, and a low current ratio of 0.77, raising liquidity red flags. While the price-to-earnings ratio of 12.36 is reasonable, debt-to-equity stands neutral at 0.54. These factors represent significant leverage and solvency risks in a volatile market environment.
Our Final Verdict about KeyCorp
Despite favorable operational margins and strong buyer dominance recently, KeyCorp’s Altman Z-Score places it firmly in the distress zone. This solvency risk makes the stock highly speculative and too risky for conservative capital. Investors might consider this profile cautiously, as financial instability undermines apparent earnings quality and market momentum.
Disclaimer: This content is for informational purposes only and does not constitute financial, investment, or other professional advice. Investing in financial markets involves a significant risk of loss, and past performance is not indicative of future results.
Additional Resources
- Mixed Views on KeyCorp (KEY) Amid Constructive Outlook on the Large-Cap Banking – Yahoo Finance (Feb 24, 2026)
- KeyCorp emerges as potential target for First Citizens acquisition – Crain’s Cleveland Business (Feb 23, 2026)
- Decoding KeyCorp (KEY): A Strategic SWOT Insight – GuruFocus (Feb 24, 2026)
- KeyCorp (NYSE:KEY) Receives Average Rating of “Hold” from Analysts – MarketBeat (Feb 24, 2026)
- A Look At KeyCorp (KEY) Valuation After Recent Share Price Momentum – simplywall.st (Feb 23, 2026)
For more information about KeyCorp, please visit the official website: key.com