Home > Analyses > Consumer Defensive > Keurig Dr Pepper Inc.
Keurig Dr Pepper transforms daily routines with its iconic beverages, from coffee pods to classic soft drinks. The company commands a leading role in the non-alcoholic beverage sector, driven by innovation in coffee systems and a diverse portfolio of household brands like Dr Pepper and Snapple. I’ve observed that its blend of strong distribution and product variety fuels steady growth. The key question: does Keurig Dr Pepper’s current financial health support its premium market valuation and future expansion?
Table of contents
Business Model & Company Overview
Keurig Dr Pepper Inc., founded in 1981 and headquartered in Burlington, Massachusetts, stands as a dominant player in the non-alcoholic beverage sector. It operates a cohesive ecosystem spanning Coffee Systems, Packaged Beverages, Beverage Concentrates, and Latin America Beverages segments. This structure supports a unified mission to deliver diverse, high-quality beverages through both proprietary and partner brands across multiple channels.
The company’s revenue engine balances hardware sales, such as brewers and K-Cup pods, with a robust portfolio of packaged beverages and syrup concentrates. Its global footprint spans the Americas, Europe, and Asia, serving retailers, bottlers, and end consumers. Keurig Dr Pepper’s economic moat lies in its expansive brand portfolio and integrated distribution network, shaping the future of beverage consumption worldwide.
Financial Performance & Fundamental Metrics
I analyze Keurig Dr Pepper Inc.’s income statement, key financial ratios, and dividend payout policy to assess its core financial health and shareholder value.
Income Statement
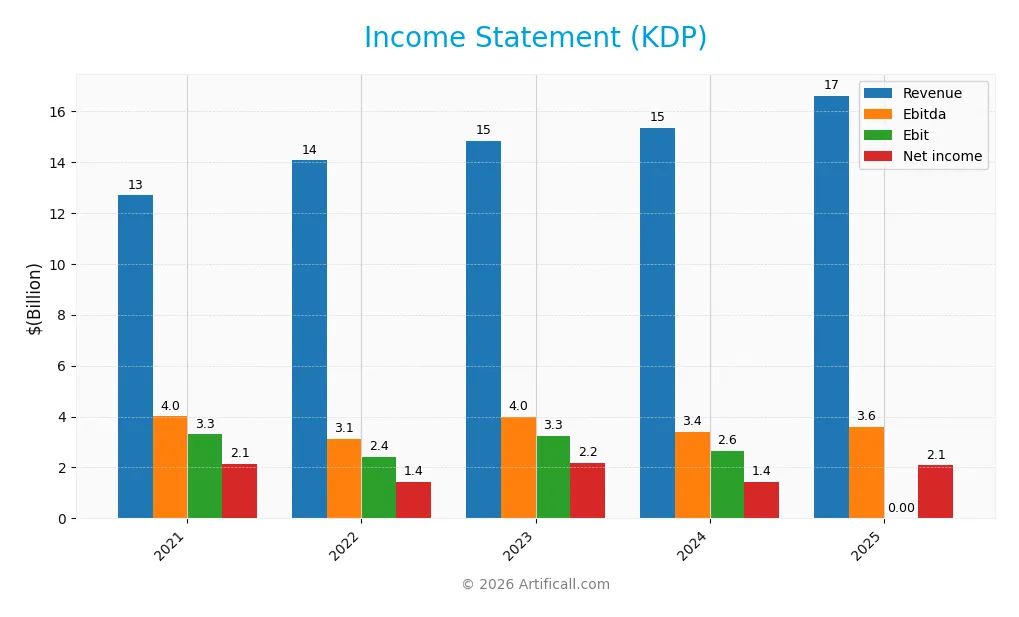
This table summarizes Keurig Dr Pepper Inc.’s key income statement items from 2021 to 2025, reflecting revenue, expenses, profitability, and earnings per share trends.
| 2021 | 2022 | 2023 | 2024 | 2025 | |
|---|---|---|---|---|---|
| Revenue | 12.7B | 14.1B | 14.8B | 15.4B | 16.6B |
| Cost of Revenue | 5.7B | 6.7B | 6.7B | 6.8B | 7.6B |
| Operating Expenses | 4.1B | 4.7B | 4.9B | 5.9B | 5.4B |
| Gross Profit | 7.0B | 7.3B | 8.1B | 8.5B | 9.0B |
| EBITDA | 4.0B | 3.1B | 4.0B | 3.4B | 3.6B |
| EBIT | 3.3B | 2.4B | 3.3B | 2.6B | N/A |
| Interest Expense | 525M | 468M | 596M | 684M | 754M |
| Net Income | 2.1B | 1.4B | 2.2B | 1.4B | 2.1B |
| EPS | 1.52 | 1.01 | 1.56 | 1.06 | 1.53 |
| Filing Date | 2022-02-24 | 2023-02-23 | 2024-02-22 | 2025-02-25 | 2026-02-24 |
Income Statement Evolution
Keurig Dr Pepper’s revenue grew steadily by 31% from 2021 to 2025, with an 8.2% increase in 2025 alone. Gross profit rose consistently, maintaining a favorable 54.2% margin. However, EBIT fell sharply in 2025, erasing previous gains. Despite this, net income showed volatility but improved by 33.4% in 2025, boosting net margins positively.
Is the Income Statement Favorable?
In 2025, KDP reported $16.6B revenue and $2.08B net income, generating a solid 12.5% net margin. Interest expense remained manageable at 4.54% of revenue, supporting profitability. The 0% EBIT margin flags operational challenges, yet strong net margin growth and EPS improvement suggest overall favorable fundamentals, reflecting effective cost control amid top-line expansion.
Financial Ratios
The table below summarizes key financial ratios for Keurig Dr Pepper Inc. (KDP) over the last five fiscal years, providing insight into profitability, liquidity, leverage, and market valuation:
| Ratios | 2021 | 2022 | 2023 | 2024 | 2025 |
|---|---|---|---|---|---|
| Net Margin | 17% | 10% | 15% | 9% | 13% |
| ROE | 8.6% | 5.7% | 8.5% | 5.9% | 8.1% |
| ROIC | 5.0% | 4.8% | 5.4% | 4.0% | 5.5% |
| P/E | 24.3 | 35.2 | 21.4 | 30.4 | 18.3 |
| P/B | 2.09 | 2.01 | 1.82 | 1.80 | 1.49 |
| Current Ratio | 0.47 | 0.47 | 0.38 | 0.49 | 0.64 |
| Quick Ratio | 0.33 | 0.31 | 0.25 | 0.33 | 0.43 |
| D/E | 0.53 | 0.54 | 0.58 | 0.71 | 0.63 |
| Debt-to-Assets | 26% | 26% | 28% | 32% | 29% |
| Interest Coverage | 5.5x | 5.6x | 5.4x | 3.8x | 4.7x |
| Asset Turnover | 0.25 | 0.27 | 0.28 | 0.29 | 0.30 |
| Fixed Asset Turnover | 4.0 | 4.2 | 4.1 | 4.0 | 5.1 |
| Dividend Yield | 1.8% | 2.1% | 2.4% | 2.7% | 3.3% |
Evolution of Financial Ratios
From 2021 to 2025, Keurig Dr Pepper’s Return on Equity (ROE) declined from 8.59% to 8.15%, showing a slight weakening in profitability. The Current Ratio improved from 0.47 in 2021 to 0.64 in 2025 but remains below 1, indicating ongoing liquidity constraints. The Debt-to-Equity Ratio increased moderately, stabilizing near 0.63, reflecting consistent leverage use.
Are the Financial Ratios Fovorable?
In 2025, profitability shows mixed signals: net margin at 12.52% is favorable, but ROE at 8.15% is unfavorable compared to sector averages. Liquidity ratios remain weak, with a current ratio of 0.64 and quick ratio of 0.43, both unfavorable. Leverage ratios are neutral to favorable, with debt-to-assets at 29.1% and debt-to-equity at 0.63. Asset turnover is low at 0.3, signaling efficiency challenges. Overall, the ratios lean slightly favorable with 43% favorable metrics.
Shareholder Return Policy
Keurig Dr Pepper Inc. maintains a consistent dividend payout, with a 2025 payout ratio near 60% and a dividend yield of 3.28%. Dividends are covered by free cash flow, supporting ongoing distributions. The company also conducts share buybacks, complementing its shareholder return strategy.
This balanced approach aligns with sustainable long-term value creation, as dividends and buybacks are funded prudently without overstressing cash flow. However, investors should monitor payout trends relative to earnings to avoid risks of unsustainable distributions or excessive leverage.
Score analysis
Below is a radar chart illustrating Keurig Dr Pepper Inc.’s key financial scores for valuation and profitability metrics:
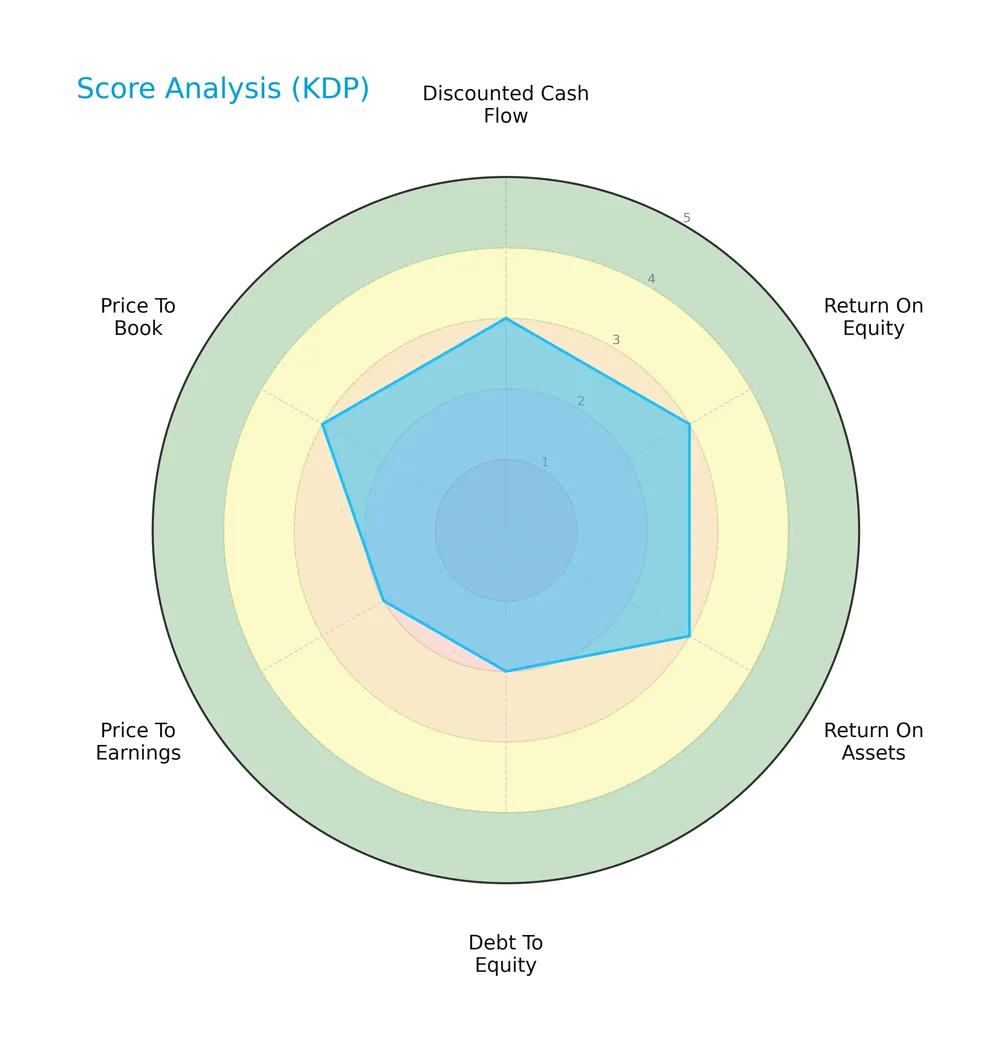
The company shows moderate scores in discounted cash flow, return on equity, return on assets, and price to book. However, debt to equity and price to earnings scores are unfavorable, indicating some leverage and valuation concerns.
Analysis of the company’s bankruptcy risk
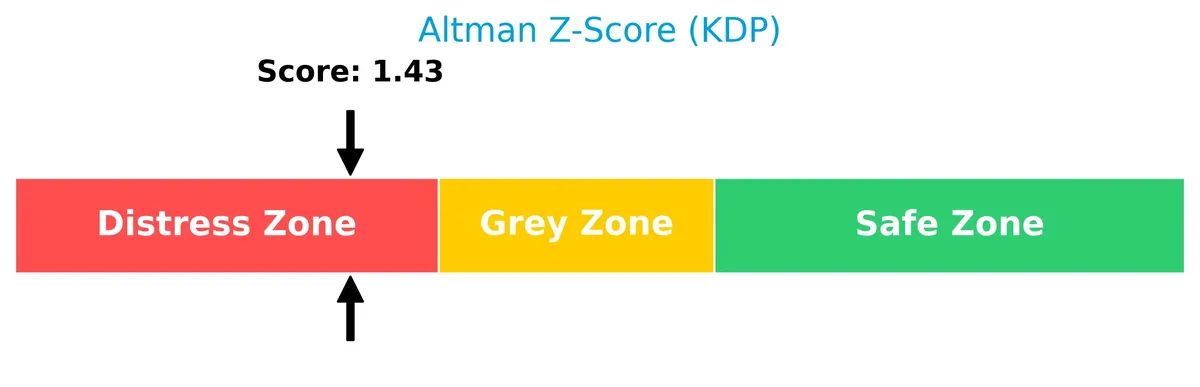
The Altman Z-Score places Keurig Dr Pepper Inc. in the distress zone, signaling a higher risk of financial distress and potential bankruptcy:
Is the company in good financial health?
This Piotroski diagram presents Keurig Dr Pepper Inc.’s financial strength based on nine accounting criteria:
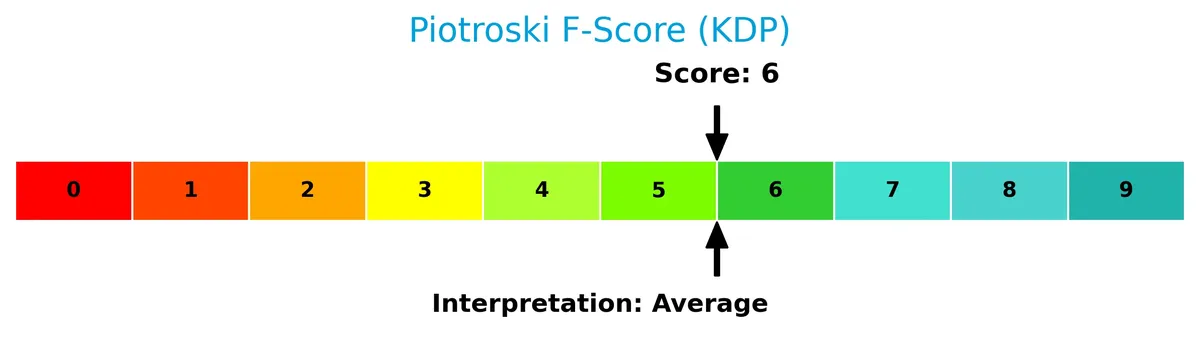
With an average Piotroski score of 6, the company demonstrates moderate financial health but does not reach the threshold for strong financial stability.
Competitive Landscape & Sector Positioning
This section analyzes Keurig Dr Pepper Inc.’s strategic positioning, revenue streams, and key products within the non-alcoholic beverage sector. I will evaluate the company’s main competitors and identify its competitive advantages. Next, I will assess whether Keurig Dr Pepper holds a sustainable edge over its peers.
Strategic Positioning
Keurig Dr Pepper maintains a diversified product portfolio spanning Coffee Systems, Packaged Beverages, Beverage Concentrates, and Latin America Beverages. Geographically, it relies heavily on the U.S. market (14.5B in 2025) but steadily grows international sales, now over 2.1B.
Revenue by Segment
This pie chart displays Keurig Dr Pepper Inc.’s revenue distribution across key product segments for the full fiscal year 2025.
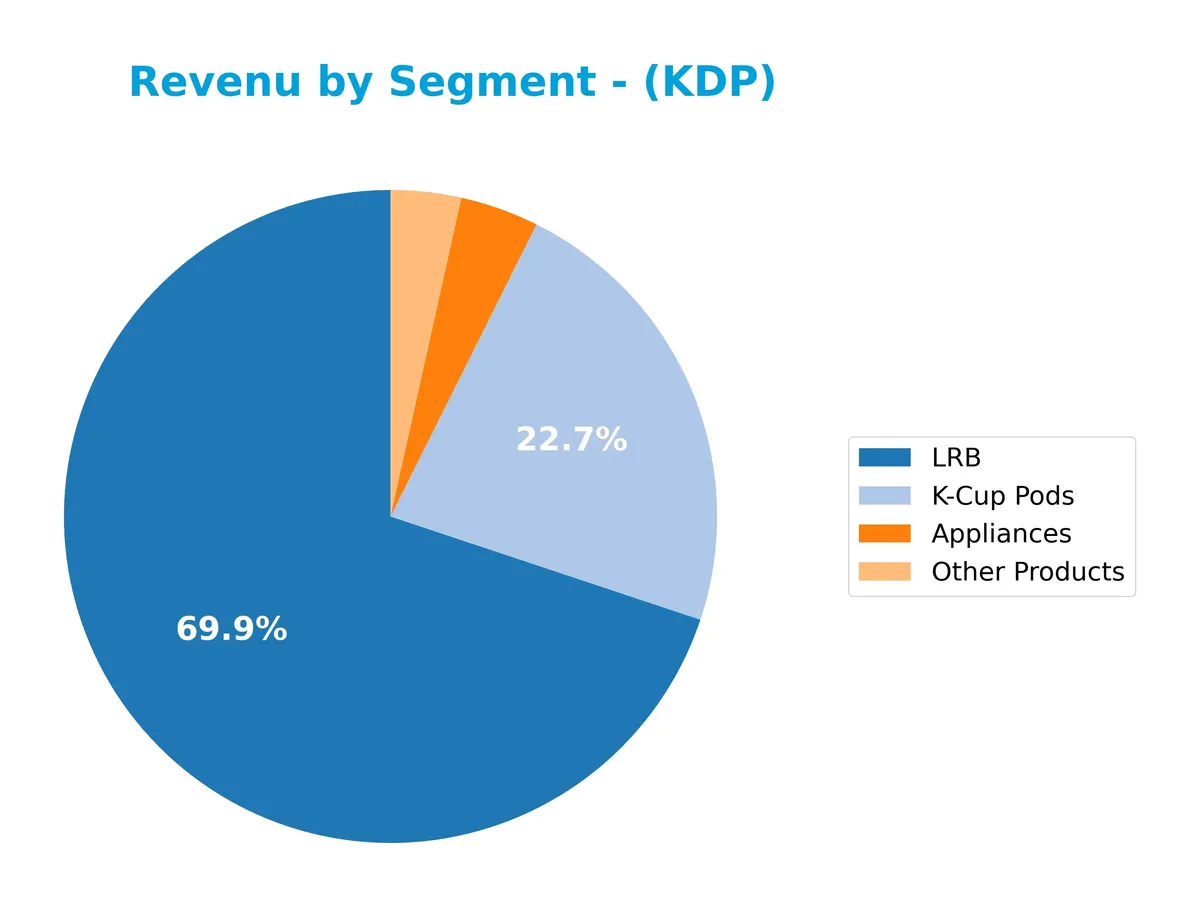
In 2025, the LRB segment leads with $11.6B, reinforcing its role as the core revenue driver. K-Cup Pods follow strongly at $3.8B, reflecting steady demand. Appliances and Other Products lag significantly with $646M and $578M, respectively. The concentration in LRB and Pods signals focused market strength but also potential concentration risk if consumer preferences shift. Recent data shows slight deceleration in Appliances revenue, suggesting evolving consumer trends.
Key Products & Brands
The table below details Keurig Dr Pepper Inc.’s principal products and brands with brief descriptions:
| Product | Description |
|---|---|
| K-Cup Pods | Single-serve coffee pods compatible with Keurig brewers, driving recurring consumer purchases. |
| Coffee Systems | Coffee brewers and related finished goods distributed through retailers and direct channels. |
| Packaged Beverages | Bottled and canned beverages, including partner brands and private label contract manufacturing. |
| Beverage Concentrates | Concentrated syrups sold under brands like Dr Pepper, Canada Dry, 7UP, Snapple, and others, used for beverage mixing. |
| Latin America Beverages | Carbonated mineral water, flavored soft drinks, bottled water, and vegetable juices marketed under regional brands. |
| Appliances | Coffee brewing appliances complementing the K-Cup system ecosystem. |
| Other Products | Miscellaneous beverage-related products outside the main segments. |
Keurig Dr Pepper’s portfolio spans coffee systems, packaged beverages, and beverage concentrates. Its brand breadth includes high-recognition names across multiple non-alcoholic beverage categories, serving diverse consumer preferences and channel partners.
Main Competitors
There are 7 competitors in the Consumer Defensive sector; the table lists the top 7 leaders by market capitalization:
| Competitor | Market Cap. |
|---|---|
| The Coca-Cola Company | 297B |
| PepsiCo, Inc. | 194B |
| Monster Beverage Corporation | 74B |
| Coca-Cola Europacific Partners PLC | 41.7B |
| Keurig Dr Pepper Inc. | 37.7B |
| Coca-Cola Consolidated, Inc. | 13.3B |
| Celsius Holdings, Inc. | 11.8B |
Keurig Dr Pepper ranks 5th among 7 competitors. Its market cap is 14.17% of the leader, The Coca-Cola Company. The company sits below the average top 10 market cap of 95.8B but above the sector median of 41.7B. The distance to the next competitor above it is narrow at about +1.14%, indicating a tight race for this position.
Comparisons with competitors
Check out how we compare the company to its competitors:
Does KDP have a competitive advantage?
Keurig Dr Pepper Inc. currently does not demonstrate a clear competitive advantage, as it is shedding value with ROIC below WACC. However, its profitability is improving, indicating operational progress.
Looking ahead, KDP benefits from expanding international markets and diversified beverage segments, including coffee systems and concentrates. These offer growth opportunities to strengthen its competitive position over time.
SWOT Analysis
This SWOT analysis highlights Keurig Dr Pepper Inc.’s core strengths, weaknesses, opportunities, and threats to inform strategic decisions.
Strengths
- Strong brand portfolio
- Growing revenue and net margin
- Favorable dividend yield
Weaknesses
- Low current and quick ratios
- Negative EBIT growth
- Interest coverage concerns
Opportunities
- Expanding international sales
- Innovation in coffee systems
- Rising consumer demand for premium beverages
Threats
- Intense industry competition
- Commodity price volatility
- Regulatory pressures on sugary drinks
Keurig Dr Pepper’s solid brand strength and improving profitability support growth. However, liquidity weaknesses and margin pressures require close monitoring. The company’s international expansion and product innovation offer promising avenues, but competitive and regulatory risks could dampen momentum. Strategic focus should balance growth initiatives with financial discipline.
Stock Price Action Analysis
The weekly stock chart for Keurig Dr Pepper Inc. (KDP) reveals price momentum and key levels over the last 12 months:
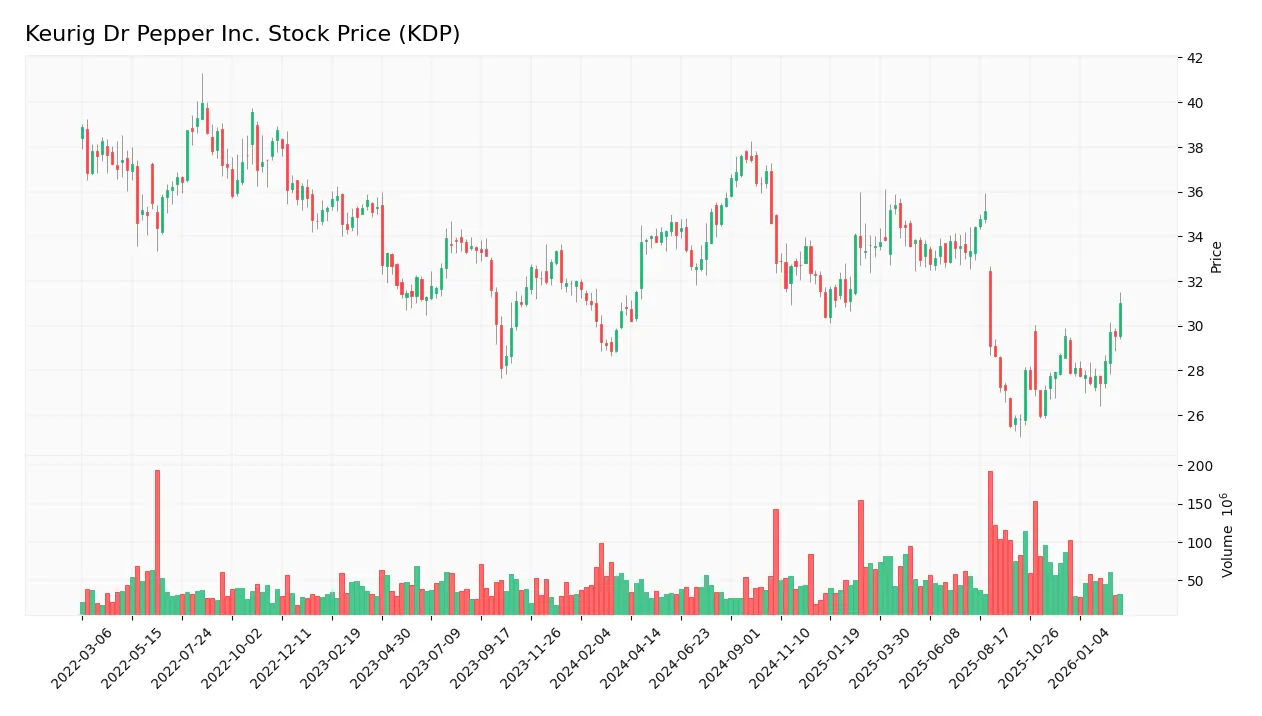
Trend Analysis
Over the past year, KDP’s stock price rose by 0.84%, indicating a bullish trend with accelerating momentum. The highest price reached 37.61, the lowest 25.5. The standard deviation of 3.03 signals moderate volatility in this period.
Volume Analysis
In the last three months, volume trends show increasing activity with slight buyer dominance at 56.12%. Buyer volume exceeded seller volume, suggesting growing investor confidence and market participation favoring accumulation.
Target Prices
Analysts set a clear consensus target price for Keurig Dr Pepper Inc. (KDP).
| Target Low | Target High | Consensus |
|---|---|---|
| 24 | 38 | 32 |
The target range from 24 to 38 implies moderate upside potential. The consensus at 32 reflects analyst confidence in steady growth.

Don’t Let Luck Decide Your Entry Point
Optimize your entry points with our advanced ProRealTime indicators. You’ll get efficient buy signals with precise price targets for maximum performance. Start outperforming now!
Analyst & Consumer Opinions
This section examines analyst grades and consumer feedback surrounding Keurig Dr Pepper Inc. (KDP) to provide balanced insights.
Stock Grades
Here are the most recent verified analyst grades for Keurig Dr Pepper Inc., reflecting varied sentiment and some recent downgrades:
| Grading Company | Action | New Grade | Date |
|---|---|---|---|
| Jefferies | Downgrade | Hold | 2025-12-17 |
| Piper Sandler | Maintain | Overweight | 2025-12-15 |
| Barclays | Maintain | Equal Weight | 2025-10-28 |
| Wells Fargo | Maintain | Overweight | 2025-10-28 |
| JP Morgan | Maintain | Overweight | 2025-10-20 |
| B of A Securities | Maintain | Buy | 2025-10-08 |
| Goldman Sachs | Maintain | Neutral | 2025-10-02 |
| Wells Fargo | Maintain | Overweight | 2025-09-25 |
| Barclays | Downgrade | Equal Weight | 2025-09-24 |
| BNP Paribas | Downgrade | Underperform | 2025-09-22 |
The overall trend shows a cautious stance with several downgrades from Overweight to Equal Weight or Hold. Most analysts maintain a Buy or Overweight rating, indicating moderate confidence despite some recent skepticism.
Consumer Opinions
Consumer sentiment around Keurig Dr Pepper Inc. (KDP) shows a mix of strong brand loyalty and concerns over product availability.
| Positive Reviews | Negative Reviews |
|---|---|
| “Great variety of flavors and consistent taste.” | “Packaging sometimes leaks during shipping.” |
| “Convenient single-serve options for busy mornings.” | “Prices have increased noticeably in the past year.” |
| “Wide availability in stores and online.” | “Customer service response times can be slow.” |
Overall, consumers praise KDP’s product variety and convenience. However, packaging issues and rising prices represent recurring points of dissatisfaction.
Risk Analysis
Below is a summary of key risks Keurig Dr Pepper faces, categorized by likelihood and potential impact:
| Category | Description | Probability | Impact |
|---|---|---|---|
| Liquidity Risk | Current ratio at 0.64 signals potential short-term liquidity issues, raising red flags. | High | Medium |
| Profitability Risk | Return on Equity (8.15%) lags behind industry averages, indicating weaker shareholder returns. | Medium | Medium |
| Bankruptcy Risk | Altman Z-score of 1.43 places KDP in the distress zone, suggesting elevated default risk. | Medium | High |
| Debt Risk | Interest coverage ratio of 0.0 implies difficulty covering interest expenses from earnings. | Medium | High |
| Market Risk | Beta of 0.35 shows low stock volatility, reducing exposure but limiting upside in bull cycles. | Low | Low |
| Operational Risk | Asset turnover of 0.3 suggests inefficient use of assets compared to sector norms. | Medium | Medium |
The most pressing risks are liquidity and debt servicing. KDP’s current ratio well below 1.0 and zero interest coverage underscore strained short-term financial flexibility. Combined with an Altman Z-score in the distress zone, these factors heighten bankruptcy concerns despite a stable market beta. Investors should watch for improvements in cash management and earnings before considering new entries.
Should You Buy Keurig Dr Pepper Inc.?
Keurig Dr Pepper Inc. appears to have improving profitability with a slightly favorable moat, yet it faces a challenging leverage profile and liquidity constraints. Despite a moderate overall rating of B, financial distress signals and average operational efficiency suggest cautious interpretation.
Strength & Efficiency Pillars
Keurig Dr Pepper Inc. posts a solid net margin of 12.52%, reflecting effective control over costs and pricing power. Its gross margin stands robust at 54.2%, supporting operational efficiency. The company’s ROIC of 5.5% exceeds its WACC of 4.82%, indicating it creates value despite modest returns. While ROE is a weaker 8.15%, the firm’s growing ROIC trend suggests improving profitability and expanding operational efficiency over time.
Weaknesses and Drawbacks
The company is in financial distress, with an Altman Z-Score of 1.43 signaling a heightened bankruptcy risk. This solvency concern overshadows other metrics. Leverage metrics such as a current ratio of 0.64 and quick ratio of 0.43 raise liquidity red flags, revealing limited short-term asset coverage for liabilities. Interest coverage is zero, indicating difficulty servicing debt costs. The P/E ratio is moderate at 18.3, but liquidity and solvency weaknesses pose significant risk.
Our Final Verdict about Keurig Dr Pepper Inc.
Despite operational strengths and improving profitability, the distress-level Altman Z-Score makes Keurig Dr Pepper’s profile highly speculative. The solvency risk dominates the investment thesis, suggesting caution. Conservative investors might find the financial health too precarious, even though recent trends show slight buyer dominance and a bullish price pattern. The stock could appeal only to risk-tolerant investors willing to accept elevated default risk.
Disclaimer: This content is for informational purposes only and does not constitute financial, investment, or other professional advice. Investing in financial markets involves a significant risk of loss, and past performance is not indicative of future results.
Additional Resources
- Keurig Dr Pepper Sales Rise on Higher Prices – WSJ (Feb 24, 2026)
- Keurig Dr Pepper Announces Updated Financing Plan for JDE Peet’s Acquisition – PR Newswire (Feb 23, 2026)
- Keurig Dr Pepper rallies after earnings as JDE Peet’s merger approaches (KDP:NASDAQ) – Seeking Alpha (Feb 24, 2026)
- Keurig Dr Pepper Warns Cost Pressures Will Persist Into Early 2026 – Keurig Dr Pepper (NASDAQ:KDP) – Benzinga (Feb 24, 2026)
- Keurig Dr Pepper Announces Flavorful New Innovation Across Its Refreshment Portfolio – PR Newswire (Feb 18, 2026)
For more information about Keurig Dr Pepper Inc., please visit the official website: keurigdrpepper.com