Home > Analyses > Consumer Defensive > Kenvue Inc.
Kenvue shapes daily wellness with iconic brands like Tylenol, Neutrogena, and Band-Aid. It dominates consumer health across self care, skin beauty, and essential health, blending innovation with trusted quality. As a Johnson & Johnson spin-off, Kenvue commands a robust portfolio and global reach. The key question now: does its current valuation reflect sustainable growth amid evolving market dynamics and competitive pressures?
Table of contents
Business Model & Company Overview
Kenvue Inc., founded in 2022 and headquartered in Skillman, New Jersey, stands as a global leader in the Household & Personal Products sector. It operates through a cohesive ecosystem of three segments: Self Care, Skin Health and Beauty, and Essential Health. This structure unites trusted brands like Tylenol, Neutrogena, and Band-Aid under a singular mission to enhance consumer health worldwide.
The company generates value by balancing product sales across diverse categories, combining over-the-counter healthcare, skincare, and essential health products. Its strategic market footprint spans the Americas, Europe, and Asia, leveraging strong brand recognition. Kenvue’s enduring competitive advantage lies in its integrated portfolio and global scale, shaping industry standards and consumer habits for years to come.
Financial Performance & Fundamental Metrics
I analyze Kenvue Inc.’s income statement, key financial ratios, and dividend payout policy to assess its core financial health and shareholder value creation.
Income Statement
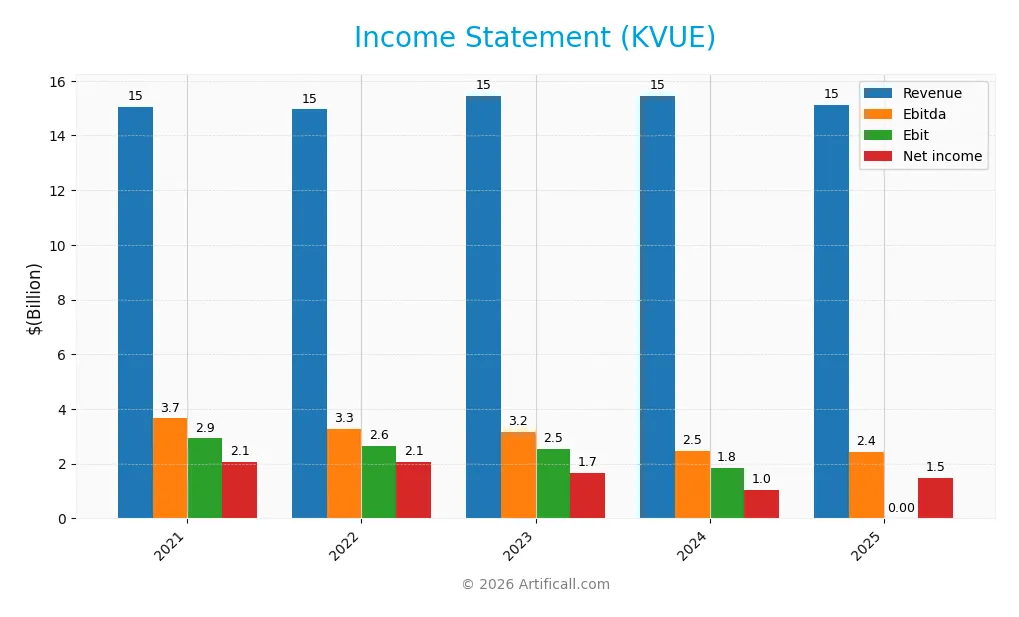
Below is Kenvue Inc.’s income statement summary for fiscal years 2021 through 2025, showing key profitability and expense metrics in USD.
| 2021 | 2022 | 2023 | 2024 | 2025 | |
|---|---|---|---|---|---|
| Revenue | 15.1B | 14.9B | 15.4B | 15.5B | 15.1B |
| Cost of Revenue | 6.6B | 6.7B | 6.8B | 6.5B | 6.3B |
| Operating Expenses | 5.5B | 5.6B | 6.1B | 7.1B | 6.1B |
| Gross Profit | 8.4B | 8.3B | 8.6B | 8.9B | 8.8B |
| EBITDA | 3.7B | 3.3B | 3.2B | 2.5B | 3.3B |
| EBIT | 2.9B | 2.6B | 2.5B | 1.8B | 2.7B |
| Interest Expense | 0 | 0 | 358M | 431M | 379M |
| Net Income | 2.1B | 2.1B | 1.7B | 1.0B | 1.5B |
| EPS | 1.10 | 1.08 | 0.90 | 0.54 | 0.77 |
| Filing Date | 2021-12-31 | 2022-12-31 | 2024-03-01 | 2025-02-24 | 2026-02-20 |
Income Statement Evolution
Kenvue’s revenue edged down by 2.14% in 2025 to $15.1B, continuing a near-flat trend over five years. Gross profit declined slightly, reflecting a marginal contraction in gross margin to 58.13%. Despite this, operating efficiency improved, lifting EBIT margin to a favorable 17.88%, while net income and net margin rebounded strongly after prior declines.
Is the Income Statement Favorable?
In 2025, Kenvue posted $1.47B net income on $15.1B revenue, yielding a 9.72% net margin—markedly favorable compared to prior years. EBIT surged 46.5%, signaling improved operational control despite a 2.14% revenue dip. Interest expense remained low at 2.51% of revenue, supporting earnings. Overall, the fundamentals show a resilient profitability profile amid modest top-line pressure.
Financial Ratios
The following table summarizes key financial ratios for Kenvue Inc. over the last five fiscal years, providing a snapshot of profitability, liquidity, leverage, and valuation metrics:
| Ratios | 2021 | 2022 | 2023 | 2024 | 2025 |
|---|---|---|---|---|---|
| Net Margin | 14% | 14% | 11% | 7% | 10% |
| ROE | 10% | 10% | 15% | 11% | 14% |
| ROIC | 9% | 9% | 8% | 6% | 9% |
| P/E | 24.5 | 25.0 | 23.9 | 39.4 | 22.4 |
| P/B | 2.5 | 2.6 | 3.6 | 4.2 | 3.1 |
| Current Ratio | 1.22 | 1.50 | 1.12 | 0.96 | 0.96 |
| Quick Ratio | 0.80 | 0.93 | 0.78 | 0.69 | 0.68 |
| D/E | 0.01 | 0.45 | 0.75 | 0.90 | 0.79 |
| Debt-to-Assets | 0.005 | 0.33 | 0.30 | 0.34 | 0.31 |
| Interest Coverage | 0 | 0 | 7.0 | 4.3 | 7.1 |
| Asset Turnover | 0.54 | 0.55 | 0.55 | 0.60 | 0.56 |
| Fixed Asset Turnover | 8.2 | 8.2 | 7.6 | 8.4 | 6.8 |
| Dividend Yield | 0% | 0% | 37% | 3.8% | 4.8% |
Evolution of Financial Ratios
Return on Equity (ROE) for Kenvue Inc. fluctuated between 10.2% and 14.8% over recent years, ending at 13.7% in 2025, indicating moderate stability in profitability. The Current Ratio steadily declined from 1.50 in 2022 to 0.96 in 2025, reflecting weakening short-term liquidity. Debt-to-Equity Ratio increased from negligible levels in 2021 to 0.79 in 2025, showing a rise in leverage.
Are the Financial Ratios Favorable?
In 2025, profitability ratios such as ROE (13.7%) and net margin (9.7%) are neutral, suggesting average returns. Liquidity ratios—current ratio (0.96) and quick ratio (0.68)—are unfavorable, signaling potential short-term financial stress. Leverage metrics are neutral with a debt-to-equity of 0.79. The interest coverage ratio of 7.13 and fixed asset turnover of 6.84 are favorable, supporting strong operational efficiency. Overall, the ratios present a slightly favorable profile.
Shareholder Return Policy
Kenvue Inc. pays dividends with a payout ratio slightly above 100%, indicating distributions exceed net income. Its dividend per share has grown modestly, yielding around 4.8%. The company also conducts share buybacks, supporting shareholder returns alongside dividends.
Free cash flow covers most dividend payments, but the payout ratio above net income signals potential distribution risks. The combination of dividends and buybacks currently sustains shareholder value, though elevated payout levels warrant cautious monitoring for long-term sustainability.
Score analysis
The radar chart below illustrates Kenvue Inc.’s key financial scores across valuation, profitability, and leverage metrics:
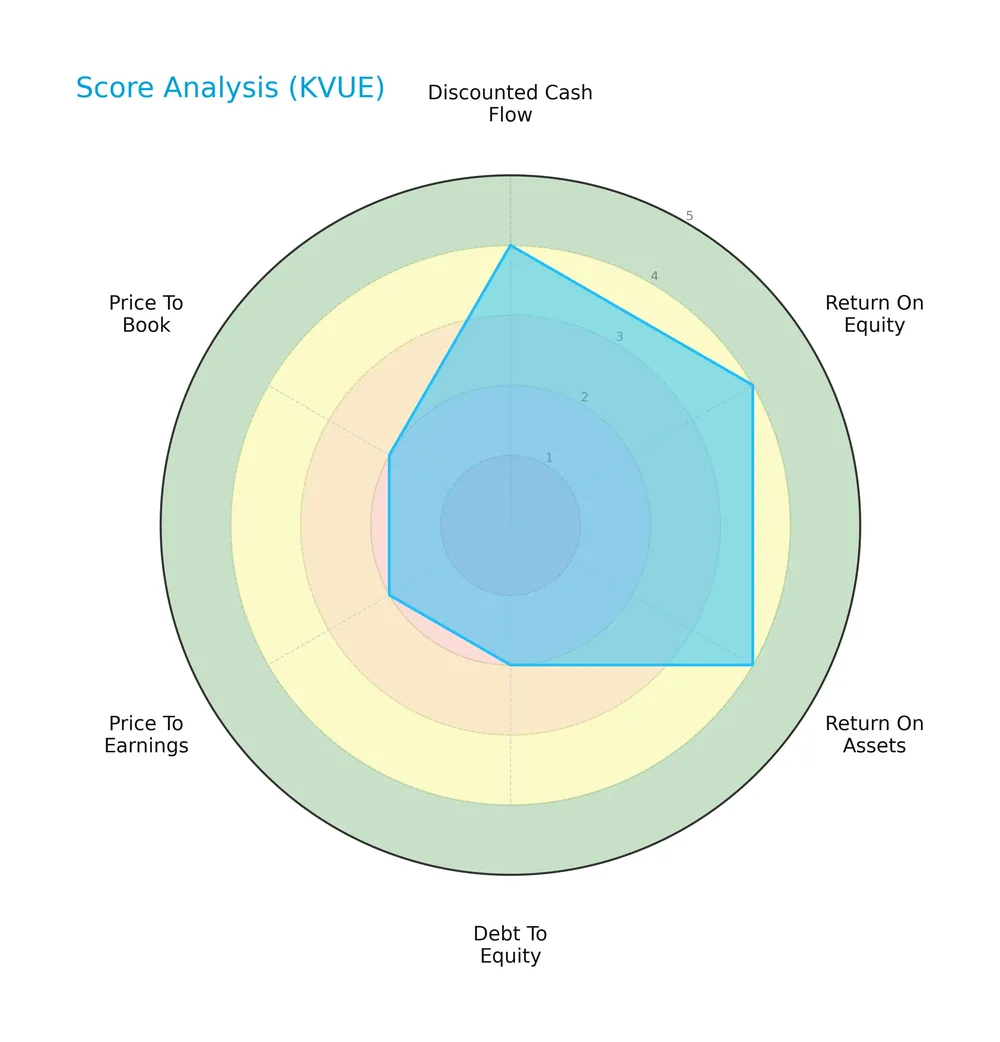
Kenvue’s discounted cash flow score stands at a moderate 3, but profitability metrics ROE and ROA score very unfavorably at 1 each. Debt-to-equity and price-to-book ratios also score poorly, indicating financial strain. The price-to-earnings score is slightly better but still unfavorable at 2.
Analysis of the company’s bankruptcy risk
Kenvue’s Altman Z-Score of 2.17 places it in the grey zone, signaling a moderate risk of bankruptcy and caution for investors:

Is the company in good financial health?
The Piotroski score diagram below reflects Kenvue’s financial strength assessment:

With a Piotroski score of 5, Kenvue shows average financial health. This middling score indicates mixed signals on profitability, leverage, and liquidity, suggesting neither strong nor weak fundamentals at this time.
Competitive Landscape & Sector Positioning
This analysis reviews Kenvue Inc.’s sector positioning, revenue segments, key products, and main competitors. I will assess whether Kenvue holds a competitive advantage over its industry peers.
Strategic Positioning
Kenvue Inc. maintains a diversified product portfolio across three segments: Self Care, Skin Health and Beauty, and Essential Health, with revenues roughly balanced but led by Self Care at $6.4B in 2025. Geographically, it concentrates on North America ($7.3B), while also holding significant presence in EMEA, Asia Pacific, and Latin America.
Revenue by Segment
This pie chart illustrates Kenvue Inc.’s revenue breakdown by product segment for the fiscal year 2025, highlighting contributions from Essential Health, Self Care, and Skin Health and Beauty.
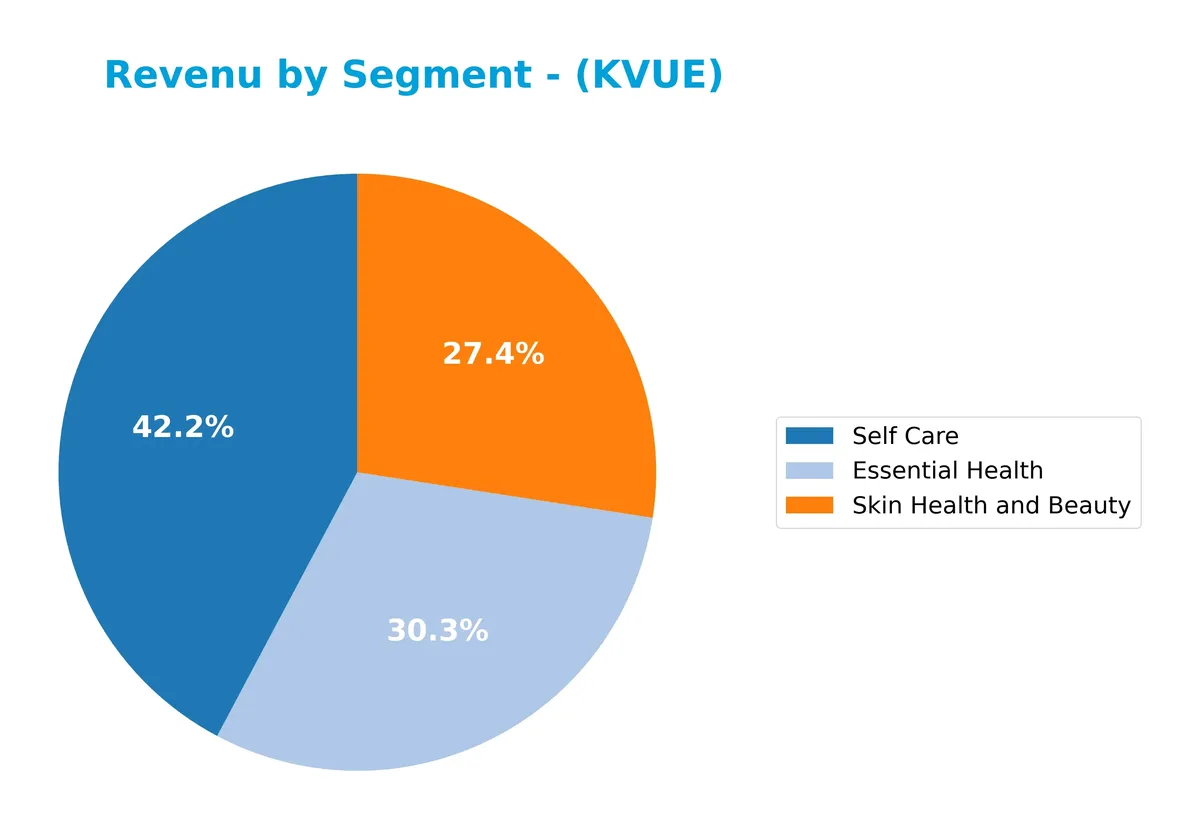
Kenvue’s Self Care segment leads with $6.4B in 2025, showing a slight decline from $6.5B in 2023. Essential Health and Skin Health and Beauty segments hover around $4.6B and $4.1B respectively, both trending modestly downward over three years. The revenue concentration remains stable, but the recent slowdown across all segments signals potential margin pressure and highlights the need for strategic innovation.
Key Products & Brands
Kenvue Inc. generates revenue from three main segments and their leading consumer brands:
| Product | Description |
|---|---|
| Self Care | Products for cough, cold, allergy, pain, digestive health, smoking cessation; includes Tylenol, Nicorette, Zyrtec. |
| Skin Health and Beauty | Face, body, hair, sun care products under Neutrogena, Aveeno, OGX brands. |
| Essential Health | Oral care, baby, women’s health, and wound care products marketed under Listerine, Johnson’s, Band-Aid, Stayfree. |
Kenvue’s product portfolio spans essential health, self care, and skin health, supported by strong, well-known brands. This diversified offering underpins its position in the consumer health sector.
Main Competitors
Seventeen competitors operate in the Household & Personal Products industry, with the table listing the top 10 leaders by market capitalization:
| Competitor | Market Cap. |
|---|---|
| The Procter & Gamble Company | 331B |
| Unilever PLC | 143B |
| Colgate-Palmolive Company | 62.6B |
| The Estée Lauder Companies Inc. | 38.5B |
| Kimberly-Clark Corporation | 33.7B |
| Kenvue Inc. | 33.2B |
| Church & Dwight Co., Inc. | 20.2B |
| The Clorox Company | 12.3B |
| e.l.f. Beauty, Inc. | 4.3B |
| Inter Parfums, Inc. | 2.7B |
Kenvue ranks 6th among its 17 competitors in market capitalization. It holds about 10.8% of the top leader’s market cap, Procter & Gamble. Kenvue stands below the average market cap of the top 10 competitors but remains above the sector’s median. It is closely positioned with Kimberly-Clark, 6.17% above, reflecting a tight cluster in this mid-tier range.
Comparisons with competitors
Check out how we compare the company to its competitors:
Does Kenvue have a competitive advantage?
Kenvue demonstrates a competitive advantage with a ROIC exceeding its WACC by over 3%, indicating efficient capital use and consistent value creation. Its favorable gross margin of 58% and EBIT margin near 18% further support stable profitability.
Looking ahead, Kenvue operates across diverse segments including Self Care and Skin Health, leveraging strong brands like Tylenol and Neutrogena. Continued expansion in global markets, especially Asia Pacific and EMEA, presents opportunities to offset recent revenue declines.
SWOT Analysis
This analysis highlights Kenvue Inc.’s key internal and external factors shaping its strategic outlook.
Strengths
- strong brand portfolio
- favorable gross margin at 58%
- stable competitive advantage with ROIC > WACC
Weaknesses
- declining revenue growth
- low current and quick ratios indicating liquidity risks
- unfavorable price-to-book ratio at 3.06
Opportunities
- expansion in emerging markets
- innovation in consumer health products
- growing demand for self-care and skin health segments
Threats
- intense competition in consumer health
- macroeconomic pressures impacting discretionary spending
- currency fluctuations in global markets
Kenvue benefits from strong brand equity and solid profitability metrics. However, revenue stagnation and liquidity weaknesses require cautious capital management. The company must leverage market expansion and product innovation while mitigating competitive and macro risks to sustain growth.
Stock Price Action Analysis
The weekly stock chart below illustrates Kenvue Inc.’s price movements over the past 100 weeks:
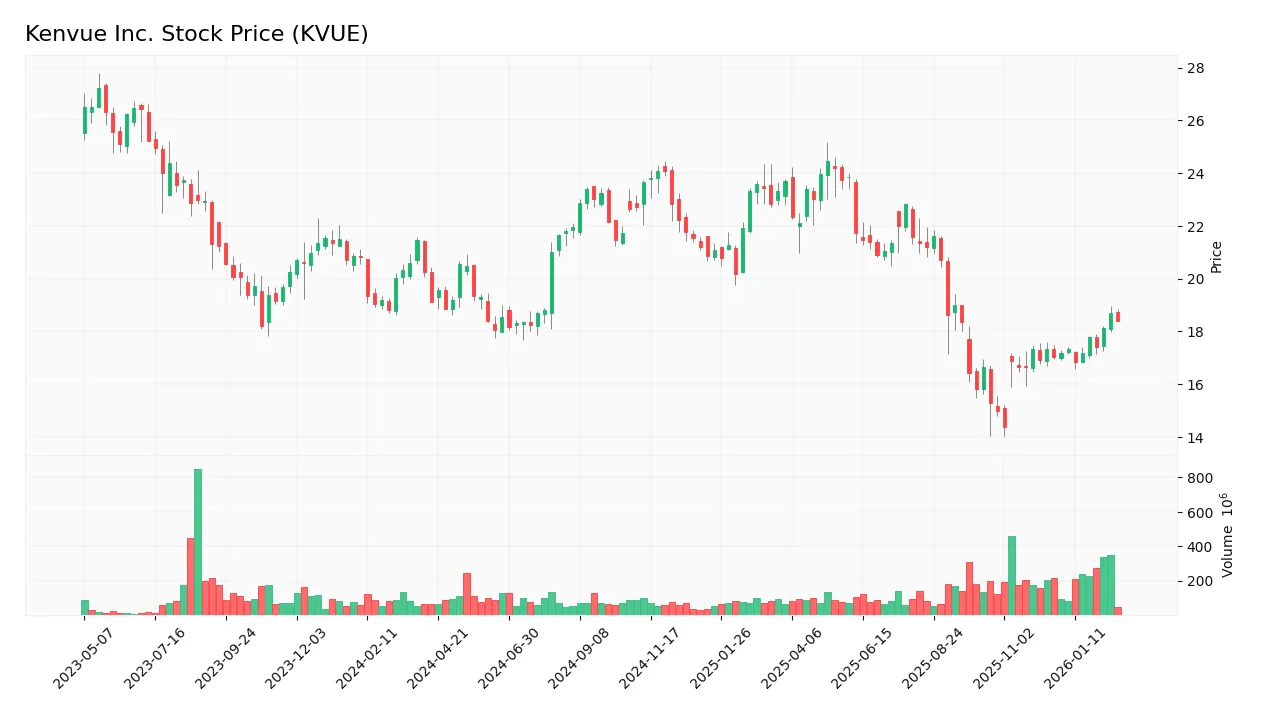
Trend Analysis
Over the past 12 months, KVUE’s price declined by 12.77%, indicating a bearish trend with accelerating downward momentum. The stock traded between a low of 14.37 and a high near 24.44, showing significant volatility (2.51 std dev). Recent months show a 10.57% rebound, signaling a short-term recovery.
Volume Analysis
In the last three months, trading volume increased with buyer dominance at 66.55%. Buyers accounted for 1.71B shares versus 857M sellers, suggesting strong investor interest and positive sentiment driving market participation.
Target Prices
Analysts set a clear target consensus for Kenvue Inc., reflecting moderate upside potential.
| Target Low | Target High | Consensus |
|---|---|---|
| 17 | 22 | 18.57 |
The target range spans 17 to 22, with a consensus near 18.6, indicating cautious optimism among analysts.

Don’t Let Luck Decide Your Entry Point
Optimize your entry points with our advanced ProRealTime indicators. You’ll get efficient buy signals with precise price targets for maximum performance. Start outperforming now!
Analyst & Consumer Opinions
This section examines analyst ratings and consumer feedback to provide a comprehensive view of Kenvue Inc.’s market perception.
Stock Grades
Here are the latest verified analyst grades for Kenvue Inc. from major financial institutions:
| Grading Company | Action | New Grade | Date |
|---|---|---|---|
| UBS | Maintain | Neutral | 2026-02-18 |
| Citigroup | Maintain | Neutral | 2026-02-18 |
| Canaccord Genuity | Maintain | Hold | 2026-02-18 |
| Jefferies | Downgrade | Hold | 2026-01-30 |
| Barclays | Maintain | Equal Weight | 2025-11-10 |
| Canaccord Genuity | Downgrade | Hold | 2025-10-29 |
| Jefferies | Maintain | Buy | 2025-10-27 |
| JP Morgan | Maintain | Overweight | 2025-10-10 |
| Citigroup | Maintain | Neutral | 2025-10-09 |
| B of A Securities | Maintain | Buy | 2025-10-08 |
Most analysts currently rate Kenvue as Hold or Neutral, reflecting a cautious stance. Notably, recent downgrades from Buy to Hold indicate tempered optimism among some firms.
Consumer Opinions
Consumer sentiment around Kenvue Inc. reveals a mix of enthusiasm for product quality and concerns over customer service.
| Positive Reviews | Negative Reviews |
|---|---|
| Products deliver consistent, high-quality results. | Customer support response times are slow. |
| Pricing is fair and competitive in the market. | Shipping delays have affected recent orders. |
| User-friendly product design enhances daily use. | Limited availability in some regional markets. |
Overall, consumers praise Kenvue’s product reliability and pricing. However, recurring issues with customer service and distribution logistics pose risks to customer loyalty.
Risk Analysis
Below is a table summarizing Kenvue Inc.’s key risk factors, with their likelihood and potential impact on the company:
| Category | Description | Probability | Impact |
|---|---|---|---|
| Liquidity Risk | Current and quick ratios below 1 indicate tight liquidity. | High | Moderate |
| Valuation Risk | High price-to-book ratio (3.06) suggests possible overvaluation. | Moderate | Moderate |
| Financial Health | Altman Z-Score in grey zone signals moderate bankruptcy risk. | Moderate | High |
| Profitability | Neutral net margin and ROE reflect stability but no strong growth. | Moderate | Moderate |
| Debt Management | Debt-to-equity ratio near 0.79 is manageable but needs monitoring. | Moderate | Moderate |
| Market Volatility | Beta of 0.55 shows low sensitivity to market swings, reducing risk. | Low | Low |
The most concerning risks are liquidity constraints and the grey zone Altman Z-Score. Recent financials reveal tight short-term liquidity with current and quick ratios below 1, raising red flags in economic downturns. The moderate bankruptcy risk demands close monitoring. Meanwhile, valuation appears stretched relative to book value, suggesting cautious entry points. Overall, Kenvue’s risks require prudent risk management despite stable profitability and favorable interest coverage.
Should You Buy Kenvue Inc.?
Kenvue appears to be creating value with a durable competitive moat and stable profitability. While its leverage profile suggests caution, the overall rating of C- reflects a mixed financial health. This analytical interpretation signals moderate operational efficiency amid financial constraints.
Strength & Efficiency Pillars
Kenvue Inc. maintains solid operational efficiency, evidenced by a gross margin of 58.13% and an EBIT margin of 17.88%. Its net margin at 9.72% and return on equity of 13.66% indicate moderate profitability. Critically, the return on invested capital (8.8%) exceeds the weighted average cost of capital (5.69%), confirming Kenvue as a value creator. This spread signals that the company generates returns above its capital costs, sustaining a competitive advantage despite market headwinds.
Weaknesses and Drawbacks
Kenvue’s Altman Z-Score of 2.17 places it in the grey zone, signaling moderate bankruptcy risk and warranting caution. The current ratio stands at 0.96, below the ideal threshold of 1.0, indicating potential short-term liquidity pressure. Valuation metrics raise concerns: a price-to-book ratio of 3.06 is unfavorable, suggesting the stock is relatively expensive compared to its book value. Additionally, a bearish overall stock trend with a 12.77% decline heightens near-term market risk despite recent buyer dominance.
Our Final Verdict about Kenvue Inc.
Kenvue’s fundamentals suggest a company capable of creating value with stable profitability. However, the grey zone Altman Z-Score means solvency risk remains a significant concern. Despite recent bullish buying activity, the overall bearish trend and liquidity pressures advise a cautious stance. This profile may appear attractive for long-term exposure but also suggests a wait-and-see approach until financial stability improves.
Disclaimer: This content is for informational purposes only and does not constitute financial, investment, or other professional advice. Investing in financial markets involves a significant risk of loss, and past performance is not indicative of future results.
Additional Resources
- Assetmark Inc. Lowers Stock Holdings in Kenvue Inc. $KVUE – MarketBeat (Feb 21, 2026)
- Kenvue: Q4 Earnings Snapshot – KVUE (Feb 17, 2026)
- Kenvue beats quarterly estimates, announces job cuts amid Kimberly-Clark acquisition – Reuters (Feb 17, 2026)
- Is Kenvue’s (KVUE) Profitability Strengthening Despite Softer Sales Altering The Investment Case For Kenvue (KVUE)? – Yahoo Finance (Feb 18, 2026)
- Kimberly-Clark to Acquire Kenvue, Creating a $32 Billion Global Health and Wellness Leader – Kenvue (Nov 03, 2025)
For more information about Kenvue Inc., please visit the official website: kenvue.com