Home > Analyses > Industrials > Kadant Inc.
Kadant Inc. engineers critical technologies that keep the world’s industrial machinery running smoothly every day. As a pioneer in fluid-handling, industrial processing, and material handling systems, Kadant commands respect for its innovation and dependable solutions. Its products power essential sectors like packaging, pulp and paper, and recycling. As market dynamics evolve, I question whether Kadant’s robust fundamentals continue to support its premium valuation and growth trajectory in 2026.

Table of contents
Business Model & Company Overview
Kadant Inc., founded in 1991 and headquartered in Westford, Massachusetts, stands as a leader in industrial machinery. It operates through a cohesive ecosystem of three segments—Flow Control, Industrial Processing, and Material Handling—that deliver engineered systems and technologies globally. Kadant’s products, from fluid-handling systems to conveying equipment, form an integrated platform serving packaging, tissue, wood products, and alternative fuel industries.
The company generates value by balancing durable hardware with consumables and engineered services across the Americas, Europe, and Asia. Its revenue engine thrives on diversified industrial automation, filtration, and material processing solutions. Kadant’s competitive advantage lies in its broad technology portfolio and global footprint, creating a robust economic moat that shapes the future of industrial processing infrastructure.
Financial Performance & Fundamental Metrics
I analyze Kadant Inc.’s income statement, key financial ratios, and dividend payout policy to reveal its core profitability and capital allocation strength.
Income Statement
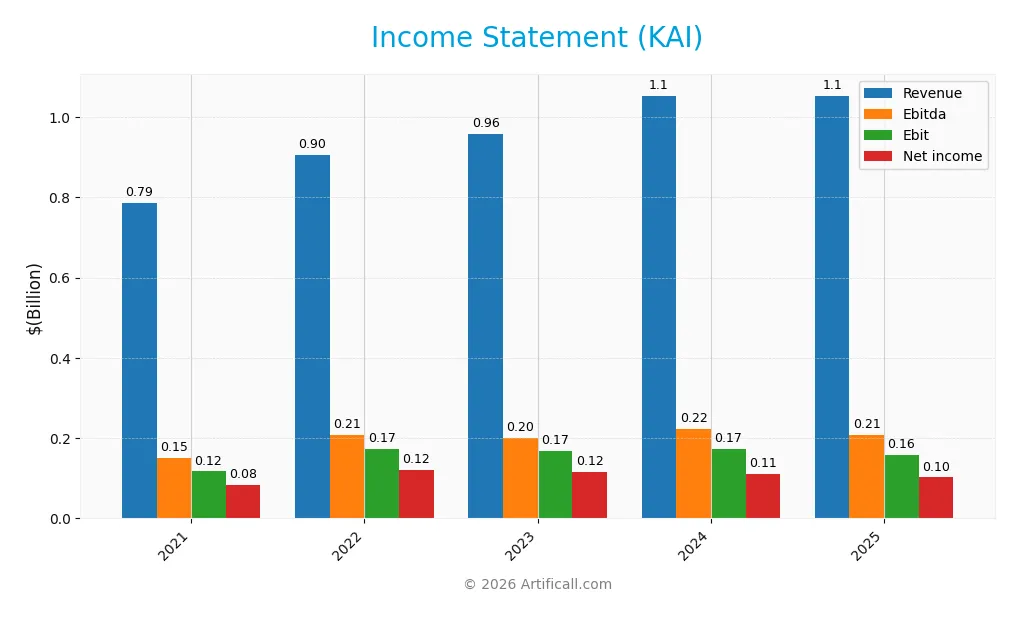
The following table summarizes Kadant Inc.’s key income statement figures for fiscal years 2021 through 2025. All values are in USD.
| 2021 | 2022 | 2023 | 2024 | 2025 | |
|---|---|---|---|---|---|
| Revenue | 787M | 905M | 958M | 1.05B | 1.05B |
| Cost of Revenue | 449M | 515M | 541M | 587M | 577M |
| Operating Expenses | 221M | 218M | 251M | 294M | 317M |
| Gross Profit | 337M | 390M | 416M | 466M | 476M |
| EBITDA | 151M | 207M | 201M | 223M | 209M |
| EBIT | 117M | 172M | 167M | 173M | 157M |
| Interest Expense | 4.8M | 6.5M | 8.4M | 20.0M | 15.6M |
| Net Income | 84.0M | 121M | 116M | 112M | 102M |
| EPS | 7.26 | 10.38 | 9.92 | 9.51 | 8.66 |
| Filing Date | 2022-03-01 | 2023-02-28 | 2024-02-27 | 2025-02-25 | 2026-03-03 |
Income Statement Evolution
Kadant Inc.’s revenue grew 34% from 2021 to 2025, peaking at $1.05B in 2025 but slightly declining by 0.1% in the last year. Net income increased 21% over the period, yet margins contracted slightly, with net margin down 9.3%. Gross margin remained stable near 45%, while EBIT margin fell to 15%, reflecting margin pressures despite revenue growth.
Is the Income Statement Favorable?
The 2025 income statement shows solid fundamentals with a $1.05B revenue and $102M net income, yielding a 9.7% net margin. Interest expense remains low at 1.5% of revenue, supporting profitability. However, EBIT declined 9% year-over-year, and net margin shrank 8.5%, signaling emerging margin challenges. Overall, the income statement is favorable but suggests cautious monitoring of margin trends.
Financial Ratios
The table below presents key financial ratios for Kadant Inc. over the fiscal years 2021 to 2025, illustrating profitability, valuation, liquidity, leverage, and efficiency metrics:
| Ratios | 2021 | 2022 | 2023 | 2024 | 2025 |
|---|---|---|---|---|---|
| Net Margin | 10.7% | 13.4% | 12.1% | 10.6% | 9.7% |
| ROE | 14.9% | 18.5% | 15.0% | 13.2% | 11.7% |
| ROIC | 9.6% | 13.3% | 12.6% | 10.1% | 7.4% |
| P/E | 31.8 | 17.1 | 28.3 | 36.9 | 33.1 |
| P/B | 4.7 | 3.2 | 4.2 | 4.9 | 3.9 |
| Current Ratio | 1.7 | 1.9 | 2.1 | 2.3 | 9.1 |
| Quick Ratio | 1.1 | 1.2 | 1.3 | 1.5 | 5.3 |
| D/E | 0.52 | 0.34 | 0.18 | 0.38 | 0.43 |
| Debt-to-Assets | 26.0% | 19.4% | 11.5% | 22.6% | 23.5% |
| Interest Coverage | 24.2 | 26.4 | 19.7 | 8.6 | 10.1 |
| Asset Turnover | 0.69 | 0.79 | 0.81 | 0.74 | 0.66 |
| Fixed Asset Turnover | 5.9 | 6.4 | 5.8 | 6.2 | 5.4 |
| Dividend Yield | 0.43% | 0.58% | 0.40% | 0.36% | 0.47% |
Evolution of Financial Ratios
Return on Equity (ROE) trended downward from 18.5% in 2022 to 11.7% in 2025, indicating a slowdown in profitability. The Current Ratio showed a sharp increase in 2025 to 9.15, a notable jump from about 2 in previous years, signaling unusual liquidity levels. Debt-to-Equity Ratio remained relatively stable around 0.3-0.5, reflecting consistent leverage management.
Are the Financial Ratios Fovorable?
In 2025, profitability ratios like net margin (9.7%) and ROE (11.7%) are neutral, aligning with a modest profit environment. Liquidity is mixed; the high current ratio (9.15) is unfavorable due to inefficiency risk, but the quick ratio (5.27) is favorable. Leverage ratios, including debt-to-equity (0.43) and interest coverage (10.1), appear solid. Market valuation ratios such as P/E (33.1) and dividend yield (0.47%) are unfavorable, suggesting valuation concerns. Overall, the ratio profile is slightly favorable.
Shareholder Return Policy
Kadant Inc. maintains a consistent dividend payout ratio near 13-15% with a steady dividend per share increase, yielding around 0.36% to 0.58% annually. The company supports dividends through strong free cash flow and moderate payout, reflecting prudent capital allocation.
The firm also engages in share buybacks, complementing its return strategy. This balanced approach appears sustainable, aligning dividend payments and buybacks with cash generation to support long-term shareholder value without excessive financial risk.
Score analysis
The following radar chart displays Kadant Inc.’s key financial scores for investor consideration:
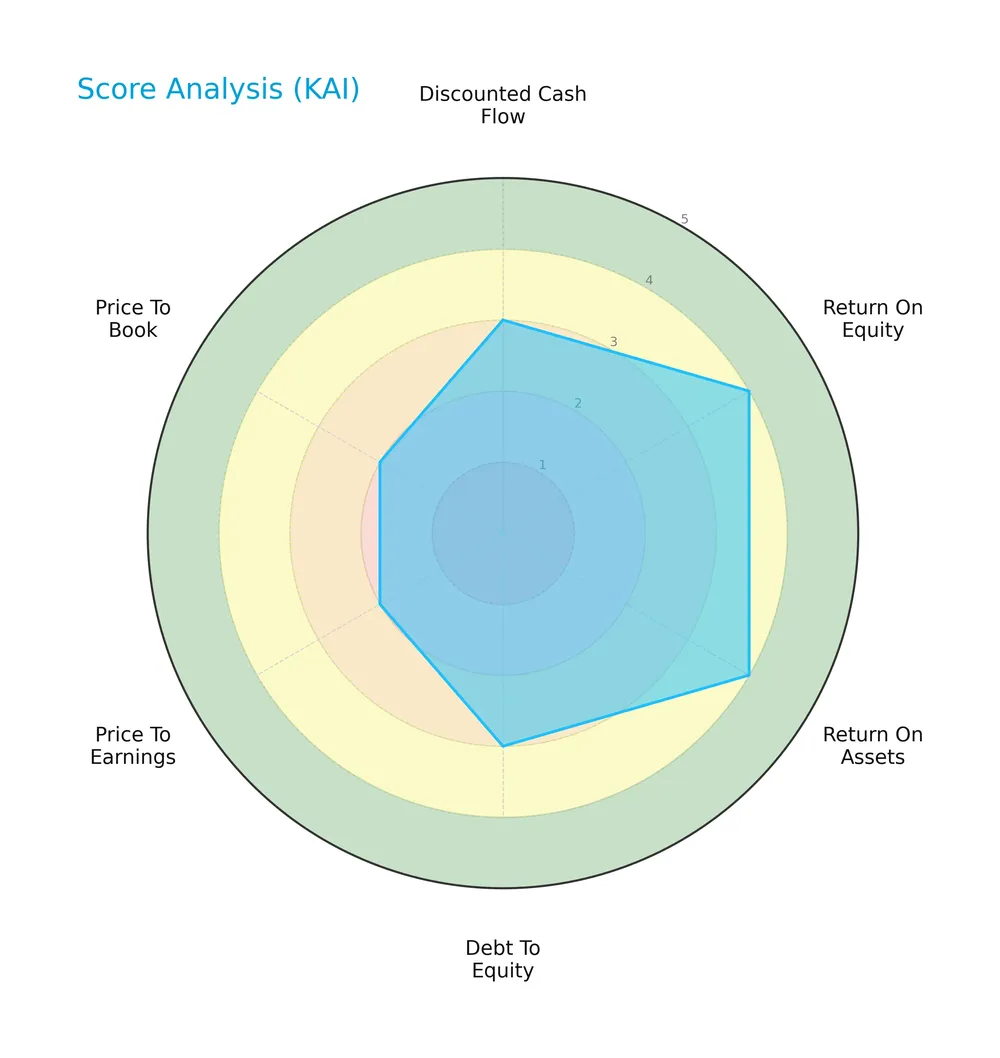
Kadant Inc. scores moderately on discounted cash flow and debt to equity, and favorably on return on equity and assets. Price-to-earnings and price-to-book ratios are less attractive, reflecting valuation concerns.
Analysis of the company’s bankruptcy risk
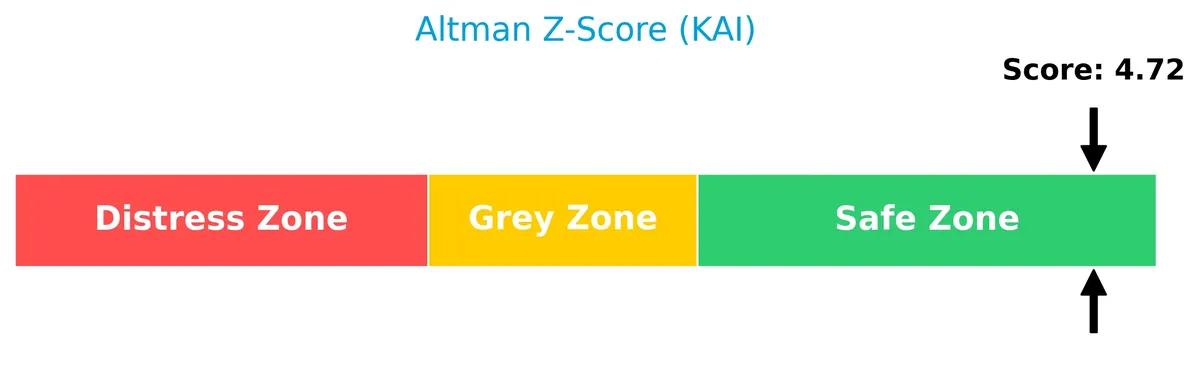
Kadant Inc.’s Altman Z-Score places it comfortably in the safe zone, indicating low bankruptcy risk and financial stability:
Is the company in good financial health?
The Piotroski Score diagram illustrates Kadant Inc.’s financial health based on nine criteria:

With a score of 6, Kadant Inc. shows average financial strength, suggesting moderate operational efficiency and profitability but room for improvement.
Competitive Landscape & Sector Positioning
This analysis examines Kadant Inc.’s strategic positioning, revenue by segment, key products, and main competitors. I will assess whether Kadant holds a competitive advantage within the industrial machinery sector.
Strategic Positioning
Kadant Inc. operates a diversified product portfolio across Flow Control, Industrial Processing, and Material Handling segments. Geographically, it generates most revenue from North America (656M in 2025), followed by Europe (242M), Asia (88M), and Rest of World (66M), reflecting broad global exposure within industrial machinery.
Revenue by Segment
This pie chart illustrates Kadant Inc.’s revenue breakdown for fiscal year 2025, highlighting the contribution of key product segments in USD.
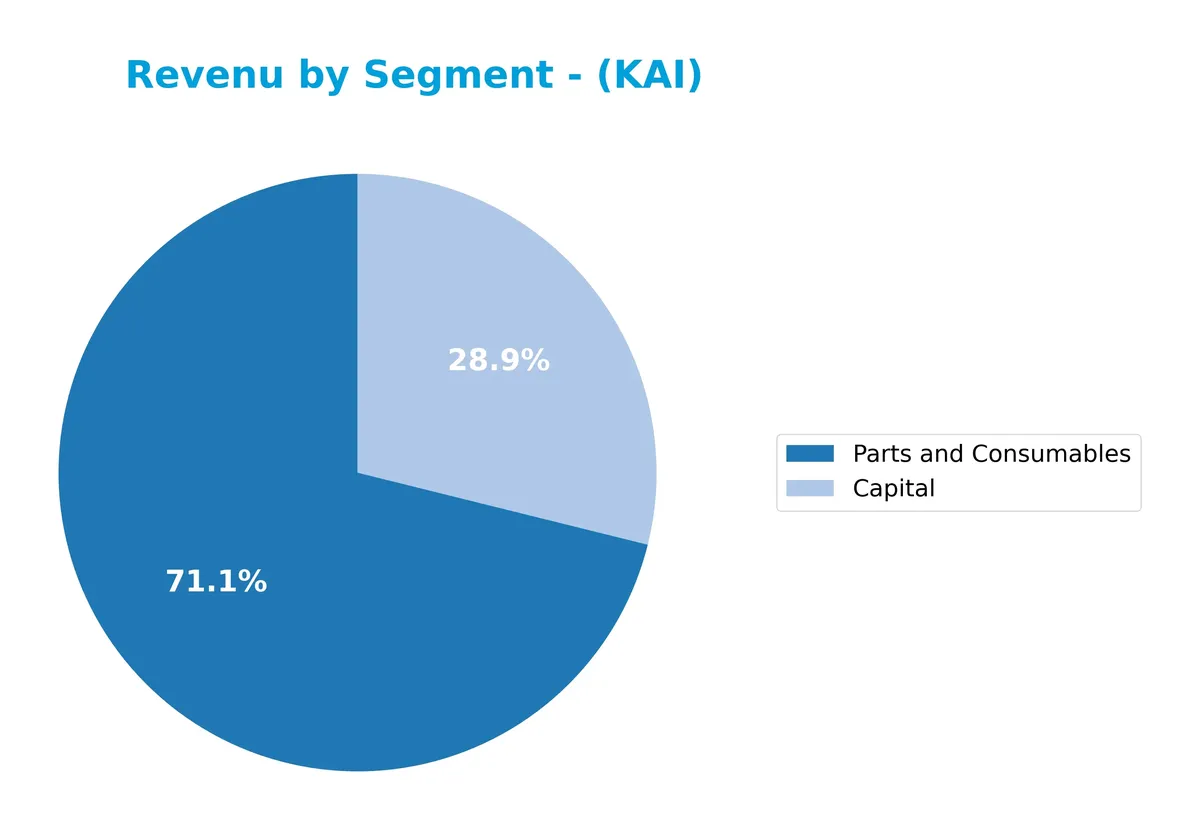
Kadant’s revenue is primarily driven by Parts and Consumables at $748M, followed by Capital equipment at $304M. Historically, I’ve seen Parts and Consumables gain momentum as recurring revenue, reflecting strong customer retention. The slight decline in Capital sales from $360M in 2024 to $304M in 2025 signals some volatility in large equipment orders. This mix underscores a moderate concentration risk but also a stable aftermarket revenue base.
Key Products & Brands
Kadant Inc. operates with diverse products across three main segments, detailed below:
| Product | Description |
|---|---|
| Flow Control Systems | Fluid-handling systems including rotary joints, syphons, turbulator bars, expansion joints, and engineered steam and condensate systems. Doctoring, cleaning, and filtration systems with consumables such as doctor blades and fabric-conditioning systems. |
| Industrial Processing Equipment | Machinery like ring and rotary debarkers, stranders, chippers, logging equipment, and industrial automation systems. Used in packaging, tissue, wood products, and alternative fuels industries. |
| Material Handling Equipment | Conveying and vibratory equipment, balers, and related machinery. Also produces biodegradable absorbent granules for agricultural and oil absorption applications. |
| Capital Products | Machinery and engineered systems capital goods segment, generating over $300M in recent fiscal years. |
| Parts and Consumables | Consumable components and parts supporting Kadant’s equipment, with revenues exceeding $700M in 2025. |
Kadant’s product portfolio spans engineered systems critical to industrial processing, fluid handling, and material movement. The company generates substantial revenue from both capital equipment and recurring consumables, reflecting a balanced business model.
Main Competitors
Kadant Inc. faces 24 competitors in the Industrials sector. Below is a table of the top 10 leaders by market capitalization:
| Competitor | Market Cap. |
|---|---|
| Eaton Corporation plc | 127B |
| Parker-Hannifin Corporation | 114B |
| Howmet Aerospace Inc. | 85.2B |
| Emerson Electric Co. | 76.3B |
| Illinois Tool Works Inc. | 73B |
| Cummins Inc. | 71.9B |
| AMETEK, Inc. | 48.3B |
| Roper Technologies, Inc. | 46.8B |
| Rockwell Automation, Inc. | 44.8B |
| Symbotic Inc. | 35.9B |
Kadant Inc. ranks 22nd among 24 competitors, with a market cap just 3.19% of the leader Eaton Corporation plc. The company sits well below both the average market cap of the top 10 competitors (72.4B) and the sector median (32.4B). It also maintains a significant 62.6% gap to its closest competitor above, highlighting a modest scale within this competitive landscape.
Comparisons with competitors
Check out how we compare the company to its competitors:
Does Kadant Inc. have a competitive advantage?
Kadant Inc. does not present a competitive advantage, as it destroys value with a ROIC below WACC and a declining profitability trend over 2021-2025. This very unfavorable moat status signals inefficiency in capital use and weakening economic profit generation.
Looking ahead, Kadant’s diverse product portfolio spans flow control, industrial processing, and material handling. Growth opportunities exist in expanding markets, especially in Asia and Europe, though recent revenue growth has slowed slightly, indicating cautious optimism for future performance.
SWOT Analysis
This SWOT analysis highlights Kadant Inc.’s core competitive position and strategic challenges in 2026.
Strengths
- Strong gross margin at 45%
- Favorable interest coverage ratio of 10.1
- Diversified global footprint with strong North American presence
Weaknesses
- Declining ROIC, shedding value
- High PE and PB ratios indicating possible overvaluation
- Recent EPS and net margin contraction
Opportunities
- Growth potential in industrial automation
- Expansion in European and Asian markets
- Increasing demand for sustainable material handling solutions
Threats
- Economic cyclicality affecting industrial machinery
- Rising raw material costs pressure margins
- Competitive pressure from larger industry players
Kadant’s strengths in margin and global reach support resilience. However, deteriorating profitability and valuation concerns require strategic focus on operational efficiency and innovation to capture growth and mitigate external risks.
Stock Price Action Analysis
The weekly stock chart for Kadant Inc. (KAI) displays price movement and volatility trends over the past 12 months:
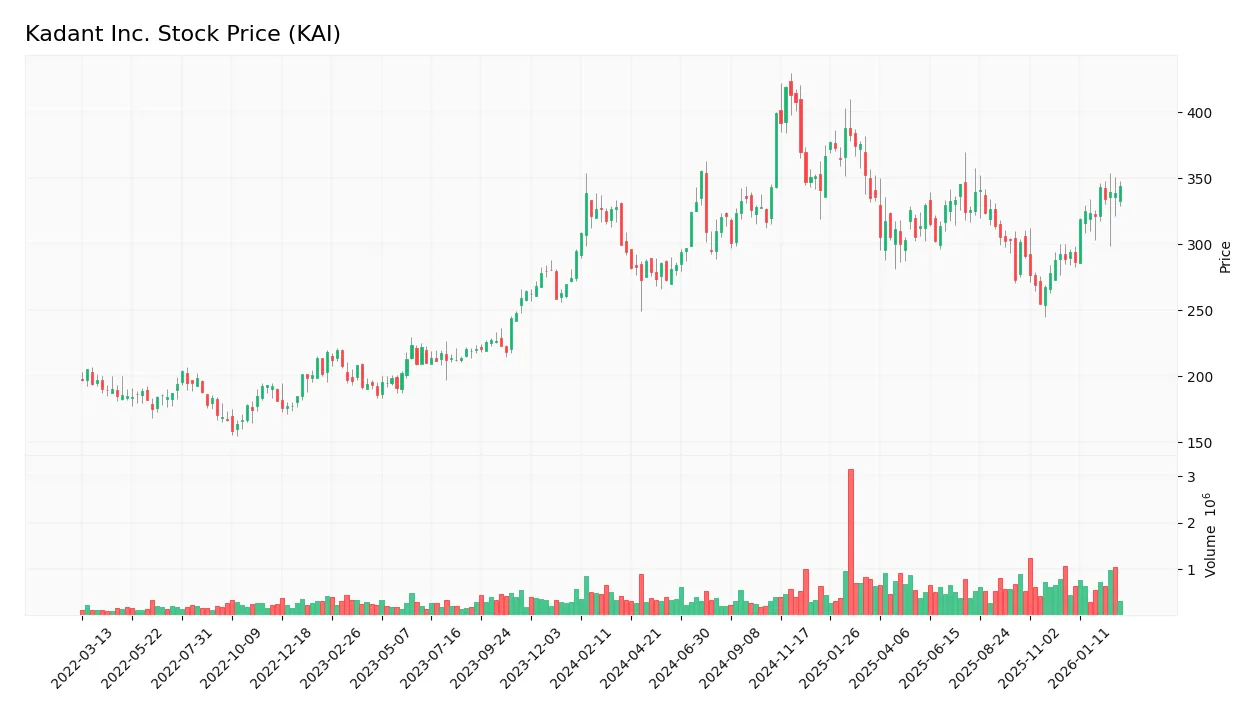
Trend Analysis
Over the past 12 months, KAI’s stock price increased by 17.26%, indicating a bullish trend. The trend shows acceleration with higher highs near 419.01 and lows around 254.91. Price volatility remains elevated with a standard deviation of 34.56, signaling dynamic market activity.
Volume Analysis
Trading volume is increasing, with a total of 65M shares traded in the last year. Buyer volume accounts for 50.49%, slightly exceeding seller volume, suggesting balanced but buyer-leaning interest. Recent three-month data show neutral buyer behavior with sellers slightly dominating at 47.45%, indicating cautious investor sentiment.
Target Prices
Analysts show a unified target price for Kadant Inc., reflecting clear market expectations.
| Target Low | Target High | Consensus |
|---|---|---|
| 303 | 303 | 303 |
The consensus target price of 303 signals strong confidence among analysts, with no divergence in their outlook.

Don’t Let Luck Decide Your Entry Point
Optimize your entry points with our advanced ProRealTime indicators. You’ll get efficient buy signals with precise price targets for maximum performance. Start outperforming now!
Analyst & Consumer Opinions
This section examines recent analyst ratings and consumer feedback regarding Kadant Inc. (KAI) to gauge market sentiment.
Stock Grades
Here are the latest verified stock grades for Kadant Inc. from recognized research firms:
| Grading Company | Action | New Grade | Date |
|---|---|---|---|
| Barrington Research | Maintain | Outperform | 2026-02-24 |
| Barrington Research | Maintain | Outperform | 2026-02-19 |
| Barrington Research | Maintain | Outperform | 2026-02-18 |
| DA Davidson | Maintain | Neutral | 2026-02-09 |
| DA Davidson | Maintain | Neutral | 2026-02-04 |
| Barrington Research | Maintain | Outperform | 2026-02-03 |
| Barrington Research | Maintain | Outperform | 2025-10-30 |
| Barrington Research | Maintain | Outperform | 2025-10-29 |
| Barrington Research | Maintain | Outperform | 2025-10-27 |
| Barrington Research | Maintain | Outperform | 2025-10-10 |
Barrington Research consistently maintains an Outperform rating for Kadant, indicating confidence in the company’s prospects. DA Davidson holds a more cautious Neutral stance, showing some divergence among analysts.
Consumer Opinions
Kadant Inc. draws mixed consumer sentiment, reflecting its niche industrial focus and service execution.
| Positive Reviews | Negative Reviews |
|---|---|
| Reliable product quality meeting industrial standards. | Customer service response times can lag. |
| Durable machinery that reduces downtime significantly. | Pricing perceived as high compared to competitors. |
| Strong technical support appreciated by long-term clients. | Limited product customization options noted. |
Overall, consumers praise Kadant’s product durability and technical support. However, concerns about pricing and customer service speed persist, signaling areas for operational improvement.
Risk Analysis
Below is a summary of key risks facing Kadant Inc., highlighting their likelihood and potential impact:
| Category | Description | Probability | Impact |
|---|---|---|---|
| Valuation Risk | Elevated P/E (33.07) and P/B (3.88) ratios may indicate overvaluation relative to peers. | Medium | High |
| Liquidity Risk | Current ratio is very high (9.15), possibly signaling inefficient asset use or receivables buildup. | Low | Medium |
| Market Volatility | Beta of 1.23 suggests stock price moves more than the market, increasing downside risk. | Medium | Medium |
| Operational Risk | Dependency on industrial machinery sector exposes Kadant to cyclical demand fluctuations. | Medium | Medium |
| Financial Health | Altman Z-Score (4.72) places company in safe zone, mitigating bankruptcy risk. | Low | Low |
| Profitability Risk | ROIC (7.39%) below WACC (8.89%) implies potential value destruction if trend persists. | Medium | High |
| Dividend Yield | Low yield (0.47%) may deter income-focused investors, limiting shareholder appeal. | Low | Low |
Kadant’s most pressing risks stem from its high valuation multiples and ROIC trailing its cost of capital. This combination raises concerns about sustainable value creation. The stock’s beta above 1.2 signals sensitivity to market swings, demanding caution. However, strong liquidity and solid Altman Z-Score provide some safety buffers against financial distress.
Should You Buy Kadant Inc.?
Kadant Inc. appears to be managing a moderate leverage profile with improving profitability, yet it faces a very unfavorable moat due to declining ROIC relative to WACC. Supported by a B+ rating, the company suggests a profile of cautious operational efficiency amid value erosion risks.
Strength & Efficiency Pillars
Kadant Inc. posts solid operational margins with a gross margin of 45.21% and an EBIT margin of 14.95%, reflecting efficient cost management. Its net margin stands at a respectable 9.69%, supporting steady profitability. The return on equity of 11.73% signals moderate shareholder value creation. However, the company’s ROIC of 7.39% falls slightly below its WACC of 8.89%, indicating it is currently not a value creator. Still, Kadant’s interest coverage ratio of 10.1 and favorable debt metrics underscore operational resilience.
Weaknesses and Drawbacks
Kadant faces valuation headwinds, trading at a high P/E of 33.07 and a P/B of 3.88, suggesting an expensive premium relative to earnings and book value. The elevated current ratio of 9.15, while appearing conservative, may indicate inefficient asset utilization or excessive liquidity. Although debt-to-equity sits at a moderate 0.43, the company shows vulnerability in recent earnings trends, with declining EBIT and net margin growth over the past year. Buyer dominance at 47.45% during the recent period signals neutral market sentiment, limiting immediate upside momentum.
Our Final Verdict about Kadant Inc.
Kadant’s financial profile could appeal to investors seeking operational stability amid moderate valuation risk. Despite the firm’s bullish long-term trend and improving volume, recent neutral buyer dominance suggests a cautious stance. The high valuation multiples and mixed earnings growth warn that the stock might appear overextended in the short term. Overall, Kadant may present a strategic hold opportunity, but investors might prefer waiting for clearer market conviction before increasing exposure.
Disclaimer: This content is for informational purposes only and does not constitute financial, investment, or other professional advice. Investing in financial markets involves a significant risk of loss, and past performance is not indicative of future results.
Additional Resources
- Kadant Inc (KAI) Releases Q4 2025 Earnings: Revenue Up, EPS Flat – Quiver Quantitative (Mar 03, 2026)
- Decoding Kadant Inc (KAI): A Strategic SWOT Insight – GuruFocus (Mar 04, 2026)
- What Makes Kadant (KAI) a High-Quality, Durable Compounder? – Insider Monkey (Mar 04, 2026)
- Kadant Inc. (NYSE: KAI) expands via deals and reports higher backlog – Stock Titan (Mar 03, 2026)
- JPMorgan Chase & Co. Buys 58,382 Shares of Kadant Inc $KAI – MarketBeat (Mar 01, 2026)
For more information about Kadant Inc., please visit the official website: kadant.com