Home > Analyses > Financial Services > JPMorgan Chase & Co.
JPMorgan Chase & Co. powers the financial engine behind millions of daily transactions worldwide. As the largest U.S. bank by assets, it dominates diverse sectors from consumer banking to investment services. Its flagship offerings blend innovation with trusted expertise, shaping markets and investor confidence. I’ve observed that its strategic capital allocation and risk management set it apart. The key question: does JPMorgan’s robust foundation still justify its premium valuation and growth outlook in 2026?

Table of contents
Business Model & Company Overview
JPMorgan Chase & Co., founded in 1799 and headquartered in New York City, stands as a dominant force in diversified banking. Its core business integrates Consumer & Community Banking, Corporate & Investment Bank, Commercial Banking, and Asset & Wealth Management into a cohesive financial ecosystem. This structure supports a wide array of services, from retail lending and payments to sophisticated investment banking and asset management solutions.
The company’s revenue engine balances traditional banking with innovative financial services across the Americas, Europe, and Asia. Recurring income streams include deposit products, loan servicing, and wealth management fees, complemented by capital markets and advisory services. Its competitive advantage lies in scale and diversified offerings, creating a robust economic moat that shapes the future of global financial services.
Financial Performance & Fundamental Metrics
I analyze JPMorgan Chase & Co.’s income statement, key financial ratios, and dividend payout policy to assess its core financial health and shareholder returns.
Income Statement
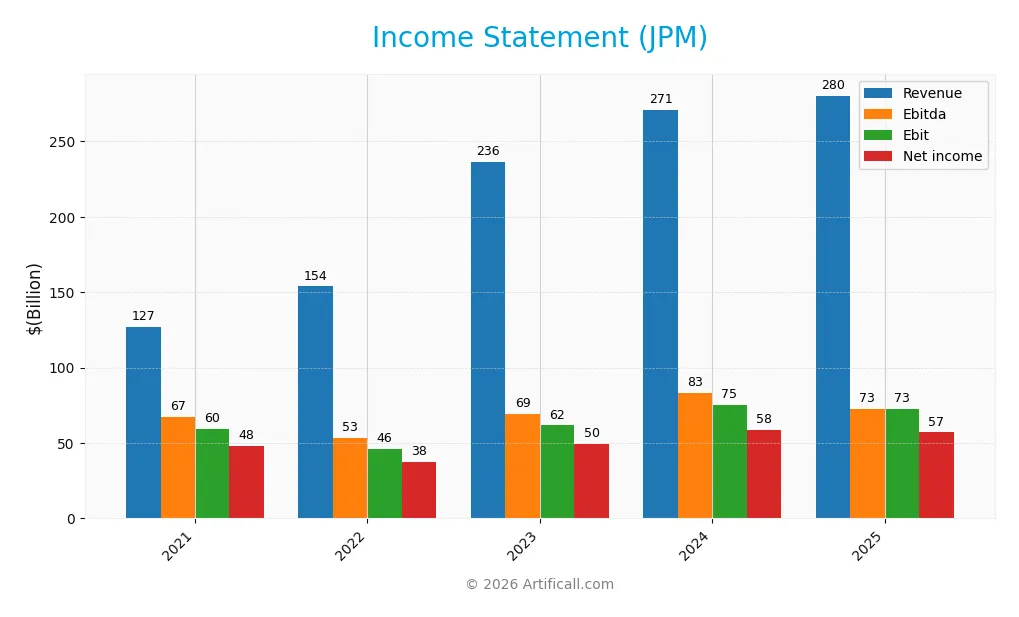
The table below summarizes JPMorgan Chase & Co.’s annual income statement figures for the past five fiscal years, reflecting core profitability and earnings metrics.
| 2021 | 2022 | 2023 | 2024 | 2025 | |
|---|---|---|---|---|---|
| Revenue | 127.2B | 153.8B | 236.3B | 270.8B | 280.3B |
| Cost of Revenue | -3.7B | 32.4B | 90.6B | 112.0B | 112.1B |
| Operating Expenses | 71.3B | 75.2B | 84.1B | 83.7B | 95.6B |
| Gross Profit | 130.9B | 121.4B | 145.7B | 158.8B | 168.2B |
| EBITDA | 67.5B | 53.2B | 69.1B | 83.0B | 72.6B |
| EBIT | 59.6B | 46.2B | 61.6B | 75.1B | 72.6B |
| Interest Expense | 5.6B | 26.1B | 81.3B | 101.4B | 97.9B |
| Net Income | 48.3B | 37.7B | 49.6B | 58.5B | 57.0B |
| EPS | 15.39 | 12.10 | 16.25 | 19.79 | 20.09 |
| Filing Date | 2022-02-22 | 2023-02-21 | 2024-02-16 | 2025-02-14 | 2026-02-13 |
Income Statement Evolution
JPMorgan Chase’s revenue rose by 3.5% in 2025, maintaining a steady growth trajectory since 2021 with overall growth exceeding 120%. Gross profit improved by nearly 6% last year, while EBIT declined 3.3%, reflecting margin pressures. Net income grew 18% over the period but saw a 5.8% dip in net margin in the latest year, signaling margin contraction despite top-line gains.
Is the Income Statement Favorable?
The 2025 income statement shows favorable gross and EBIT margins at 60% and 25.9%, respectively, supporting strong operational efficiency. However, interest expense remains high at 34.9% of revenue, weighing on net profits. Net margin stands at a positive 20.4%, though it contracted year-over-year. Overall, the fundamentals present a balanced profile with solid profitability tempered by rising costs.
Financial Ratios
The following table presents key financial ratios for JPMorgan Chase & Co. over the past five fiscal years, illustrating profitability, valuation, liquidity, leverage, and efficiency metrics:
| Ratios | 2021 | 2022 | 2023 | 2024 | 2025 |
|---|---|---|---|---|---|
| Net Margin | 38% | 24% | 21% | 22% | 20% |
| ROE | 16% | 13% | 15% | 17% | 16% |
| ROIC | 6% | 4% | 4% | 5% | 1% |
| P/E | 9.9 | 10.6 | 10.1 | 11.8 | 15.8 |
| P/B | 1.63 | 1.36 | 1.52 | 2.00 | 2.48 |
| Current Ratio | 0.36 | 0.29 | 0.31 | 0.65 | 14.85 |
| Quick Ratio | 0.36 | 0.29 | 0.31 | 0.65 | 14.85 |
| D/E | 1.87 | 1.86 | 1.99 | 2.18 | 1.38 |
| Debt-to-Assets | 15% | 15% | 17% | 19% | 11% |
| Interest Coverage | 11 | 1.8 | 0.76 | 0.74 | 0.74 |
| Asset Turnover | 0.03 | 0.04 | 0.06 | 0.07 | 0.06 |
| Fixed Asset Turnover | 4.7 | 5.5 | 7.8 | 8.4 | 7.7 |
| Dividend Yield | 2.7% | 3.4% | 2.7% | 2.1% | 1.9% |
Evolution of Financial Ratios
Return on Equity (ROE) showed moderate fluctuation, peaking near 16.9% in 2024 before settling at 15.7% in 2025. The Current Ratio exhibited a sharp increase to 14.85 in 2025, diverging from prior stable levels around 0.3 to 0.6. Debt-to-Equity Ratio declined from over 2.1 in 2024 to 1.38 in 2025, indicating improved leverage control. Profitability remained stable with net margins near 20%.
Are the Financial Ratios Favorable?
Profitability ratios such as net margin (20.35%) and ROE (15.74%) are favorable, reflecting solid earnings generation. Liquidity is mixed; the extremely high Current Ratio (14.85) is unfavorable, but the Quick Ratio matches it and is favorable. Leverage shows concern with a Debt-to-Equity of 1.38 and low interest coverage (0.74). Asset turnover is weak (0.06), while fixed asset turnover (7.73) is strong. Market valuation ratios remain neutral. Overall, the profile is slightly unfavorable.
Shareholder Return Policy
JPMorgan Chase pays consistent dividends with a payout ratio around 27-36% and a dividend yield near 2-3.4%. The dividend per share increased steadily, supported by free cash flow coverage exceeding dividends and zero capital expenditures.
The company also engages in share buybacks, balancing cash returns with reinvestment. This disciplined approach aligns with sustainable long-term shareholder value creation, as payout ratios remain moderate and cash flow coverage robust, mitigating risks of over-distribution.
Score analysis
The radar chart below highlights JPMorgan Chase & Co.’s key valuation and financial performance scores:
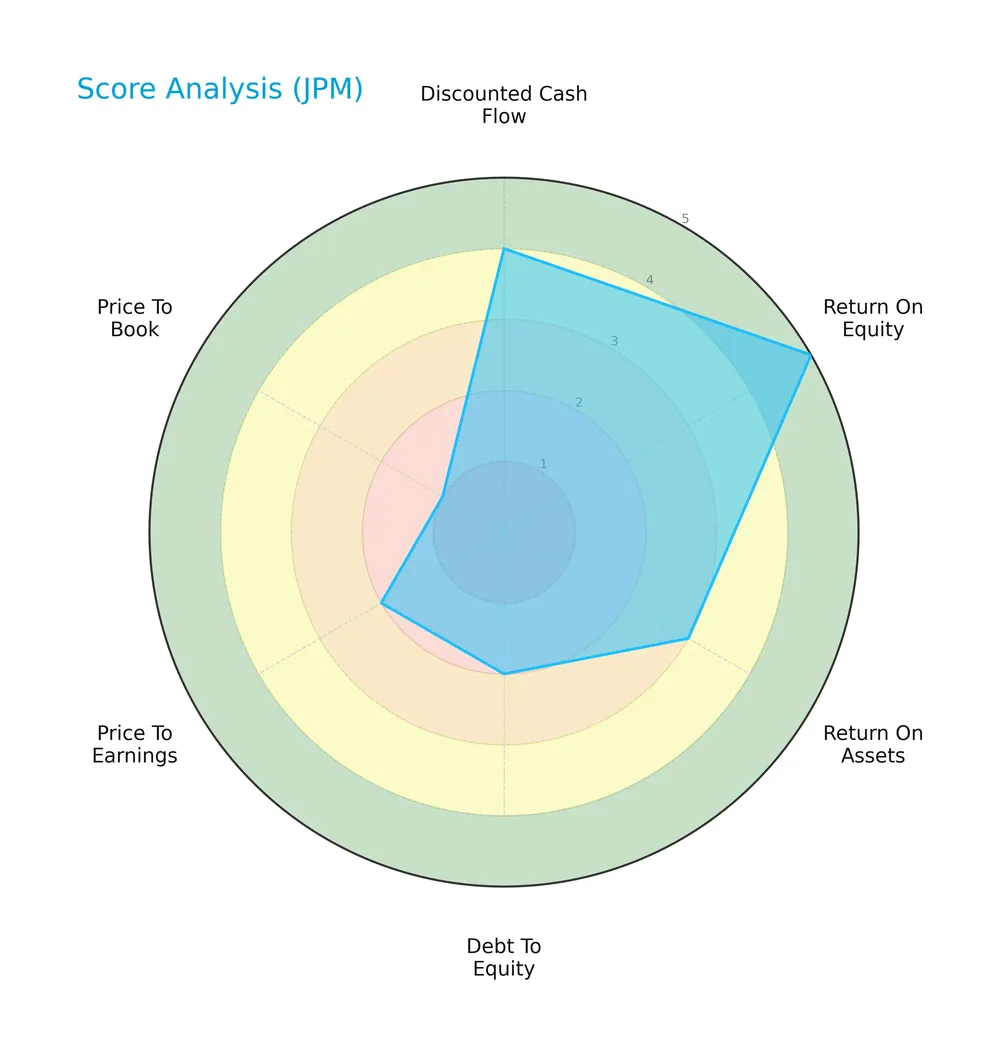
JPM shows strong discounted cash flow and return on equity scores, indicating solid profitability and valuation. However, debt to equity, price to earnings, and price to book scores reveal weaknesses in leverage and market pricing metrics.
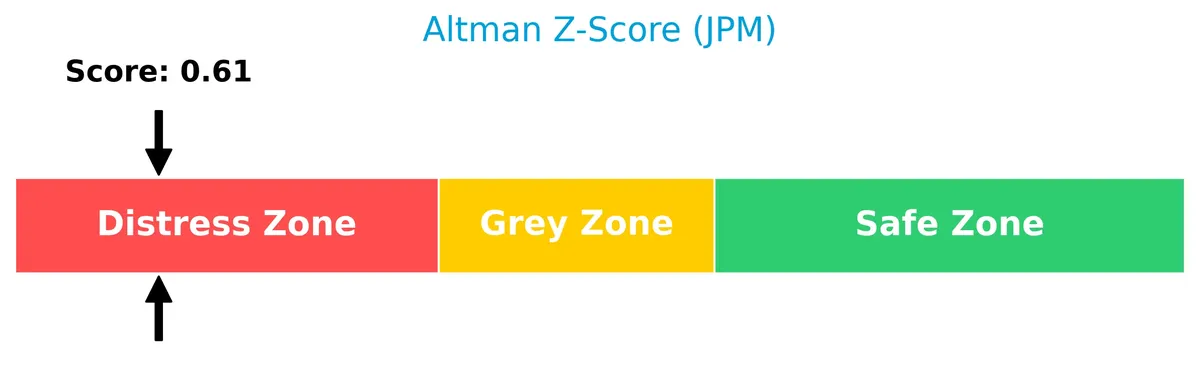
Analysis of the company’s bankruptcy risk
JPMorgan Chase is currently in the distress zone, signaling a high risk of financial distress and potential bankruptcy:
Is the company in good financial health?
The Piotroski Score diagram reflects JPMorgan Chase’s moderate financial health status:

With a Piotroski score of 4, the company’s financial strength is average, indicating room for improvement in profitability, liquidity, or efficiency measures.
Competitive Landscape & Sector Positioning
This sector analysis examines JPMorgan Chase & Co.’s strategic positioning, revenue streams, products, and competitors. I will assess whether JPMorgan Chase holds a competitive advantage over its peers in diversified banking and financial services.
Strategic Positioning
JPMorgan Chase operates a diversified portfolio across four segments: Consumer & Community Banking, Corporate & Investment Bank, Commercial Banking, and Asset & Wealth Management. Its revenue derives predominantly from North America, supplemented by significant presence in EMEA, Asia Pacific, and Latin America, reflecting broad geographic exposure.
Revenue by Segment
This pie chart illustrates JPMorgan Chase & Co.’s revenue distribution by segment for the fiscal year 2025, highlighting key business drivers and segment contributions.
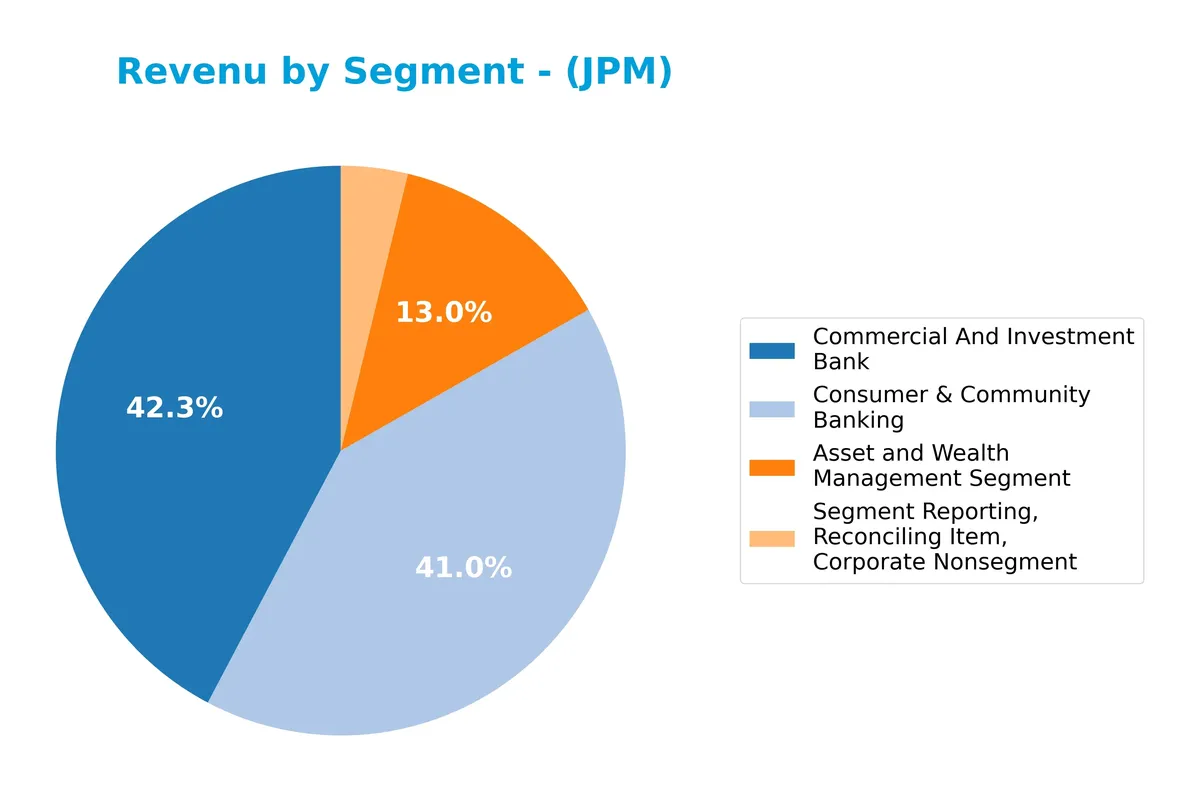
In 2025, the Commercial and Investment Bank leads with $78.5B, followed closely by Consumer & Community Banking at $76B. Asset and Wealth Management contributes $24.1B, showing steady growth from prior years. Despite a negative reconciling item of -$3.1B, the core segments exhibit robust expansion. The concentration remains balanced between banking and wealth management, reflecting JPMorgan’s diversified revenue base.
Key Products & Brands
JPMorgan Chase & Co.’s primary business segments and their product offerings include the following:
| Product | Description |
|---|---|
| Consumer & Community Banking (CCB) | Deposit, investment, lending products, payments, mortgages, credit cards, auto loans, and leasing. |
| Corporate & Investment Bank (CIB) | Investment banking, capital raising, loan syndication, payments, risk management, prime brokerage. |
| Commercial Banking (CB) | Lending, payments, investment banking, asset management for businesses, local governments, real estate. |
| Asset & Wealth Management (AWM) | Multi-asset investment management, retirement products, brokerage, custody, trusts, loans, mortgages. |
JPMorgan Chase operates a diversified financial services platform. Its segments serve consumers, businesses, and institutional clients with a broad range of banking, investment, and wealth management products.
Main Competitors
There are 4 main competitors in the Banks – Diversified industry, with the table below listing the top 4 leaders by market capitalization:
| Competitor | Market Cap. |
|---|---|
| JPMorgan Chase & Co. | 886B |
| Bank of America Corporation | 409B |
| Wells Fargo & Company | 310B |
| Citigroup Inc. | 221B |
JPMorgan Chase & Co. ranks 1st among its four main competitors. It holds a market cap nearly equal to the top leader benchmark at 93%, significantly above both the average market cap of the top 10 (456B) and the median sector figure (359B). The company leads the sector with a substantial 102% gap over its closest rival, Bank of America.
Comparisons with competitors
Check out how we compare the company to its competitors:
Does JPM have a competitive advantage?
JPMorgan Chase & Co. does not present a competitive advantage based on its ROIC falling significantly below WACC and a steep decline in profitability from 2021 to 2025. The company is currently shedding value, indicating challenges in efficiently deploying invested capital and sustaining excess returns over its cost of capital.
Looking ahead, JPMorgan Chase’s diversified segments across consumer banking, corporate investment, commercial banking, and asset management offer potential growth avenues. Expanding services in global markets like Asia Pacific and EMEA, alongside innovations in digital banking and wealth management, may provide new opportunities despite current profitability pressures.
SWOT Analysis
This SWOT analysis highlights JPMorgan Chase & Co.’s key internal and external factors shaping its strategic outlook.
Strengths
- Leading global financial services franchise
- Diverse revenue streams across segments
- Strong brand and large market cap
Weaknesses
- Declining ROIC below WACC signals value destruction
- High interest expense ratio weakens profitability
- Elevated debt-to-equity ratio raises financial risk
Opportunities
- Expansion in high-growth Asia-Pacific and EMEA markets
- Digital banking innovation to capture new clients
- Asset & Wealth Management growth amid aging populations
Threats
- Regulatory pressures in global banking markets
- Rising interest rates impacting loan demand
- Intense competition from fintech disruptors
JPMorgan’s broad franchise and brand power position it well for growth. However, value destruction and financial leverage require cautious capital allocation. The company must innovate and expand internationally to offset margin pressures and regulatory risks.
Stock Price Action Analysis
The weekly stock chart reveals JPMorgan Chase & Co.’s price movements and volatility patterns over the last 12 months:
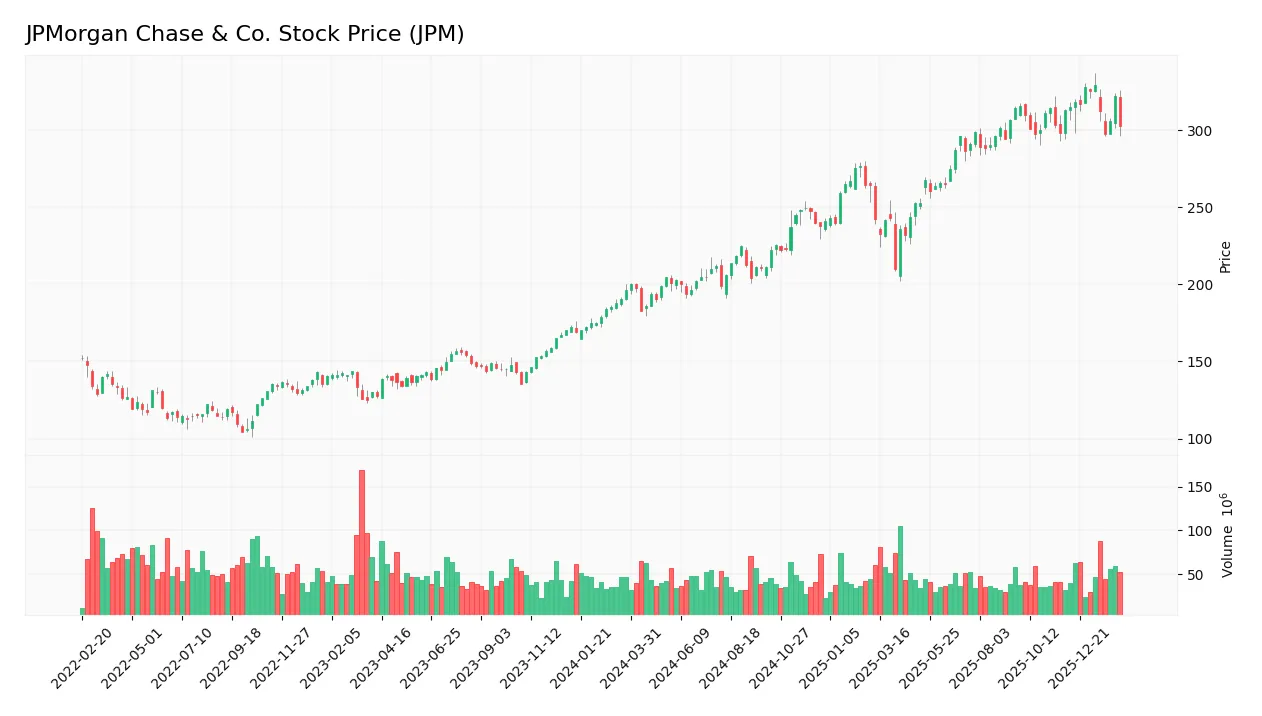
Trend Analysis
Over the past 12 months, JPM’s stock price rose 53.88%, indicating a strong bullish trend despite decelerating momentum. The price fluctuated between a low of 182.79 and a high of 329.19, with a high volatility level (42.84% std deviation). However, in the recent 2.5-month period ending February 2026, the price declined 3.36%, marking a short-term bearish trend.
Volume Analysis
Trading volumes over the last three months increased with a slight buyer dominance (53.54%). Buyers accounted for 321M shares versus 278M sellers, signaling moderate buying interest. This volume trend suggests cautious optimism but reduced conviction compared to the broader yearly buyer dominance of 65.44%.
Target Prices
Analysts set a clear consensus target price for JPMorgan Chase & Co.
| Target Low | Target High | Consensus |
|---|---|---|
| 280 | 391 | 335 |
The target prices indicate optimistic analyst expectations, suggesting upside potential from current levels. The consensus at 335 reflects strong confidence in JPM’s earnings growth and market position.

Don’t Let Luck Decide Your Entry Point
Optimize your entry points with our advanced ProRealTime indicators. You’ll get efficient buy signals with precise price targets for maximum performance. Start outperforming now!
Analyst & Consumer Opinions
This section examines analyst ratings and consumer feedback to provide a comprehensive view of JPMorgan Chase & Co.’s market perception.
Stock Grades
Here are the most recent verified stock grades from leading financial institutions for JPMorgan Chase & Co.:
| Grading Company | Action | New Grade | Date |
|---|---|---|---|
| Truist Securities | Maintain | Hold | 2026-01-06 |
| Barclays | Maintain | Overweight | 2026-01-05 |
| Truist Securities | Maintain | Hold | 2025-12-18 |
| Keefe, Bruyette & Woods | Maintain | Outperform | 2025-12-17 |
| Wells Fargo | Maintain | Overweight | 2025-11-03 |
| Morgan Stanley | Maintain | Equal Weight | 2025-10-15 |
| Barclays | Maintain | Overweight | 2025-10-15 |
| UBS | Maintain | Buy | 2025-10-07 |
| Evercore ISI Group | Maintain | Outperform | 2025-09-30 |
| Morgan Stanley | Maintain | Equal Weight | 2025-09-29 |
The grading trend shows a stable consensus with most firms maintaining positive to neutral stances, favoring overweight or outperform ratings. This consistency suggests broad confidence tempered by caution across major analysts.
Consumer Opinions
Consumers widely recognize JPMorgan Chase & Co. for its robust financial services and extensive branch network. Yet, some express frustration with digital platform glitches and customer service wait times.
| Positive Reviews | Negative Reviews |
|---|---|
| Strong financial stability and trusted brand | Mobile app occasionally crashes during peak use |
| Helpful in-person banking staff | Long wait times for customer support |
| Wide range of financial products and services | Fees perceived as higher than competitors |
Overall, consumers praise JPMorgan for its reliability and product diversity. However, digital experience and customer service remain areas needing improvement.
Risk Analysis
Below is a summary table highlighting JPMorgan Chase & Co.’s key risks, categorized by likelihood and potential impact:
| Category | Description | Probability | Impact |
|---|---|---|---|
| Financial Health | Altman Z-Score of 0.61 signals high bankruptcy risk, placing JPM in the distress zone. | High | Severe |
| Profitability | ROIC (1.29%) is well below WACC (11.21%), indicating poor capital efficiency. | Medium | High |
| Leverage | Debt-to-Equity ratio at 1.38 is elevated, raising concerns over financial leverage. | Medium | Medium |
| Liquidity | Current ratio is 14.85 but marked unfavorable, suggesting potential short-term asset management issues. | Low | Medium |
| Market Valuation | Price-to-Book ratio is very unfavorable, indicating possible overvaluation risk. | Medium | Medium |
| Interest Coverage | Interest coverage ratio is 0.74, below 1, signaling difficulty in meeting interest obligations. | Medium | High |
The most pressing risk is JPMorgan’s distress-zone Altman Z-Score, a rare red flag for a blue-chip bank. Coupled with low ROIC versus WACC, these metrics expose capital allocation inefficiencies. Interest coverage below 1 further elevates default risk under adverse conditions. Investors must weigh these issues against JPM’s strong net margin (20.35%) and ROE (15.74%).
Should You Buy JPMorgan Chase & Co.?
JPMorgan Chase & Co. appears to be in a very unfavorable moat position with declining profitability and value destruction. While the debt profile is unfavorable, the firm shows moderate to strong operational efficiency, suggesting a B rating and a mixed risk-return profile for investors.
Strength & Efficiency Pillars
JPMorgan Chase & Co. posts a solid net margin of 20.35% and a return on equity (ROE) of 15.74%, reflecting operational strength. However, the return on invested capital (ROIC) stands at a weak 1.29% against a weighted average cost of capital (WACC) of 11.21%, signaling value destruction rather than creation. While margins remain favorable, declining ROIC trends indicate diminishing efficiency in capital allocation over the recent period.
Weaknesses and Drawbacks
The company is in financial distress with an Altman Z-Score of 0.61, placing it in the “Distress Zone” and indicating a high bankruptcy risk. Its debt-to-equity ratio of 1.38 and a poor interest coverage ratio of 0.74 further strain its solvency. Valuation metrics are neutral but cautionary: a price-to-earnings (P/E) ratio of 15.75 and price-to-book (P/B) of 2.48 suggest neither deep value nor premium pricing, while an unfavorable current ratio of 14.85 raises liquidity concerns despite a favorable quick ratio.
Our Final Verdict about JPMorgan Chase & Co.
Despite operational profitability, JPMorgan Chase’s severe solvency risk due to its low Altman Z-Score makes the stock profile highly speculative. The company’s weakening capital returns and financial distress overshadow its favorable margins. Investors with a low risk tolerance might find this profile too risky for conservative capital, regardless of long-term market strength or recent buyer dominance.
Disclaimer: This content is for informational purposes only and does not constitute financial, investment, or other professional advice. Investing in financial markets involves a significant risk of loss, and past performance is not indicative of future results.
Additional Resources
- J.P. Morgan Research Says: ‘Broken Logic’ Is Driving This Software Stock Sell-Off – The Motley Fool (Feb 17, 2026)
- JPMorgan Chase CIB appoints Guy Halamish as COO – The Digital Banker (Feb 16, 2026)
- Banking warning as JPMorgan Chase prepares to close 5,300 branches for 24 hours – the-sun.com (Feb 15, 2026)
- JPMorgan Unit Must Defend Lawsuit Over ‘Cash Sweep’ Program – Bloomberg Law News (Feb 16, 2026)
- JPMorgan Faces Talent War and Automation Pressures Amid Tight Immigration Rules – TipRanks (Feb 15, 2026)
For more information about JPMorgan Chase & Co., please visit the official website: jpmorganchase.com