Home > Analyses > Industrials > Johnson Controls International plc
Johnson Controls International plc transforms the way buildings operate, enhancing comfort, safety, and energy efficiency worldwide. As a pioneering force in building solutions, it leads the industry with advanced HVAC systems, smart building technologies, and integrated security products. Renowned for innovation and quality, Johnson Controls shapes commercial and industrial environments while driving sustainability. As we analyze its current fundamentals, the key question remains: does Johnson Controls still offer compelling growth potential for investors in today’s evolving market?

Table of contents
Business Model & Company Overview
Johnson Controls International plc, founded in 1885 and headquartered in Cork, Ireland, stands as a dominant player in the construction industry. Its core mission revolves around creating an integrated ecosystem of building products and systems, including HVAC, fire safety, security, and energy efficiency solutions. Serving commercial, industrial, retail, and governmental sectors worldwide, the company leverages its broad expertise to retrofit and innovate infrastructure across continents.
The company’s revenue engine balances hardware manufacturing with software services and ongoing maintenance contracts, delivering value through a mix of product sales and recurring technical services. Its strategic footprint spans North America, Europe, and Asia Pacific, with tailored offerings in building management, controls software, and smart building data solutions. This diversified model underpins Johnson Controls’ competitive advantage and positions it as a key architect of the built environment’s future.
Financial Performance & Fundamental Metrics
This section reviews Johnson Controls International plc’s income statement, key financial ratios, and dividend payout policy to provide a clear fundamental analysis.
Income Statement
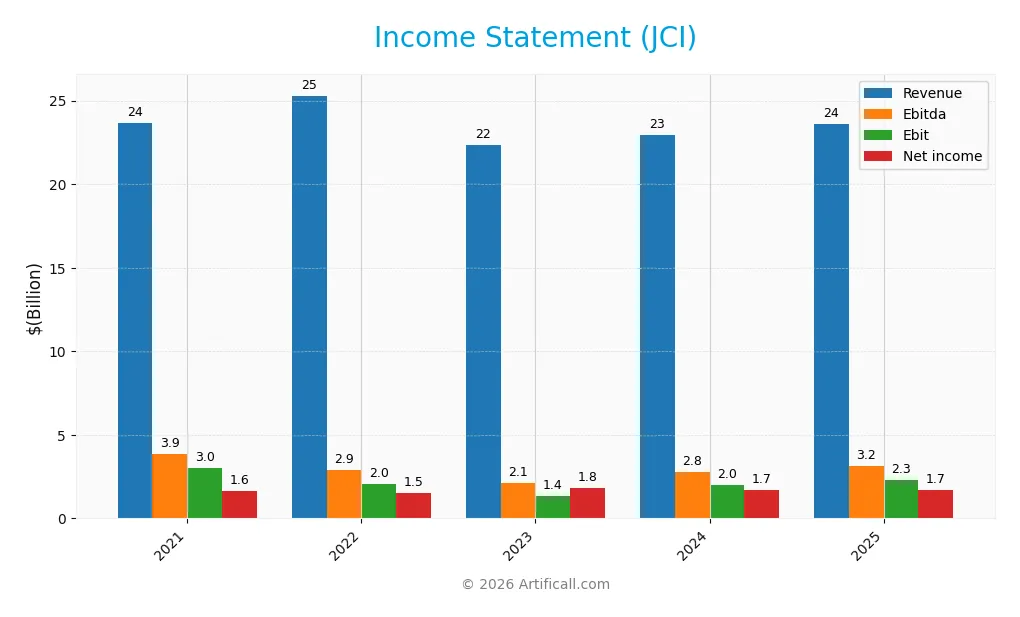
The table below summarizes Johnson Controls International plc’s key income statement figures for fiscal years 2021 through 2025, expressed in USD.
| 2021 | 2022 | 2023 | 2024 | 2025 | |
|---|---|---|---|---|---|
| Revenue | 23.7B | 25.3B | 22.3B | 22.9B | 23.6B |
| Cost of Revenue | 15.6B | 17.0B | 14.5B | 14.9B | 15.0B |
| Operating Expenses | 5.3B | 5.9B | 5.4B | 5.7B | 5.8B |
| Gross Profit | 8.1B | 8.3B | 7.8B | 8.1B | 8.6B |
| EBITDA | 3.9B | 2.9B | 2.1B | 2.8B | 3.2B |
| EBIT | 3.0B | 2.0B | 1.4B | 2.0B | 2.3B |
| Interest Expense | 418M | 337M | 245M | 462M | 319M |
| Net Income | 1.6B | 1.5B | 1.8B | 1.7B | 1.7B |
| EPS | 2.31 | 2.22 | 2.70 | 2.53 | 2.64 |
| Filing Date | 2021-11-15 | 2022-11-15 | 2023-12-14 | 2024-11-19 | 2025-11-14 |
Income Statement Evolution
From 2021 to 2025, Johnson Controls International plc’s revenue slightly declined by 0.3%, with a modest 2.81% increase from 2024 to 2025, signaling a slowdown in top-line growth. Net income, however, grew positively by 5.13% over the full period, despite a small 1.82% margin contraction last year. Gross margins improved favorably to 36.41%, while EBIT margins remained stable at 9.7%.
Is the Income Statement Favorable?
The 2025 income statement reveals solid fundamentals with a net margin of 7.29% and a favorable gross profit increase of 6.32% year-over-year. EBIT rose strongly by 15.32%, supported by controlled operating expenses matching revenue growth. Interest expense remains low at 1.35% of revenue, contributing to a generally favorable financial profile, despite slight recent margin pressures. Overall, 71.43% of income statement indicators are positive.
Financial Ratios
The table below presents key financial ratios for Johnson Controls International plc (JCI) over the fiscal years 2021 to 2025, providing a snapshot of profitability, valuation, liquidity, leverage, and efficiency:
| Ratios | 2021 | 2022 | 2023 | 2024 | 2025 |
|---|---|---|---|---|---|
| Net Margin | 6.92% | 6.06% | 8.28% | 7.43% | 7.29% |
| ROE | 9.32% | 9.42% | 11.18% | 10.59% | 13.31% |
| ROIC | 5.60% | 7.32% | 7.58% | 6.96% | 8.75% |
| P/E | 28.24 | 21.81 | 19.54 | 30.67 | 41.64 |
| P/B | 2.63 | 2.05 | 2.18 | 3.25 | 5.54 |
| Current Ratio | 1.10 | 1.04 | 0.97 | 0.94 | 0.93 |
| Quick Ratio | 0.87 | 0.80 | 0.80 | 0.79 | 0.76 |
| D/E | 0.44 | 0.55 | 0.53 | 0.59 | 0.76 |
| Debt-to-Assets | 18.5% | 21.3% | 20.9% | 22.2% | 26.0% |
| Interest Coverage | 6.62 | 7.05 | 9.95 | 5.24 | 8.87 |
| Asset Turnover | 0.57 | 0.60 | 0.53 | 0.54 | 0.62 |
| Fixed Asset Turnover | 7.33 | 8.08 | 9.41 | 9.55 | 10.76 |
| Dividend Yield | 1.65% | 2.74% | 2.71% | 1.91% | 1.36% |
Evolution of Financial Ratios
Johnson Controls International plc’s Return on Equity (ROE) showed an overall increase from 9.3% in 2021 to 13.3% in 2025, indicating improved profitability. The Current Ratio declined from 1.10 in 2021 to 0.93 in 2025, reflecting decreasing short-term liquidity. The Debt-to-Equity Ratio rose from 0.44 in 2021 to 0.76 in 2025, signaling higher leverage over the period.
Are the Financial Ratios Favorable?
In 2025, profitability ratios like net margin (7.29%) and ROE (13.31%) are neutral, while leverage ratios show a mixed picture: debt-to-assets ratio is favorable at 26.04%, but debt-to-equity is neutral at 0.76. Liquidity ratios, such as Current Ratio (0.93) and Quick Ratio (0.76), are unfavorable. Efficiency metrics show a favorable fixed asset turnover (10.76) but neutral asset turnover (0.62). Market valuation ratios, including P/E (41.64) and P/B (5.54), are unfavorable, resulting in an overall slightly unfavorable assessment.
Shareholder Return Policy
Johnson Controls International plc maintains a consistent dividend payout ratio around 53-59%, with a dividend per share rising from $1.12 in 2021 to $1.50 in 2025 and a current yield near 1.36%. The company supports its dividends with strong free cash flow coverage and manages moderate share buybacks.
This balanced approach, combining steady dividends and buybacks funded by healthy cash flow, suggests a shareholder return policy designed to sustain long-term value without risking excessive distribution or financial strain.
Score analysis
The following radar chart presents an overview of Johnson Controls International plc’s key financial scores for investor consideration:
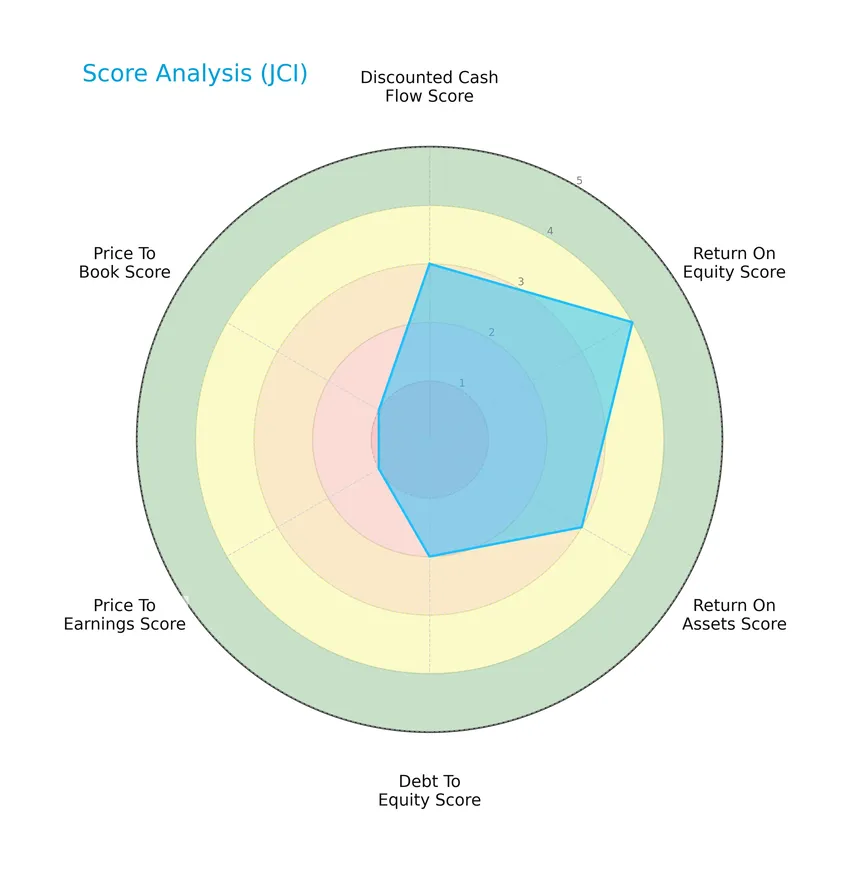
Johnson Controls International shows a moderate discounted cash flow and return on assets score, alongside a favorable return on equity. Debt to equity is moderate, while price to earnings and price to book ratios are very unfavorable, indicating valuation concerns.
Analysis of the company’s bankruptcy risk
The Altman Z-Score places the company in the grey zone, suggesting a moderate risk of bankruptcy that warrants cautious monitoring:

Is the company in good financial health?
The Piotroski Score diagram below illustrates the company’s financial strength based on nine fundamental criteria:

With a Piotroski Score of 6, Johnson Controls International is assessed as having average financial health, reflecting moderate profitability, leverage, and operational efficiency.
Competitive Landscape & Sector Positioning
This sector analysis will examine Johnson Controls International plc’s strategic positioning, revenue segments, key products, main competitors, and competitive advantages. I will assess whether the company holds a competitive advantage relative to its industry peers.
Strategic Positioning
Johnson Controls International plc maintains a diversified product portfolio across four segments—Building Solutions North America, EMEA/LA, Asia Pacific, and Global Products—while its geographic exposure spans the United States, Europe, Asia Pacific, and other international markets, with the U.S. generating the largest revenue share.
Revenue by Segment
The pie chart illustrates Johnson Controls International plc’s revenue distribution by product segments for the fiscal year 2024.
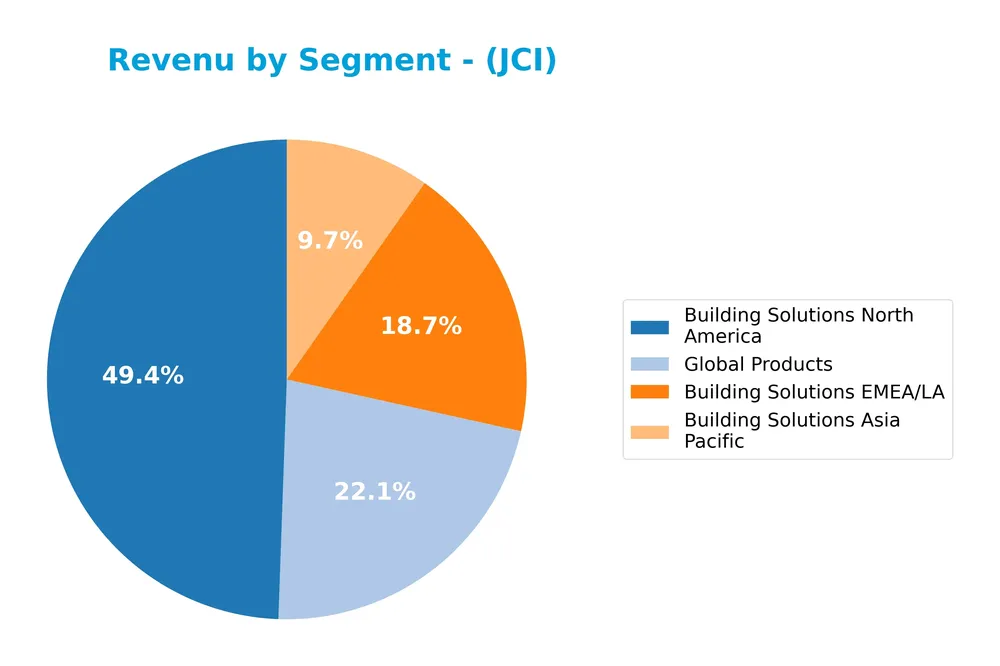
In 2024, Building Solutions North America remains the dominant segment with $11.3B in revenue, showing steady growth from previous years. Building Solutions EMEA/LA and Global Products contribute $4.3B and $5.1B respectively, with Global Products experiencing a significant decline from $9.6B in 2023. Building Solutions Asia Pacific shows a notable decrease to $2.2B. The overall trend indicates a concentration in North America, while Global Products and Asia Pacific segments face a slowdown.
Key Products & Brands
The following table summarizes Johnson Controls International plc’s key products and brands by segment and their primary descriptions:
| Product | Description |
|---|---|
| Building Solutions North America | Designs, sells, installs, and services HVAC, controls, building management, refrigeration, and fire protection systems across North America. |
| Building Solutions EMEA/LA | Provides engineering, manufacturing, and retrofitting of building products and systems in Europe, Middle East, Africa, and Latin America. |
| Building Solutions Asia Pacific | Engages in building solutions including HVAC, security, and fire systems in the Asia Pacific region. |
| Global Products | Offers integrated electronic security, fire detection and suppression systems, fire protection, and controls software globally. |
Johnson Controls focuses on comprehensive building solutions and integrated products worldwide, serving commercial, industrial, retail, institutional, and governmental customers through its regional and global segments.
Main Competitors
There are 6 main competitors in the Industrials construction sector; below is a table of the top 6 leaders by market capitalization:
| Competitor | Market Cap. |
|---|---|
| Trane Technologies plc | 88.3B |
| Johnson Controls International plc | 80.0B |
| Carrier Global Corporation | 45.1B |
| Lennox International Inc. | 17.5B |
| Masco Corporation | 13.4B |
| Builders FirstSource, Inc. | 11.6B |
Johnson Controls International plc ranks 2nd among its 6 competitors, with a market cap at 78.8% of the leader’s size. It stands above both the average market cap of the top 10 (42.6B) and the median sector market cap (31.3B). The company has a notable 26.94% gap to the next competitor above, highlighting a strong position near the top of its industry.
Comparisons with competitors
Check out how we compare the company to its competitors:
Does JCI have a competitive advantage?
Johnson Controls International plc currently does not present a strong competitive advantage, as its return on invested capital (ROIC) is below its weighted average cost of capital (WACC), indicating value destruction despite a growing ROIC trend. Its income statement shows mostly favorable metrics, but revenue growth remains unfavorable, reflecting challenges in sustaining consistent profitability above its cost of capital.
Looking ahead, JCI’s diverse operations across building solutions and integrated systems in multiple regions position it to explore opportunities in energy efficiency and smart building technologies. Continued innovation in controls software and expansion into new markets may offer potential avenues for improving its competitive standing and financial performance.
SWOT Analysis
This analysis highlights Johnson Controls International plc’s key internal and external factors affecting its market position and growth potential.
Strengths
- diversified global presence
- strong building systems expertise
- favorable gross and net margins
Weaknesses
- unfavorable revenue growth
- high P/E and P/B ratios
- low liquidity ratios
Opportunities
- growing demand for smart building solutions
- expanding energy efficiency services
- increasing ROIC trend
Threats
- competitive industrial sector
- macroeconomic uncertainties
- potential technology disruption
Johnson Controls shows solid profitability and global reach but faces challenges in revenue growth and valuation metrics. Strategic focus on innovation and efficiency could leverage opportunities while managing competitive and economic risks.
Stock Price Action Analysis
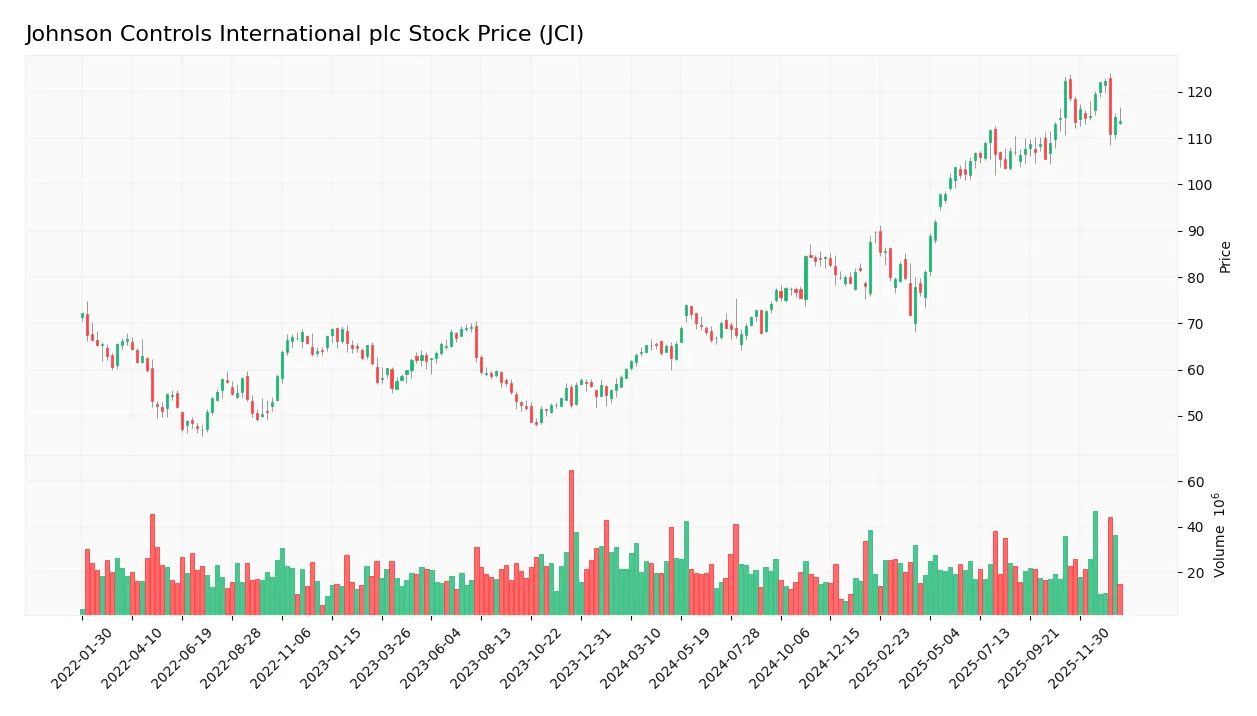
The following weekly chart illustrates Johnson Controls International plc’s stock price movements over the past 12 months, highlighting key fluctuations and trend dynamics:
Trend Analysis
Over the past 12 months, Johnson Controls International’s stock price increased by 88.94%, indicating a bullish trend with significant gains. The highest price reached 122.31 and the lowest was 60.12. Despite strong overall growth, recent months show a deceleration in upward momentum. Volatility is notable, with a standard deviation of 18.39.
Volume Analysis
In the last three months, trading volume has been decreasing, with buyers slightly dominant at 58.87%. Buyer volume totaled 184M shares versus 129M seller shares, suggesting cautious but positive investor sentiment and a moderate market participation level.
Target Prices
The consensus target prices for Johnson Controls International plc reflect moderate optimism among analysts.
| Target High | Target Low | Consensus |
|---|---|---|
| 148 | 124 | 133.8 |
Analysts expect the stock to trade between 124 and 148, with an average consensus price of approximately 134, indicating potential upside from current levels.

Don’t Let Luck Decide Your Entry Point
Optimize your entry points with our advanced ProRealTime indicators. You’ll get efficient buy signals with precise price targets for maximum performance. Start outperforming now!
Analyst & Consumer Opinions
This section reviews the latest grades and consumer feedback regarding Johnson Controls International plc (JCI).
Stock Grades
The following table presents the latest verified stock grades for Johnson Controls International plc from reputable financial institutions:
| Grading Company | Action | New Grade | Date |
|---|---|---|---|
| Morgan Stanley | Maintain | Overweight | 2026-01-13 |
| Barclays | Maintain | Equal Weight | 2026-01-07 |
| Argus Research | Maintain | Buy | 2025-11-07 |
| Goldman Sachs | Maintain | Buy | 2025-11-07 |
| Mizuho | Maintain | Neutral | 2025-11-06 |
| Barclays | Maintain | Equal Weight | 2025-11-06 |
| Wells Fargo | Maintain | Overweight | 2025-11-06 |
| RBC Capital | Maintain | Sector Perform | 2025-11-06 |
| JP Morgan | Maintain | Overweight | 2025-10-15 |
| Citigroup | Maintain | Neutral | 2025-10-09 |
Overall, the grades reflect a consensus leaning toward positive sentiment, with multiple firms maintaining buy or overweight ratings while others hold neutral or equal weight positions, indicating a balanced market outlook for this stock.
Consumer Opinions
Consumer sentiment around Johnson Controls International plc (JCI) reflects a mix of appreciation for product quality and concerns about customer service responsiveness.
| Positive Reviews | Negative Reviews |
|---|---|
| “JCI products are reliable and energy-efficient.” | “Customer support takes too long to respond.” |
| “Great innovation in building management systems.” | “Installation process can be complicated.” |
| “Strong focus on sustainability impresses me.” | “Pricing seems higher compared to competitors.” |
Overall, consumers praise JCI for its innovative and sustainable solutions, but some express frustration with customer service delays and installation complexities. These insights suggest opportunities for service improvements alongside solid product performance.
Risk Analysis
Below is a summary table highlighting key risks associated with Johnson Controls International plc (JCI) for your investment consideration:
| Category | Description | Probability | Impact |
|---|---|---|---|
| Valuation Risk | Elevated P/E ratio (41.64) and P/B ratio (5.54) suggest the stock may be overvalued, risking price correction. | High | High |
| Liquidity Risk | Current ratio (0.93) and quick ratio (0.76) below 1 indicate potential short-term liquidity constraints. | Medium | Medium |
| Financial Distress | Altman Z-Score of 2.49 places the company in the grey zone, indicating moderate bankruptcy risk. | Medium | High |
| Market Volatility | Beta of 1.424 indicates stock price is more volatile than the market, increasing investment risk. | High | Medium |
| Operational Risk | Exposure to global construction markets may face disruptions from economic downturns or supply chain issues. | Medium | Medium |
The most critical risks are valuation and financial distress. The stock trades at expensive multiples, which combined with a grey zone Altman Z-Score, suggests caution. Liquidity ratios also point to some short-term financial pressure. Market volatility remains elevated, requiring careful risk management.
Should You Buy Johnson Controls International plc?
Johnson Controls International plc appears to have improving profitability with growing operational efficiency, though its moat seems slightly unfavorable due to value destruction despite rising returns. Its leverage profile is moderate, supporting a B- rating that suggests a cautiously moderate investment profile overall.
Strength & Efficiency Pillars
Johnson Controls International plc exhibits solid profitability with a net margin of 7.29% and a return on equity (ROE) of 13.31%, indicating moderate efficiency in generating shareholder returns. The company’s interest coverage ratio of 7.17 and a debt-to-assets ratio of 26.04% confirm prudent financial health, supported by a grey zone Altman Z-Score of 2.49 and an average Piotroski Score of 6. However, its return on invested capital (ROIC) at 8.75% slightly trails its weighted average cost of capital (WACC) at 9.72%, suggesting the firm is currently not a value creator despite a growing ROIC trend.
Weaknesses and Drawbacks
Valuation metrics pose significant concerns, with a high price-to-earnings (P/E) ratio of 41.64 and a price-to-book (P/B) ratio of 5.54, signaling a premium market valuation that may limit upside potential. Liquidity ratios are unfavorable, as the current ratio of 0.93 and quick ratio of 0.76 highlight potential short-term solvency risks. Despite a bullish long-term trend, the recent price decline of 7.08% and decelerating momentum introduce uncertainty, while decreasing volume and only slight buyer dominance could indicate emerging market pressure.
Our Verdict about Johnson Controls International plc
Johnson Controls International plc’s long-term fundamental profile might appear moderately favorable, reflecting stable profitability and financial health. However, its premium valuation and recent price softness suggest caution. Despite a generally bullish trend, the deceleration and recent seller pressure could mean investors might prefer a wait-and-see approach for a more attractive entry point before committing to long-term exposure.
Disclaimer: This content is for informational purposes only and does not constitute financial, investment, or other professional advice. Investing in financial markets involves a significant risk of loss, and past performance is not indicative of future results.
Additional Resources
- Johnson Controls International plc $JCI Shares Sold by Jennison Associates LLC – MarketBeat (Jan 24, 2026)
- Johnson Controls announces first quarter 2026 Earnings Conference Call Webcast – Johnson Controls (Jan 12, 2026)
- Johnson Controls International plc $JCI Shares Bought by Teacher Retirement System of Texas – MarketBeat (Jan 24, 2026)
- Here’s Why Shares in Johnson Controls Slumped Today (Hint: It’s Nvidia Related) – The Motley Fool (Jan 07, 2026)
- Earnings Preview: What to Expect From Johnson Controls International’s Report – Yahoo Finance (Jan 09, 2026)
For more information about Johnson Controls International plc, please visit the official website: johnsoncontrols.com