Home > Analyses > Consumer Defensive > JBS N.V.
JBS N.V. transforms protein consumption worldwide, shaping how millions access beef, pork, poultry, and innovative plant-based alternatives. As a powerhouse in the packaged foods industry, JBS leads with an extensive portfolio that spans meat processing, leather goods, and biodiesel production, renowned for operational scale and market influence. With a diverse global footprint and a reputation for innovation, the critical question remains: does JBS’s current financial strength and growth trajectory justify its valuation for investors seeking sustainable returns?

Table of contents
Business Model & Company Overview
JBS N.V., founded in 1953 and headquartered in Amstelveen, Netherlands, stands as a global leader in the packaged foods industry. With a vast ecosystem spanning beef, pork, chicken, poultry, and plant-based products, the company integrates meat processing, leather production, and diversified food offerings into a cohesive core mission. Employing 280K people worldwide, JBS crafts a broad portfolio that extends beyond proteins to include hygiene products, biodiesel, and packaging solutions.
JBS’s revenue engine balances robust meat processing operations with value-added products and recurring services like logistics and industrial waste management. Its strategic footprint covers the Americas, Europe, and Asia, supporting global distribution and market reach. This diversified approach, combined with an integrated supply chain, creates a strong economic moat that anchors JBS’s role in shaping the future of the food and protein sector.
Financial Performance & Fundamental Metrics
In this section, I analyze JBS N.V.’s income statement, key financial ratios, and dividend payout policy to assess its fundamental strength and investment potential.
Income Statement
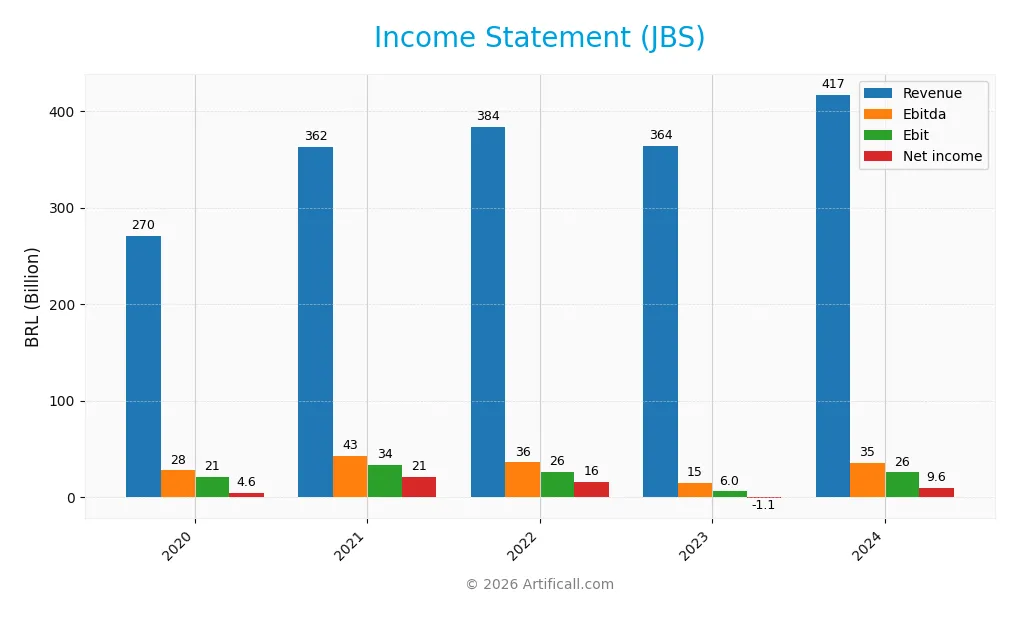
The table below presents JBS N.V.’s key income statement figures for the fiscal years 2020 through 2024, reported in BRL.
| 2020 | 2021 | 2022 | 2023 | 2024 | |
|---|---|---|---|---|---|
| Revenue | 270.2B | 362.5B | 384.0B | 363.8B | 417.0B |
| Cost of Revenue | 225.0B | 294.0B | 322.9B | 324.2B | 354.2B |
| Operating Expenses | 24.8B | 35.1B | 35.7B | 34.3B | 39.0B |
| Gross Profit | 45.2B | 68.5B | 61.0B | 39.6B | 62.8B |
| EBITDA | 27.7B | 43.0B | 36.0B | 14.7B | 35.4B |
| EBIT | 21.3B | 33.7B | 25.9B | 6.0B | 25.7B |
| Interest Expense | 3.8B | 1.0B | 1.3B | 1.7B | 1.6B |
| Net Income | 4.6B | 21.2B | 15.9B | -1.1B | 9.6B |
| EPS | 1.73 | 8.58 | 7.09 | -2.16 | 30.55 |
| Filing Date | 2020-12-31 | 2021-12-31 | 2022-12-31 | 2023-12-31 | 2024-12-31 |
Income Statement Evolution
Between 2020 and 2024, JBS N.V. demonstrated solid revenue growth of 54.31%, with a marked 14.61% increase from 2023 to 2024. Net income more than doubled over the period, rising 109.12%, reflecting improved profitability. Margins showed stability with a gross margin of 15.06% and a net margin of 2.31%, both assessed as neutral, while EBIT margin remained steady at 6.16%.
Is the Income Statement Favorable?
The 2024 income statement reveals a favorable earnings rebound, with net income at 9.6B BRL compared to a loss in 2023. EPS surged 1514.35% year-over-year to 30.55 BRL. Operating efficiency improved, supported by favorable growth in gross profit (+58.32%) and EBIT (+331.09%). Interest expense ratio is low at 0.4%, considered favorable. Overall, 78.57% of evaluated metrics signal a favorable income statement for 2024.
Financial Ratios
The table below summarizes key financial ratios for JBS N.V. over the past five fiscal years, providing insight into profitability, liquidity, leverage, efficiency, and shareholder returns:
| Ratios | 2020 | 2021 | 2022 | 2023 | 2024 |
|---|---|---|---|---|---|
| Net Margin | 1.7% | 5.9% | 4.1% | -0.3% | 2.3% |
| ROE | 11.5% | 48.1% | 34.2% | -2.4% | 21.5% |
| ROIC | 8.8% | 15.4% | 13.5% | 1.6% | 8.6% |
| P/E | 41.6 | 9.0 | 10.4 | -29.0 | 3.2 |
| P/B | 4.8 | 4.3 | 3.6 | 0.7 | 0.7 |
| Current Ratio | 1.48 | 1.40 | 1.44 | 1.64 | 1.47 |
| Quick Ratio | 0.93 | 0.84 | 0.75 | 0.95 | 0.90 |
| D/E | 1.85 | 2.35 | 2.25 | 2.54 | 3.01 |
| Debt-to-Assets | 45.2% | 50.0% | 50.2% | 53.5% | 53.6% |
| Interest Coverage | 5.4 | 34.2 | 18.8 | 3.1 | 14.4 |
| Asset Turnover | 1.65 | 1.75 | 1.85 | 1.76 | 1.65 |
| Fixed Asset Turnover | 4.94 | 5.41 | 5.25 | 4.96 | 4.85 |
| Dividend Yield | 0.8% | 3.9% | 2.7% | 7.2% | 14.4% |
Evolution of Financial Ratios
From 2020 to 2024, JBS N.V.’s Return on Equity (ROE) displayed significant variability, peaking above 48% in 2022 before settling at 21.5% in 2024, indicating a decrease but maintained profitability. The Current Ratio remained relatively stable around 1.4 to 1.6, reflecting consistent liquidity. Conversely, the Debt-to-Equity Ratio increased from about 1.85 in 2020 to 3.01 in 2024, signaling rising leverage and higher financial risk.
Are the Financial Ratios Fovorable?
In 2024, JBS’s financial ratios present a mixed picture. Profitability shows strength with an ROE of 21.5% (favorable), but the net profit margin of 2.31% is considered unfavorable. Liquidity ratios are neutral, with a current ratio of 1.47 and quick ratio of 0.9. Leverage remains a concern, with a debt-to-equity ratio of 3.01 and debt-to-assets at 53.6%, both unfavorable. Market valuation ratios such as price-to-earnings (3.2) and price-to-book (0.69) are favorable, supporting a slightly favorable overall assessment.
Shareholder Return Policy
JBS N.V. maintains a dividend payout ratio of 46% in 2024 with a substantial dividend yield of 14.4%, supported by a dividend per share increase to 2.00 USD. The dividend is well covered by free cash flow, and share buybacks are also part of its capital return strategy, balancing distributions with financial leverage.
While the policy provides attractive income, the elevated dividend yield and leverage ratios suggest caution as aggressive payouts and repurchases may pressure sustainability. Overall, the return approach appears aligned with shareholder value but warrants monitoring for potential risks linked to high leverage and cash flow variability.
Score analysis
The following radar chart presents a comprehensive view of JBS N.V.’s key financial scores:
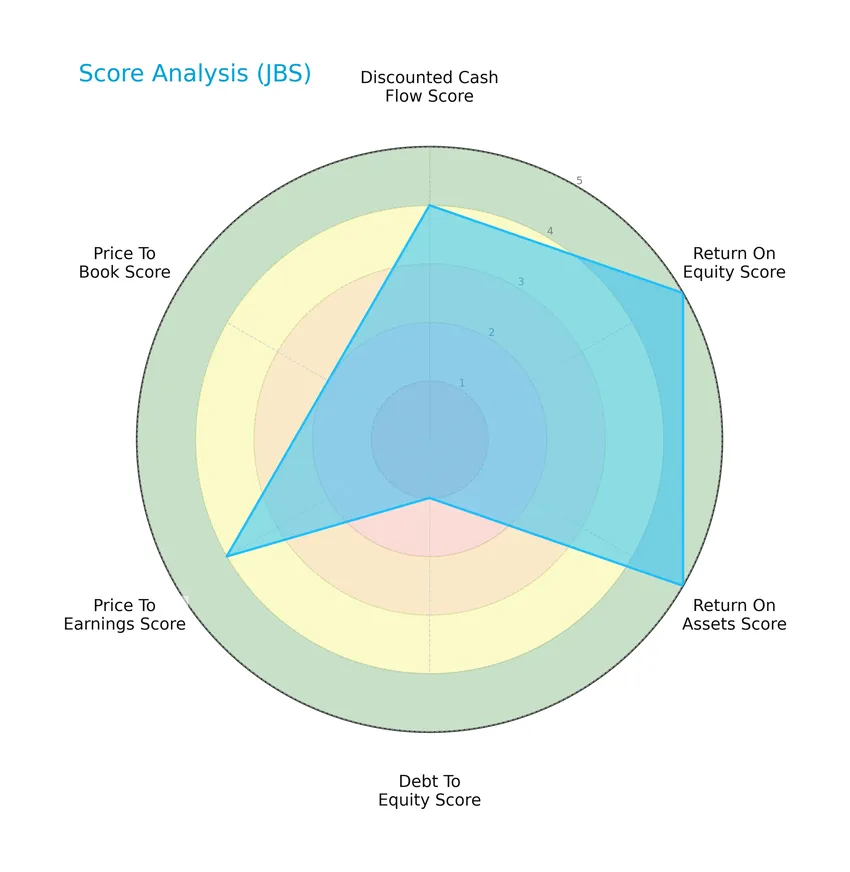
JBS N.V. shows very favorable returns on equity and assets, accompanied by favorable discounted cash flow and price-to-earnings scores. However, its debt-to-equity ratio is rated very unfavorable, with a moderate price-to-book score.
Analysis of the company’s bankruptcy risk
The Altman Z-Score indicates that JBS N.V. is well within the safe zone, suggesting low risk of bankruptcy:

Is the company in good financial health?
The Piotroski Score diagram illustrates the company’s financial strength based on nine criteria:

With a score of 6, JBS N.V. stands at an average level of financial health, reflecting moderate strength but room for improvement in key operational and profitability metrics.
Competitive Landscape & Sector Positioning
This sector analysis will examine JBS N.V.’s strategic positioning, revenue by segment, key products, main competitors, and competitive advantages. I will assess whether JBS holds a competitive advantage within the packaged foods industry.
Strategic Positioning
JBS N.V. maintains a highly diversified product portfolio spanning beef, pork, chicken, fish, plant-based foods, leather, biodiesel, packaging, and logistics services. Its global operations and involvement in multiple stages of protein production and processing highlight a broad geographic and sectoral exposure within Consumer Defensive.
Key Products & Brands
The table below outlines JBS N.V.’s main products and brands with concise descriptions:
| Product | Description |
|---|---|
| Beef, Pork, Chicken, Poultry, Fish, Lamb Products | Fresh and processed meat products offered worldwide. |
| Cooked Frozen Meat | Ready-to-eat frozen meat items. |
| Plant-Based Products | Alternative protein products derived from plants. |
| Leather and Leather Products | Wet blue leather, semi-finished, and finished leather goods. |
| Hygiene and Cleaning Products | Includes soap base, soap bars, and related hygiene items. |
| Collagen and By-Products | Collagen, glycerin, olein, oily acid, and other derivatives from cattle tripe. |
| Metal Packaging and Steel Cans | Production and commercialization of metal and plastic packaging. |
| Biodiesel and Industrial Products | Biodiesel, industrial waste management, plastic resin, and related items. |
| Processed Food Products | Canned beef by-products, pet food, dog biscuits, beef jerky, and concentrates. |
| Agricultural Commodities | Soybeans, tallow, palm oil, caustic soda, and stearin trading and processing. |
| Logistics and Distribution Services | Transportation, cold storage, distribution centers, and harbor operations. |
| Electric Power Production | Cogeneration and commercialization of electric power. |
JBS N.V. operates a diversified portfolio spanning fresh and processed protein products, plant-based alternatives, leather goods, industrial and hygiene products, as well as logistics and energy services, reflecting its integrated approach to the protein and food industry.
Main Competitors
There are 11 competitors in the Consumer Defensive sector, with the table below listing the top 10 leaders by market capitalization:
| Competitor | Market Cap. |
|---|---|
| JBS N.V. | 31.99B |
| The Kraft Heinz Company | 28.87B |
| General Mills, Inc. | 24.90B |
| McCormick & Company, Incorporated | 18.06B |
| Hormel Foods Corporation | 12.87B |
| The J. M. Smucker Company | 10.31B |
| The Magnum Ice Cream Company N.V. | 9.70B |
| Pilgrim’s Pride Corporation | 9.26B |
| Conagra Brands, Inc. | 8.28B |
| Campbell Soup Company | 8.26B |
JBS N.V. ranks first among its 11 competitors, with a market cap 1.08 times larger than the next largest player. The company stands above both the average market cap of the top 10 competitors (16.25B) and the sector median (10.31B). Its market cap is 20.09% higher than that of The Kraft Heinz Company, its closest rival below.
Does JBS have a competitive advantage?
JBS N.V. demonstrates a competitive advantage as it creates value with a ROIC exceeding its WACC by nearly 4%, indicating efficient use of invested capital despite a slight decline in profitability. The company’s diverse product portfolio and global operations in protein and food sectors support stable economic profits.
Looking ahead, JBS’s ongoing expansion into plant-based products and continued development in logistics and industrial waste management present growth opportunities. These initiatives may enhance market presence and operational efficiency, potentially offsetting the observed downward trend in ROIC.
Comparisons with competitors
Check out how we compare the company to its competitors:
SWOT Analysis
This SWOT analysis highlights JBS N.V.’s key internal strengths and weaknesses alongside external opportunities and threats to inform strategic investment decisions.
Strengths
- strong revenue growth (54% over 5 years)
- favorable EBIT and net margin growth
- diversified product portfolio including plant-based foods
Weaknesses
- high debt-to-equity ratio (3.01)
- moderate net margin (2.31%)
- declining ROIC trend
Opportunities
- expanding global demand for protein products
- innovation in plant-based and sustainable food segments
- potential operational efficiencies and cost control
Threats
- commodity price volatility impacting input costs
- regulatory and environmental compliance risks
- intense competition in packaged foods industry
Overall, JBS demonstrates robust growth and value creation but faces leverage and margin pressures. Strategic focus on debt reduction and innovation in sustainable products will be critical to capitalize on market opportunities while mitigating external risks.
Stock Price Action Analysis
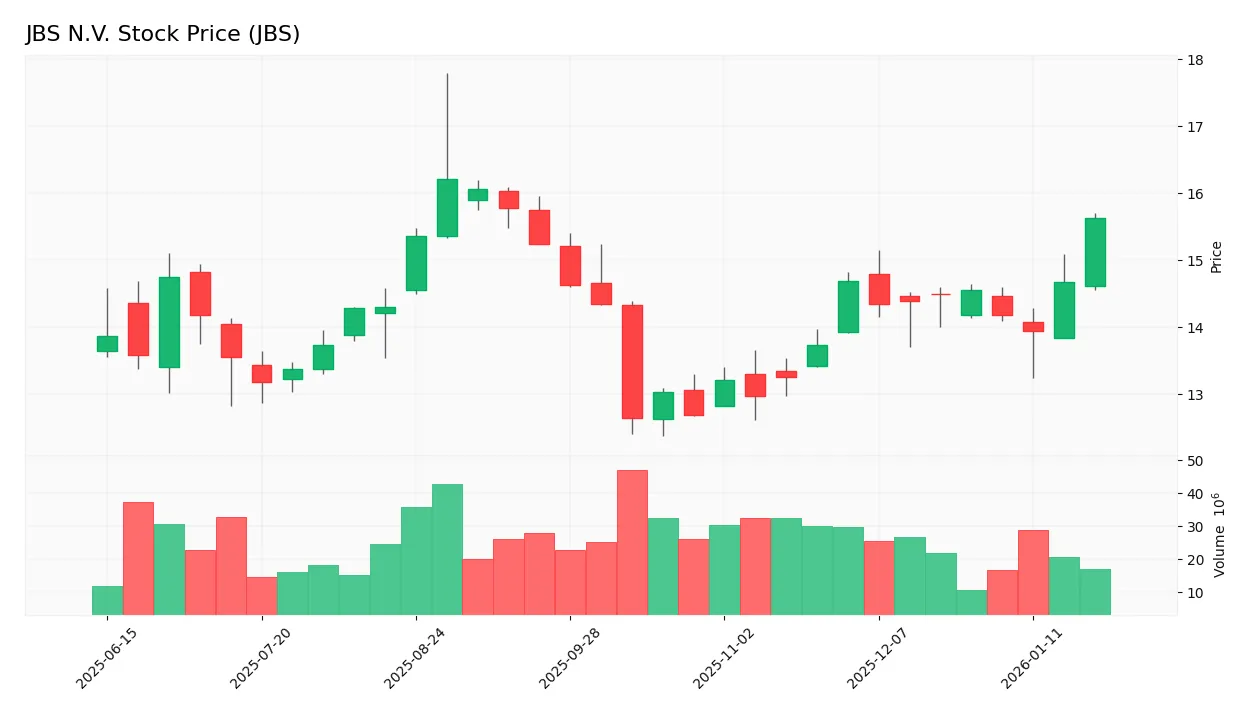
The weekly stock chart of JBS N.V. illustrates price movements and key fluctuations over the recent period, highlighting trend developments and volatility:
Trend Analysis
Over the past 12 months, JBS stock price increased by 12.69%, indicating a bullish trend with price acceleration. The stock traded between a low of 12.64 and a high of 16.21, showing moderate volatility with a standard deviation of 0.93. Recent data from November 2025 to January 2026 show a 20.51% gain and continued positive slope, confirming trend acceleration.
Volume Analysis
In the last three months, trading volume has been decreasing overall, with buyer-driven activity dominating at 64.62% of volume. This buyer dominance suggests increased investor confidence and participation, despite the declining total volume, indicating selective accumulation rather than broad market enthusiasm.
Target Prices
The consensus target price for JBS N.V. indicates moderate upside potential based on current analyst estimates.
| Target High | Target Low | Consensus |
|---|---|---|
| 20 | 17 | 18.5 |
Analysts expect JBS shares to trade between 17 and 20, with a consensus target of 18.5, reflecting cautious optimism about the stock’s near-term prospects.
Analyst & Consumer Opinions
This section reviews recent analyst ratings and consumer feedback to provide insights on JBS N.V.’s market perception.

Don’t Let Luck Decide Your Entry Point
Optimize your entry points with our advanced ProRealTime indicators. You’ll get efficient buy signals with precise price targets for maximum performance. Start outperforming now!
Stock Grades
The latest verified analyst grades for JBS N.V. from reputable financial institutions are presented below:
| Grading Company | Action | New Grade | Date |
|---|---|---|---|
| JP Morgan | Maintain | Overweight | 2025-10-14 |
| JP Morgan | Maintain | Overweight | 2025-09-03 |
| Stephens & Co. | Maintain | Overweight | 2025-08-15 |
| Stephens & Co. | Maintain | Overweight | 2025-06-26 |
These grades consistently reflect an Overweight rating from both JP Morgan and Stephens & Co., indicating a steady positive outlook without recent changes. The consensus among analysts remains a Buy, supported by two Buy ratings and no Hold or Sell opinions.
Consumer Opinions
Consumers of JBS N.V. express a mix of appreciation and concerns, reflecting a dynamic sentiment towards the company’s products and services.
| Positive Reviews | Negative Reviews |
|---|---|
| High-quality meat products with consistent freshness | Occasional delays in customer service response times |
| Competitive pricing relative to market alternatives | Packaging sometimes not environmentally friendly |
| Wide variety of product options catering to diverse tastes | Limited availability of some specialty items in certain regions |
Overall, consumer feedback highlights JBS’s strong product quality and pricing as key strengths, while customer service responsiveness and packaging sustainability are areas needing improvement.
Risk Analysis
Below is a summary table of key risks associated with investing in JBS N.V., highlighting probability and potential impact:
| Category | Description | Probability | Impact |
|---|---|---|---|
| Financial Leverage | High debt-to-equity ratio (3.01) increases financial risk despite favorable interest coverage. | Moderate | High |
| Profitability | Low net margin (2.31%) may limit earnings growth and shareholder returns. | Moderate | Moderate |
| Market Volatility | Beta of 0.48 indicates lower stock volatility, but exposure to commodity price swings remains. | Low | Moderate |
| Regulatory & Compliance | Global operations expose company to varying food safety and environmental regulations. | Moderate | High |
| Operational Risks | Supply chain disruptions or disease outbreaks in livestock can impact production. | Moderate | High |
| Dividend Sustainability | High dividend yield (14.42%) may not be sustainable if earnings weaken. | Moderate | Moderate |
The most significant risks are financial leverage and regulatory challenges, given JBS’s high debt load and global footprint. Despite a strong Altman Z-Score signaling financial safety, investors should monitor debt levels closely and be cautious about margin pressures in volatile commodity markets.
Should You Buy JBS N.V.?
JBS N.V. appears to be delivering robust profitability and operational efficiency, supported by a slightly favorable competitive moat despite a declining ROIC trend. While its leverage profile could be seen as substantial, the overall rating is very favorable, suggesting a balanced investment profile.
Strength & Efficiency Pillars
JBS N.V. exhibits solid financial health with an Altman Z-score of 13.45, placing it well within the safe zone, signaling low bankruptcy risk. Profitability is marked by a favorable return on equity of 21.47%, while the return on invested capital (ROIC) stands at 8.61%, comfortably above the weighted average cost of capital (WACC) at 4.69%, confirming the company as a clear value creator. The Piotroski score of 6 reflects average financial strength, further supported by strong asset turnover (1.65) and interest coverage (15.6), underscoring efficient capital use and debt servicing.
Weaknesses and Drawbacks
Despite favorable valuation metrics such as a low P/E of 3.2 and a P/B of 0.69, JBS’s leverage is a notable concern. The debt-to-equity ratio at 3.01 and debt-to-assets of 53.56% highlight significant financial risk, potentially constraining flexibility and increasing vulnerability to interest rate shifts. Liquidity ratios remain neutral with a current ratio of 1.47 and quick ratio at 0.9, suggesting moderate short-term resilience but room for improvement. These leverage levels introduce caution, especially in volatile market conditions, despite a bullish stock trend.
Our Verdict about JBS N.V.
JBS N.V. presents a fundamentally favorable long-term profile, reinforced by its status as a value creator and solid profitability metrics. Coupled with a bullish overall market trend and recent buyer dominance (64.62%), the company’s outlook may appear attractive for long-term exposure. However, elevated leverage poses risks that might warrant a cautious approach, suggesting that investors could consider timing entries carefully to mitigate downside exposure.
Disclaimer: This content is for informational purposes only and does not constitute financial, investment, or other professional advice. Investing in financial markets involves a significant risk of loss, and past performance is not indicative of future results.
Additional Resources
- What Does Wall Street Think About JBS N.V. (JBS)? – Yahoo Finance (Jan 02, 2026)
- JBS expands capacity in Saudi Arabia (JBS:NYSE) – Seeking Alpha (Jan 22, 2026)
- JBS N.V Earnings Preview: Recent $JBS Insider Trading, Hedge Fund Activity, and More – Quiver Quantitative (Nov 11, 2025)
- White & Case advises JBS on landmark NYSE listing – White & Case LLP (Jun 25, 2025)
- Is JBS (JBS) Exiting Jack Link’s JV a Quiet Shift in Its Global Focus Strategy? – Sahm (Jan 18, 2026)
For more information about JBS N.V., please visit the official website: jbs.com.br