Home > Analyses > Technology > Jacobs Solutions Inc.
Jacobs Solutions Inc. shapes the backbone of modern infrastructure and advanced facilities worldwide, influencing how communities and industries function daily. As a leader in engineering and consulting services, Jacobs delivers innovative solutions across sectors like energy, transportation, healthcare, and defense. Known for its comprehensive project management and design expertise, the company combines quality with global reach. Yet, as market dynamics evolve, the key question remains: does Jacobs’ robust foundation support continued growth and justify its current valuation?

Table of contents
Business Model & Company Overview
Jacobs Solutions Inc., founded in 1947 and headquartered in Dallas, Texas, stands as a leading player in the infrastructure and advanced facilities consulting sector. Its ecosystem integrates consulting, design, engineering, and project management services across diverse industries including energy, defense, healthcare, and transport. This comprehensive approach positions Jacobs as a pivotal partner in delivering complex infrastructure solutions worldwide.
The company’s revenue engine balances consulting and long-term operational services, generating sustained value from project delivery to facility management. Jacobs commands a strategic footprint across the Americas, Europe, Asia, and other key regions, leveraging its global reach to serve a broad client base. Its competitive advantage lies in the seamless integration of multidisciplinary expertise, creating a robust economic moat that shapes the future of infrastructure and consulting services.
Financial Performance & Fundamental Metrics
This section analyzes Jacobs Solutions Inc.’s income statement, key financial ratios, and dividend payout policy to assess its overall financial health and investment potential.
Income Statement
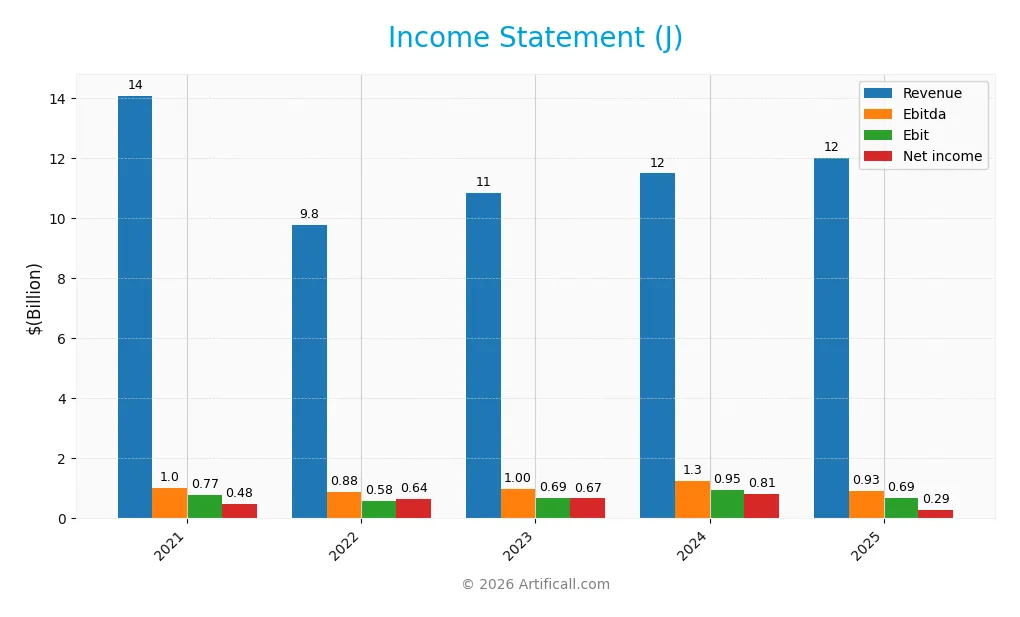
The table below summarizes Jacobs Solutions Inc.’s key income statement figures for the fiscal years 2021 through 2025, reported in USD.
| 2021 | 2022 | 2023 | 2024 | 2025 | |
|---|---|---|---|---|---|
| Revenue | 14.1B | 9.8B | 10.9B | 11.5B | 12.0B |
| Cost of Revenue | 11.0B | 7.2B | 8.1B | 8.7B | 9.0B |
| Operating Expenses | 2.4B | 2.0B | 2.0B | 2.1B | 2.1B |
| Gross Profit | 3.0B | 2.6B | 2.7B | 2.8B | 3.0B |
| EBITDA | 1.0B | 879M | 996M | 1.3B | 927M |
| EBIT | 768M | 578M | 689M | 946M | 689M |
| Interest Expense | 73M | 100M | 168M | 169M | 146M |
| Net Income | 477M | 644M | 666M | 806M | 290M |
| EPS | 3.10 | 5.01 | 5.32 | 6.35 | 2.39 |
| Filing Date | 2021-11-23 | 2022-11-21 | 2023-11-21 | 2024-11-25 | 2025-11-20 |
Income Statement Evolution
From 2021 to 2025, Jacobs Solutions Inc. experienced a revenue decline of 14.6%, with a modest 4.6% growth in the most recent year. Gross profit improved by 5.4% last year, supporting a favorable gross margin of 24.8%. However, EBIT and net income both contracted significantly, with net margin shrinking by nearly 29% over the period, reflecting overall margin pressures.
Is the Income Statement Favorable?
In 2025, the company reported a 2.41% net margin and a 5.73% EBIT margin, both classified as neutral, while interest expense remained favorable at 1.21% of revenue. Despite stable cost control, earnings before tax and net income fell sharply, with net income down 39% over five years. The global evaluation rates the income statement as unfavorable, driven by persistent declines in net income and earnings per share.
Financial Ratios
The following table presents key financial ratios for Jacobs Solutions Inc. over the fiscal years 2021 to 2025, providing insight into profitability, efficiency, liquidity, leverage, and shareholder returns:
| Ratios | 2021 | 2022 | 2023 | 2024 | 2025 |
|---|---|---|---|---|---|
| Net Margin | 3.4% | 6.6% | 6.1% | 7.0% | 2.4% |
| ROE | 8.0% | 10.6% | 10.2% | 17.7% | 8.0% |
| ROIC | 3.6% | 4.0% | 4.8% | 6.6% | 6.5% |
| P/E | 29.9 | 17.9 | 21.5 | 20.1 | 61.2 |
| P/B | 2.4 | 1.9 | 2.2 | 3.6 | 4.9 |
| Current Ratio | 1.34 | 1.45 | 1.37 | 1.20 | 1.30 |
| Quick Ratio | 1.34 | 1.45 | 1.37 | 1.20 | 1.30 |
| D/E | 0.64 | 0.69 | 0.53 | 0.60 | 0.74 |
| Debt-to-Assets | 26.1% | 28.4% | 23.7% | 23.4% | 24.1% |
| Interest Coverage | 9.5 | 5.4 | 4.0 | 4.1 | 5.9 |
| Asset Turnover | 0.96 | 0.67 | 0.74 | 0.98 | 1.07 |
| Fixed Asset Turnover | 14.0 | 11.9 | 17.9 | 18.6 | 28.2 |
| Dividend Yield | 0.78% | 1.00% | 0.90% | 0.88% | 0.86% |
Evolution of Financial Ratios
Jacobs Solutions Inc. saw a decline in Return on Equity (ROE) from 17.7% in 2024 to 7.97% in 2025, indicating reduced profitability. The Current Ratio improved slightly to 1.3 in 2025, reflecting stable short-term liquidity. The Debt-to-Equity Ratio rose moderately to 0.74, maintaining a balanced leverage position. Profitability margins, including net profit, showed a downward trend over the period.
Are the Financial Ratios Favorable?
In 2025, Jacobs Solutions’ profitability ratios such as net margin (2.41%) and ROE (7.97%) were unfavorable, while return on invested capital (6.5%) was neutral. Liquidity ratios showed mixed signals: the quick ratio was favorable at 1.3, but the current ratio was neutral. Leverage ratios were generally favorable or neutral, with a debt-to-assets ratio of 24.08% deemed favorable. Market valuation ratios like price-to-earnings (61.17) and price-to-book (4.88) were unfavorable. Overall, the company’s financial ratios present a neutral stance.
Shareholder Return Policy
Jacobs Solutions Inc. has consistently paid dividends with a payout ratio around 18-53% in recent years and a dividend yield near 0.8-1.0%. The dividend per share has increased steadily from $0.86 in 2021 to $1.27 in 2025. Dividend payments are well covered by free cash flow, signaling prudent distribution.
The company also engages in share buybacks, supporting shareholder returns beyond dividends. The balanced payout and buyback policy, combined with coverage by operating and free cash flows, suggest a sustainable approach aimed at long-term shareholder value creation without excessive financial risk.
Score analysis
The radar chart below presents a comprehensive view of Jacobs Solutions Inc.’s key financial scores:
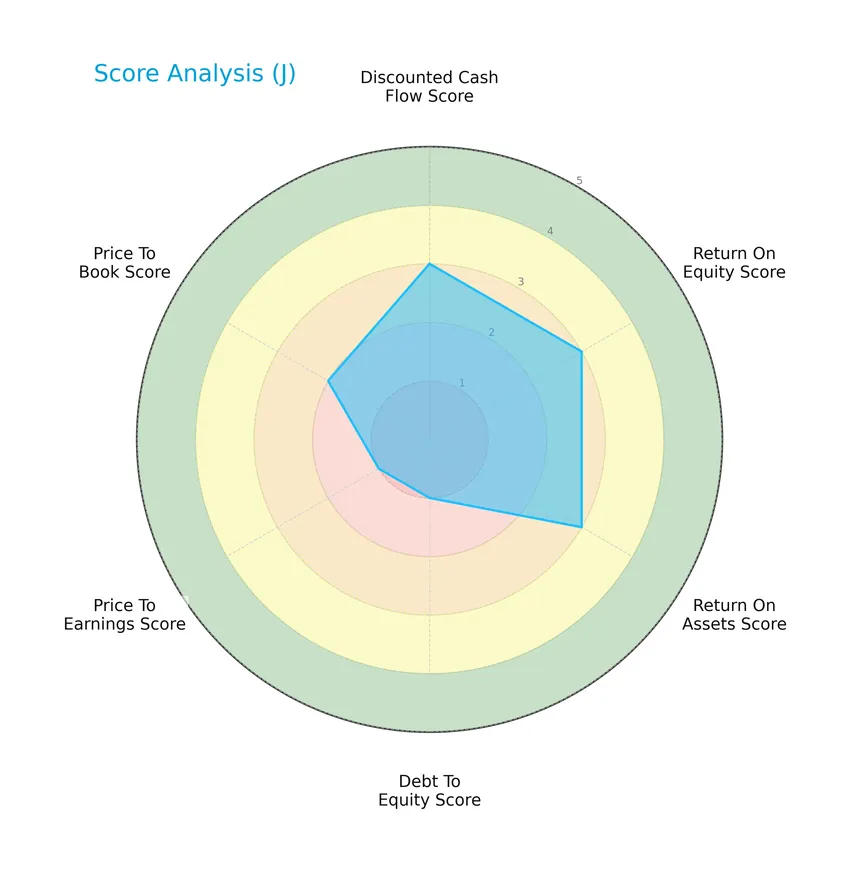
The company shows moderate scores for discounted cash flow, return on equity, and return on assets, while debt to equity and price to earnings scores are very unfavorable, reflecting some leverage and valuation concerns. Price to book stands at a moderate level.
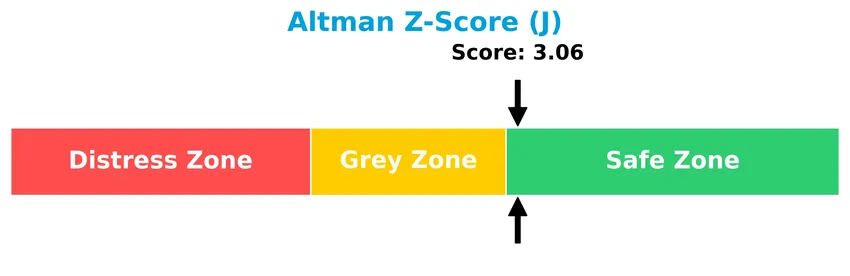
Analysis of the company’s bankruptcy risk
Jacobs Solutions Inc. is positioned in the safe zone according to the Altman Z-Score, indicating a low probability of bankruptcy and solid financial stability:
Is the company in good financial health?
The following Piotroski diagram illustrates the company’s financial health status:
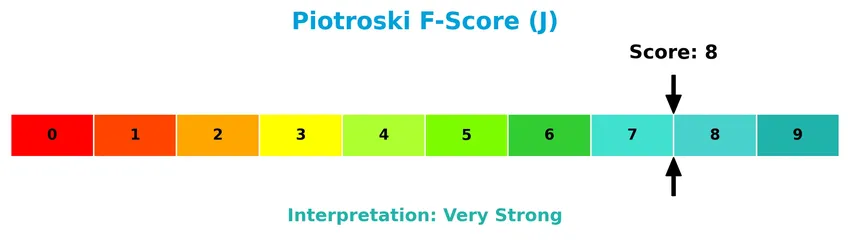
With a Piotroski Score of 8, Jacobs Solutions Inc. demonstrates very strong financial health, suggesting robust profitability, liquidity, and operational efficiency.
Competitive Landscape & Sector Positioning
This sector analysis will examine Jacobs Solutions Inc.’s strategic positioning, revenue by segment, key products, main competitors, competitive advantages, and SWOT factors. I will assess whether Jacobs Solutions holds a competitive advantage over its industry peers.
Strategic Positioning
Jacobs Solutions Inc. maintains a diversified product portfolio centered on infrastructure, advanced facilities, and consulting, with significant revenue from its Infrastructure & Advanced Facilities segment ($10.8B in 2025) and PA Consulting ($1.3B). Geographically, it operates globally, with a dominant presence in the United States ($7.4B), Europe ($2.9B), and growing footprints in Asia, Canada, India, and the Middle East.
Revenue by Segment
The pie chart displays Jacobs Solutions Inc.’s revenue distribution by business segment for the fiscal year 2025, highlighting key contributors to the company’s total revenue.
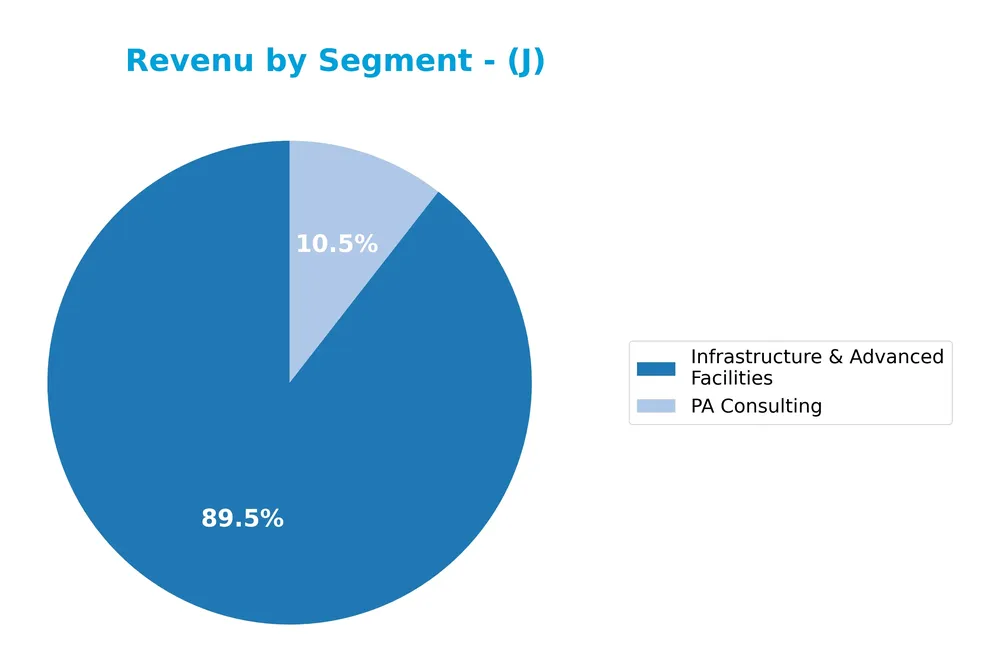
In 2025, the Infrastructure & Advanced Facilities segment dominated Jacobs Solutions’ revenue with 10.8B, significantly outpacing PA Consulting, which generated 1.27B. This contrasts with prior years when segments like People & Places Solutions and Critical Mission Solutions also contributed notably. The 2025 data suggests a consolidation of revenue concentration in infrastructure-related services, indicating a strategic focus but also potential concentration risk if diversification does not improve.
Key Products & Brands
The table below presents Jacobs Solutions Inc.’s main products and brands with their respective descriptions:
| Product | Description |
|---|---|
| Infrastructure & Advanced Facilities | Services including consulting, planning, architecture, design, engineering, and infrastructure delivery. |
| PA Consulting | Specialized consulting services covering multiple sectors such as consumer, manufacturing, defense, energy, and more. |
| People & Places Solutions | Solutions focused on project, program, and construction management, and long-term facility operations. |
| Critical Mission Solutions | Services tailored to high-stakes, mission-critical projects requiring specialized expertise. |
| Divergent Solutions | Innovative and adaptive solutions addressing complex client challenges. |
| Aerospace And Technology | Engineering and consulting services for the aerospace and related technology sectors. |
| Buildings And Infrastructure | Comprehensive services in construction, engineering, and infrastructure development. |
| Energy, Chemicals and Resources | Consulting and engineering services for energy, chemical, and resource industries. |
| Construction | Construction management and related professional services. |
| Field Services | On-site technical and operational support services. |
| Project Services | Comprehensive project management and delivery services. |
| Technical Professional Services | Specialized technical consulting and professional services across sectors. |
| Industrial | Engineering and consulting services for industrial clients. |
| Petroleum And Chemicals | Services focused on petroleum and chemical industry projects. |
Jacobs Solutions Inc. offers a broad portfolio of consulting, engineering, and project management services across infrastructure, technology, and specialized sectors, supporting diverse global industries with tailored solutions.
Main Competitors
There are 2 competitors in total, with the table below showing the top 10 leaders by market capitalization:
| Competitor | Market Cap. |
|---|---|
| Broadridge Financial Solutions, Inc. | 25.8B |
| Jacobs Solutions Inc. | 16.1B |
Jacobs Solutions Inc. ranks 2nd among its competitors, with a market cap at 63.41% of the leader, Broadridge Financial Solutions. The company is positioned below both the average market cap of the top 10 competitors (20.9B) and the median market cap in its sector. It maintains a 57.7% gap below the next competitor above it.
Comparisons with competitors
Check out how we compare the company to its competitors:
Does Jacobs Solutions Inc. have a competitive advantage?
Jacobs Solutions Inc. currently does not present a strong competitive advantage, as it is shedding value with a ROIC below its WACC, though profitability is improving. The company’s global moat status is slightly unfavorable due to value destruction despite an 82% growth trend in ROIC from 2021 to 2025.
Looking ahead, Jacobs operates across diverse geographies including the US, Europe, Asia, and the Middle East, offering infrastructure, consulting, and engineering services. These broad market exposures provide opportunities to expand service offerings and capture growth in infrastructure and advanced facilities sectors globally.
SWOT Analysis
This SWOT analysis aims to highlight the key internal and external factors affecting Jacobs Solutions Inc. to guide informed investment decisions.
Strengths
- diversified global presence
- strong consulting and engineering expertise
- growing ROIC trend
Weaknesses
- declining revenue and net income over 5 years
- unfavorable EBIT and net margin growth
- high P/E and P/B ratios indicating overvaluation
Opportunities
- expanding infrastructure demand worldwide
- increasing digital transformation in construction
- potential margin improvement through cost control
Threats
- intense industry competition
- economic slowdown risks in key markets
- project execution and regulatory challenges
Overall, Jacobs Solutions shows solid operational strengths and growth potential in infrastructure services but faces profitability pressures and valuation concerns. Strategic focus on margin recovery and leveraging global opportunities is crucial to enhance shareholder value.
Stock Price Action Analysis
The following weekly stock chart illustrates Jacobs Solutions Inc.’s price movements over the past 100 weeks, highlighting key fluctuations and patterns:
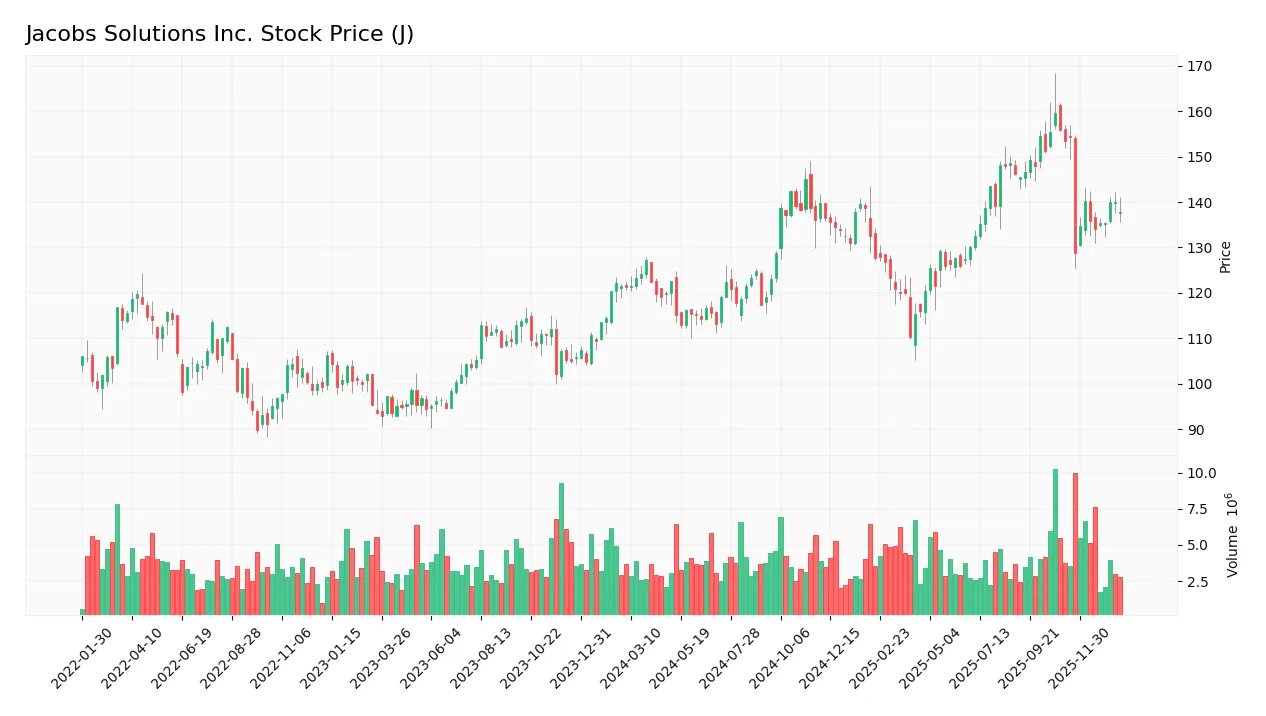
Trend Analysis
Over the past 12 months, Jacobs Solutions Inc. stock rose by 13.7%, indicating a bullish trend. The price showed deceleration despite this upward movement, with volatility measured by an 11.82 standard deviation. The highest price reached 159.59, and the lowest was 110.35, reflecting significant range but slowing momentum.
Volume Analysis
Trading volumes have been increasing overall, with a nearly balanced buyer-seller split (49.52% buyers). However, in the recent three-month period, seller volume slightly dominates at 57.85%, suggesting cautious or bearish investor sentiment and reduced buying participation amid rising market activity.
Target Prices
The consensus target prices for Jacobs Solutions Inc. indicate a positive outlook among analysts.
| Target High | Target Low | Consensus |
|---|---|---|
| 160 | 137 | 151.86 |
Analysts expect Jacobs Solutions Inc. to trade between 137 and 160, with a consensus price near 152, reflecting moderate confidence in the stock’s upside potential.

Don’t Let Luck Decide Your Entry Point
Optimize your entry points with our advanced ProRealTime indicators. You’ll get efficient buy signals with precise price targets for maximum performance. Start outperforming now!
Analyst & Consumer Opinions
This section reviews recent analyst ratings and consumer feedback related to Jacobs Solutions Inc. (J).
Stock Grades
The latest stock grades from recognized financial institutions for Jacobs Solutions Inc. are detailed in the following table:
| Grading Company | Action | New Grade | Date |
|---|---|---|---|
| Wells Fargo | Maintain | Equal Weight | 2026-01-23 |
| Baird | Downgrade | Neutral | 2025-11-21 |
| Truist Securities | Maintain | Hold | 2025-11-21 |
| B of A Securities | Maintain | Neutral | 2025-11-21 |
| Wells Fargo | Maintain | Equal Weight | 2025-11-21 |
| Citigroup | Maintain | Buy | 2025-11-21 |
| RBC Capital | Maintain | Outperform | 2025-11-21 |
| Citigroup | Maintain | Buy | 2025-10-20 |
| Keybanc | Maintain | Overweight | 2025-10-20 |
| Barclays | Maintain | Overweight | 2025-10-20 |
Overall, the grades show a predominance of stable “Hold,” “Neutral,” and “Buy” ratings, with a slight downgrade noted from Baird. The consensus remains generally positive but cautious, reflecting a balanced outlook among analysts.
Consumer Opinions
Consumers have mixed but insightful views on Jacobs Solutions Inc., reflecting both satisfaction and areas needing improvement.
| Positive Reviews | Negative Reviews |
|---|---|
| “Jacobs Solutions delivers reliable engineering services with strong project management.” | “Customer support response times can be slow during peak periods.” |
| “Their innovative solutions have helped improve our operational efficiency significantly.” | “Some projects experienced delays due to unforeseen challenges.” |
| “The company shows strong commitment to sustainability and safety standards.” | “Pricing can be higher compared to competitors in certain service sectors.” |
Overall, customers appreciate Jacobs Solutions for its innovation and reliability but express concerns about service delays and customer support responsiveness, suggesting room for operational enhancements.
Risk Analysis
Below is a summary table outlining key risks for Jacobs Solutions Inc., including likelihood and potential impact:
| Category | Description | Probability | Impact |
|---|---|---|---|
| Valuation Risk | High P/E ratio of 61.17 suggests stock may be overvalued, risking price correction. | Medium | High |
| Profitability Risk | Low net margin at 2.41% and ROE at 7.97% indicate weak profitability and operational efficiency. | High | Medium |
| Debt Risk | Debt-to-equity score is very unfavorable, though debt-to-assets ratio is favorable at 24.08%. | Medium | Medium |
| Market Volatility | Beta of 0.795 indicates lower volatility, but recent price drop of -1.57% signals sensitivity. | Medium | Low |
| Dividend Yield | Low dividend yield at 0.86% may deter income-focused investors amid market uncertainty. | Medium | Low |
The most prominent risks involve valuation and profitability concerns. Despite a safe Altman Z-Score and strong Piotroski Score indicating financial stability, the elevated P/E and modest profit margins suggest caution. Investors should monitor operational improvements and valuation adjustments closely.
Should You Buy Jacobs Solutions Inc.?
Jacobs Solutions Inc. appears to be in a safe zone with a very strong Piotroski score, suggesting improving profitability and operational efficiency. Despite a slightly unfavorable moat indicating value destruction, its leverage profile could be seen as substantial. Overall, the company’s rating is C+, reflecting a moderate investment appeal.
Strength & Efficiency Pillars
Jacobs Solutions Inc. exhibits robust financial health as reflected in its Altman Z-Score of 3.06, placing it securely in the safe zone and suggesting low bankruptcy risk. The strong Piotroski Score of 8 further confirms solid operational and financial performance. While the return on invested capital (ROIC) stands at 6.5%, slightly below the weighted average cost of capital (WACC) at 7.16%, indicating the company is currently shedding value, its ROIC trend is growing by 81.98%, signaling improving profitability. Favorable margins such as a gross margin of 24.81% and prudent interest expense at 1.21% reinforce operational efficiency.
Weaknesses and Drawbacks
Jacobs Solutions faces notable valuation and profitability headwinds. Its price-to-earnings (P/E) ratio is elevated at 61.17, indicating a premium valuation that may pressure returns if earnings do not improve. The price-to-book (P/B) ratio of 4.88 also suggests the stock trades at a significant premium relative to book value. Profitability metrics are weak with a net margin of only 2.41% and return on equity (ROE) at 7.97%, both unfavorable. Additionally, recent declines in net margin growth (-28.72%) and earnings per share (-22.73%) over the overall period raise concerns. Recent seller dominance (42.15% buyers) and a 10.09% price decline since November 2025 denote short-term market pressure.
Our Verdict about Jacobs Solutions Inc.
Jacobs Solutions presents an overall favorable long-term fundamental profile supported by solid financial health and improving profitability trends. However, the current premium valuation combined with recent seller dominance suggests caution. Despite long-term strength, recent market pressure may suggest a wait-and-see approach for a better entry point. Investors might find the stock attractive for long-term exposure if operational improvements translate into sustained value creation.
Disclaimer: This content is for informational purposes only and does not constitute financial, investment, or other professional advice. Investing in financial markets involves a significant risk of loss, and past performance is not indicative of future results.
Additional Resources
- Teacher Retirement System of Texas Has $29.44 Million Stake in Jacobs Solutions Inc. $J – MarketBeat (Jan 24, 2026)
- Willdan vs. Jacobs: Which Engineering Stock Has More Upside? – TradingView — Track All Markets (Jan 22, 2026)
- Jacobs Solutions (J) Gets Analyst Price Target Boost from Wells Fargo | J Stock News – GuruFocus (Jan 23, 2026)
- A Glimpse Into The Expert Outlook On Jacobs Solutions Through 9 Analysts – Benzinga (Jan 23, 2026)
- Jacobs Solutions Inc. Stock Underperforms Tuesday When Compared To Competitors – 富途资讯 (Jan 20, 2026)
For more information about Jacobs Solutions Inc., please visit the official website: jacobs.com