Home > Analyses > Technology > Jack Henry & Associates, Inc.
Jack Henry & Associates, Inc. quietly powers the backbone of financial institutions across the United States, enabling seamless banking and payment experiences for millions daily. As a respected leader in information technology services, it delivers robust core processing systems and innovative digital solutions tailored for banks and credit unions. Renowned for its reliability and continuous innovation, Jack Henry shapes the future of financial technology. The key question for investors is whether this strong foundation can sustain growth and justify its current market valuation.

Table of contents
Business Model & Company Overview
Jack Henry & Associates, Inc., founded in 1976 and headquartered in Monett, Missouri, stands as a dominant player in financial technology services in the US. Its ecosystem integrates core banking, credit union processing, and specialized payment solutions under brands like Jack Henry Banking, Symitar, and ProfitStars, serving institutions from community banks to multi-billion-dollar asset organizations. This cohesive suite addresses the evolving needs of financial entities with robust, user-friendly platforms.
The company’s revenue engine balances software-driven recurring services with hardware sales and implementation support, creating diverse value streams. Jack Henry operates primarily in the Americas, leveraging its strong foothold in US markets with extended influence in complementary services. Its competitive advantage lies in delivering integrated, scalable financial solutions that shape the industry’s digital transformation and secure its economic moat.
Financial Performance & Fundamental Metrics
In this section, I analyze Jack Henry & Associates, Inc.’s income statement, key financial ratios, and dividend payout policy to assess its fundamental strength.
Income Statement
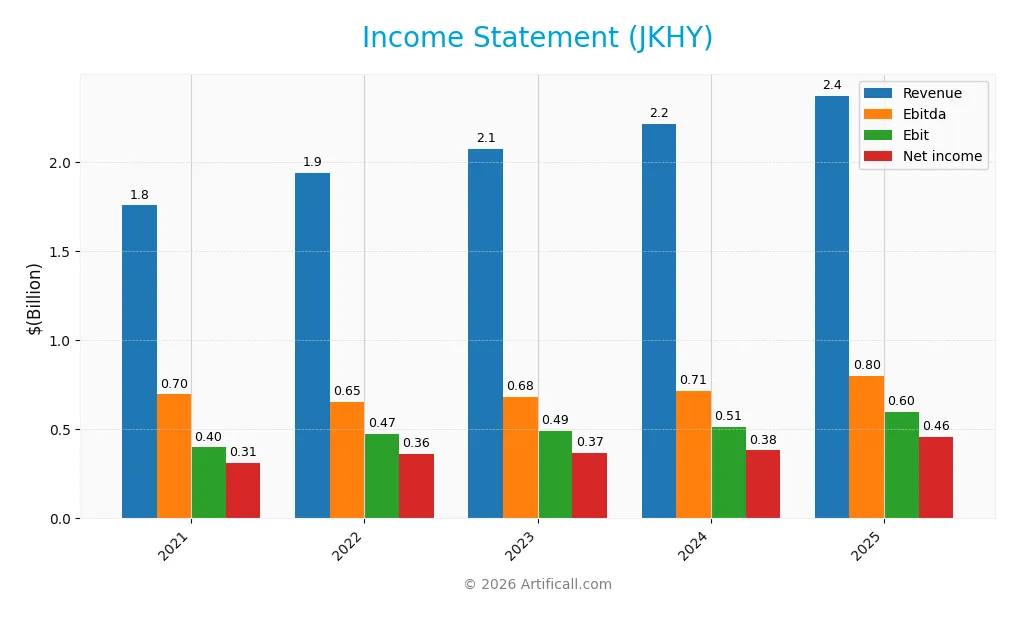
The table below presents the key income statement figures for Jack Henry & Associates, Inc. (JKHY) over the fiscal years 2021 to 2025, expressed in USD.
| 2021 | 2022 | 2023 | 2024 | 2025 | |
|---|---|---|---|---|---|
| Revenue | 1.76B | 1.94B | 2.08B | 2.22B | 2.38B |
| Cost of Revenue | 1.06B | 1.13B | 1.22B | 1.30B | 1.36B |
| Operating Expenses | 296M | 340M | 378M | 427M | 446M |
| Gross Profit | 695M | 814M | 859M | 916M | 1.01B |
| EBITDA | 697M | 652M | 680M | 714M | 801M |
| EBIT | 399M | 475M | 490M | 514M | 596M |
| Interest Expense | 1.14M | 2.38M | 15.07M | 16.38M | 10.44M |
| Net Income | 311M | 363M | 367M | 382M | 456M |
| EPS | 4.12 | 4.95 | 5.03 | 5.24 | 6.24 |
| Filing Date | 2021-08-25 | 2022-08-25 | 2023-08-24 | 2024-08-26 | 2025-08-25 |
Income Statement Evolution
From 2021 to 2025, Jack Henry & Associates, Inc. demonstrated a consistent upward trend in both revenue and net income, with revenue growing 35.1% and net income increasing 46.3%. Gross and EBIT margins improved steadily, reaching 42.7% and 25.1% respectively in 2025, reflecting enhanced operational efficiency. The net margin also expanded by 8.3%, indicating overall profitability improvements over the period.
Is the Income Statement Favorable?
The 2025 fiscal year shows solid fundamentals with revenue of $2.38B and net income of $456M, yielding a net margin of 19.2%, all rated favorable. EBIT growth of 16.0% and EPS growth of 19.3% further underscore positive momentum. Interest expenses remain low relative to revenue at 0.44%, supporting financial stability. Overall, the income statement is considered favorable, reflecting strong profitability and efficient cost management.
Financial Ratios
The table below presents key financial ratios for Jack Henry & Associates, Inc. (JKHY) over the fiscal years 2021 to 2025, reflecting profitability, valuation, liquidity, leverage, efficiency, and dividend metrics:
| Ratios | 2021 | 2022 | 2023 | 2024 | 2025 |
|---|---|---|---|---|---|
| Net Margin | 18% | 19% | 18% | 17% | 19% |
| ROE | 23% | 23% | 20% | 18% | 21% |
| ROIC | 16% | 16% | 16% | 15% | 18% |
| P/E | 40 | 36 | 33 | 31 | 29 |
| P/B | 8.9 | 8.2 | 6.6 | 5.6 | 6.2 |
| Current Ratio | 1.13 | 1.20 | 1.00 | 1.27 | 1.27 |
| Quick Ratio | 1.13 | 1.20 | 1.00 | 1.27 | 1.27 |
| D/E | 0.08 | 0.17 | 0.08 | 0 | 0 |
| Debt-to-Assets | 5% | 10% | 5% | 0% | 0% |
| Interest Coverage | 349 | 199 | 32 | 30 | 54 |
| Asset Turnover | 0.72 | 0.70 | 0.71 | 0.73 | 0.78 |
| Fixed Asset Turnover | 8.3 | 9.4 | 9.7 | 10.0 | 10.7 |
| Dividend Yield | 1.13% | 1.06% | 1.21% | 1.31% | 1.25% |
Evolution of Financial Ratios
From 2021 to 2025, Jack Henry & Associates, Inc. showed an improving trend in Return on Equity (ROE), rising from approximately 22.54% to 21.39%, with slight fluctuations indicating stable profitability. The Current Ratio increased from 1.13 in 2021 to 1.27 in 2025, reflecting a strengthening liquidity position. The Debt-to-Equity Ratio steadily declined to zero by 2025, highlighting a reduction in financial leverage and debt reliance.
Are the Financial Ratios Favorable?
In 2025, profitability ratios such as net margin (19.19%) and ROE (21.39%) are favorable, signaling solid earnings performance. Liquidity is generally positive, with a neutral current ratio of 1.27 but a favorable quick ratio of 1.27. The company maintains zero debt, which is favorable for leverage and risk management. Efficiency shows a neutral asset turnover (0.78) and favorable fixed asset turnover (10.75). Market valuation ratios like P/E (28.88) and P/B (6.18) are unfavorable, while dividend yield (1.25%) is neutral. Overall, 64.29% of ratios are favorable, supporting a positive financial profile.
Shareholder Return Policy
Jack Henry & Associates, Inc. maintains a consistent dividend payout ratio around 36-45%, with dividends per share steadily increasing from $1.84 in 2021 to $2.25 in 2025. The annual dividend yield remains modest at approximately 1.25%, supported by strong free cash flow coverage and a dividend plus capex coverage ratio near 3, indicating prudent distribution management.
The company also engages in share buybacks, complementing dividend payments to return value to shareholders. This balanced policy, backed by solid profitability and cash flow metrics, suggests a sustainable approach to shareholder returns that supports long-term value creation without overextending financial resources.
Score analysis
Here is a radar chart presenting the company’s key financial scores across various evaluation metrics:
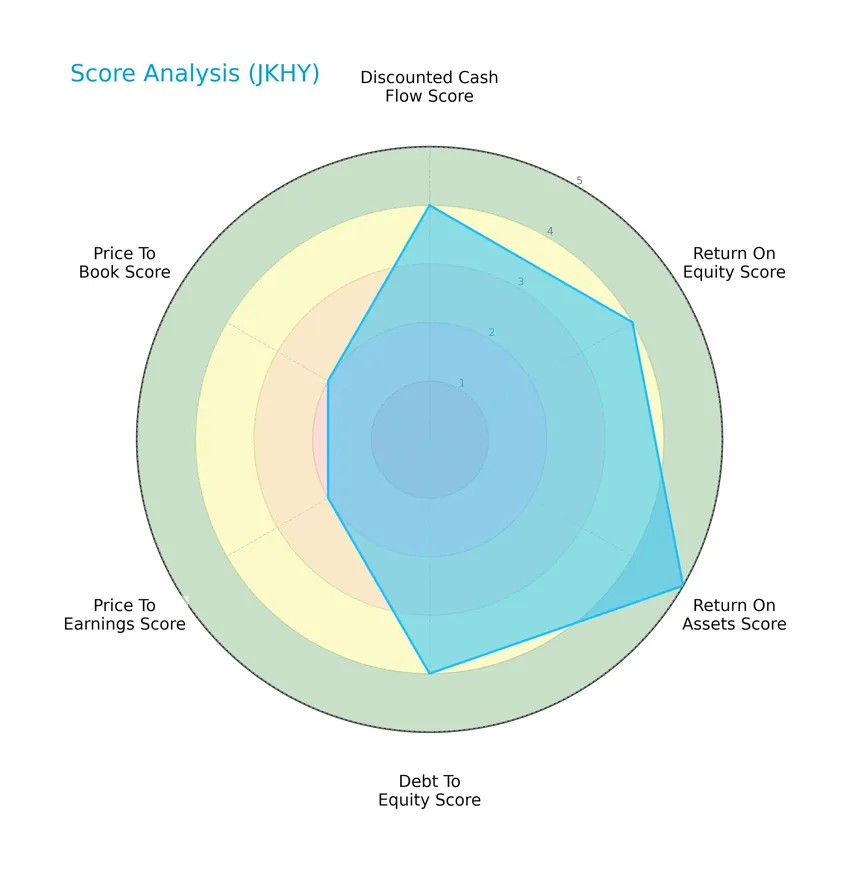
The scores indicate favorable valuations with strong operational efficiency: discounted cash flow, return on equity, return on assets, and debt to equity scores all rank favorably, while price-to-earnings and price-to-book ratios show moderate ratings.
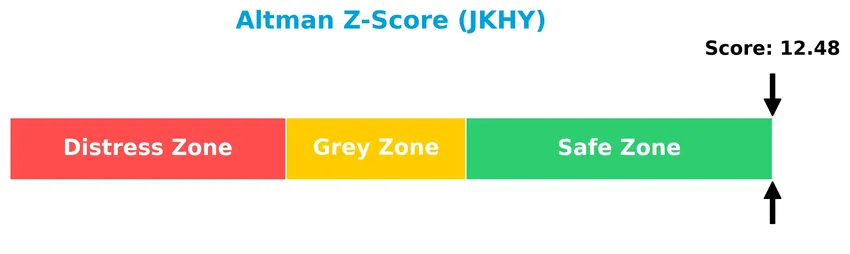
Analysis of the company’s bankruptcy risk
The Altman Z-Score places the company well within the safe zone, indicating a very low risk of bankruptcy and strong financial stability:
Is the company in good financial health?
The Piotroski Score diagram below highlights the company’s strong financial health status:
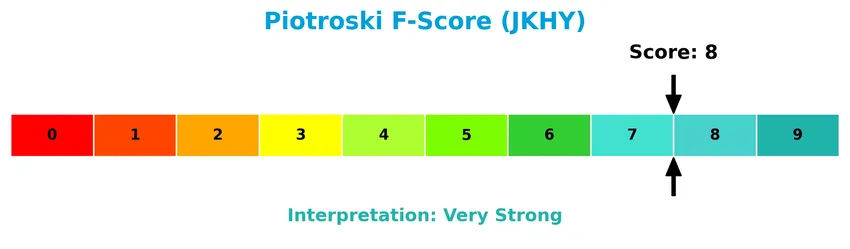
With a Piotroski Score of 8, the company demonstrates very strong financial strength across profitability, leverage, liquidity, and efficiency metrics, signaling robust fundamentals.
Competitive Landscape & Sector Positioning
This analysis examines Jack Henry & Associates, Inc.’s position within the information technology services sector, focusing on its strategic and financial dimensions. I will assess whether the company holds a competitive advantage relative to its main competitors based on its product offerings and market segmentation.
Strategic Positioning
Jack Henry & Associates, Inc. concentrates its product portfolio on financial technology solutions and payment processing primarily for U.S. banks and credit unions, with revenues diversified across Core, Payments, and Complementary segments totaling over $2.3B in 2025, reflecting focused domestic market exposure.
Revenue by Segment
This pie chart details Jack Henry & Associates, Inc.’s revenue distribution by segment for the fiscal year 2025, highlighting the company’s income sources across its main business areas.
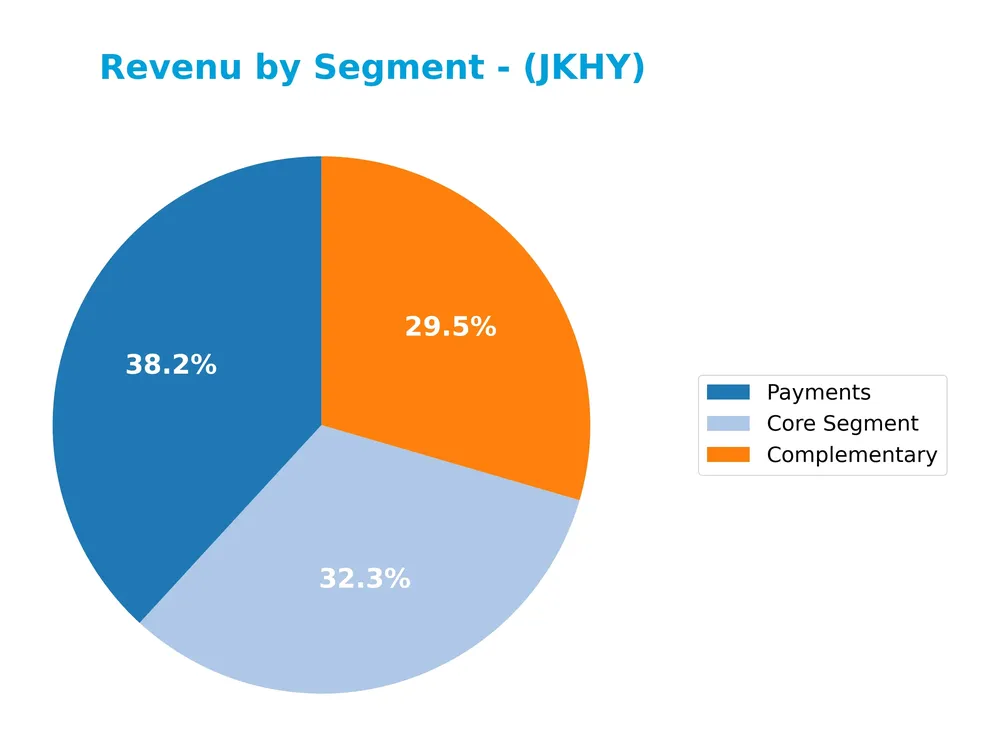
In 2025, Payments led revenue generation with $873M, followed by the Core Segment at $739M and Complementary services at $675M. All segments show steady growth over recent years, with Payments accelerating slightly faster, indicating a growing reliance on transaction-related services. The diversification across these three segments helps mitigate concentration risk, although Payments now represents the largest share of the business.
Key Products & Brands
The table below presents Jack Henry & Associates, Inc.’s main products and brands with their respective descriptions:
| Product | Description |
|---|---|
| Jack Henry Banking | Core data processing solutions for banks, including SilverLake (commercial-focused), CIF 20/20 (parameter-driven), and Core Director (cost-efficient). |
| Symitar | Core data processing solutions tailored for credit unions, featuring the Episys platform. |
| ProfitStars | Specialized financial performance, imaging and payments processing, information security and risk management, retail delivery, and online/mobile solutions. |
| Complementary Products | Integrated applications and services that support core bank and credit union clients in deposit, loan, general ledger transactions, and customer/member information management. |
| Payments Solutions | Electronic payment services and digital products, including payment processing for financial institutions and corporate entities. |
| Hardware Systems | Purchase and resale of servers, workstations, scanners, and other related devices. |
| Implementation & Support | Services including implementation, training, and ongoing support for Jack Henry’s technology solutions. |
Jack Henry & Associates offers a comprehensive portfolio of core banking and credit union platforms, complemented by payments and specialized financial technology services, supported by hardware and client services.
Main Competitors
There are 16 competitors in total, with the table below listing the top 10 leaders by market capitalization:
| Competitor | Market Cap. |
|---|---|
| International Business Machines Corporation | 272.5B |
| Accenture plc | 162.0B |
| Cognizant Technology Solutions Corporation | 39.9B |
| Fiserv, Inc. | 35.7B |
| Fidelity National Information Services, Inc. | 34.0B |
| Wipro Limited | 29.7B |
| Leidos Holdings, Inc. | 23.5B |
| Gartner, Inc. | 18.2B |
| CDW Corporation | 17.3B |
| Jack Henry & Associates, Inc. | 13.0B |
Jack Henry & Associates, Inc. ranks 10th among its 16 competitors by market capitalization. Its market cap is approximately 4.94% of the largest competitor, International Business Machines Corporation. The company’s market capitalization is below both the average market cap of the top 10 competitors (64.6B) and the median market cap of the sector (17.8B). Jack Henry & Associates maintains a 28.9% gap below the nearest competitor above it in ranking.
Comparisons with competitors
Check out how we compare the company to its competitors:
Does JKHY have a competitive advantage?
Jack Henry & Associates, Inc. demonstrates a durable competitive advantage, supported by a very favorable moat status with a ROIC exceeding its WACC by over 10%, indicating consistent value creation and efficient capital use. The company’s income statement shows strong profitability with favorable margins and growth in revenue, net income, and EPS over the 2021-2025 period.
Looking ahead, JKHY benefits from its diversified product portfolio across core banking, credit unions, and payment processing segments, positioning it well to capture new opportunities in digital financial services. Continued innovation in integrated applications and expansion in electronic payment solutions support a positive outlook for market growth and technology-driven demand.
SWOT Analysis
This SWOT analysis highlights the key strengths, weaknesses, opportunities, and threats to help investors understand Jack Henry & Associates, Inc.’s strategic position.
Strengths
- strong profitability with 19.19% net margin
- durable competitive advantage with growing ROIC
- very favorable financial health scores (Altman Z-score 12.48, Piotroski 8)
Weaknesses
- relatively high price-to-earnings ratio (28.88)
- elevated price-to-book ratio (6.18)
- moderate revenue growth of 7.21% last year
Opportunities
- expanding digital payment and fintech markets
- increasing demand for integrated banking technology
- potential for cross-selling complementary products
Threats
- intense competition in fintech and IT services
- regulatory changes impacting financial tech providers
- cybersecurity risks affecting client trust
Jack Henry & Associates demonstrates robust profitability and financial stability, supporting a strong moat. However, valuation metrics suggest caution. Strategic focus should leverage growth in digital financial services while managing competitive and regulatory risks prudently.
Stock Price Action Analysis
The following weekly chart illustrates Jack Henry & Associates, Inc. (JKHY) stock price movements over the past 100 weeks, highlighting key highs and lows along with recent acceleration in its upward trend:
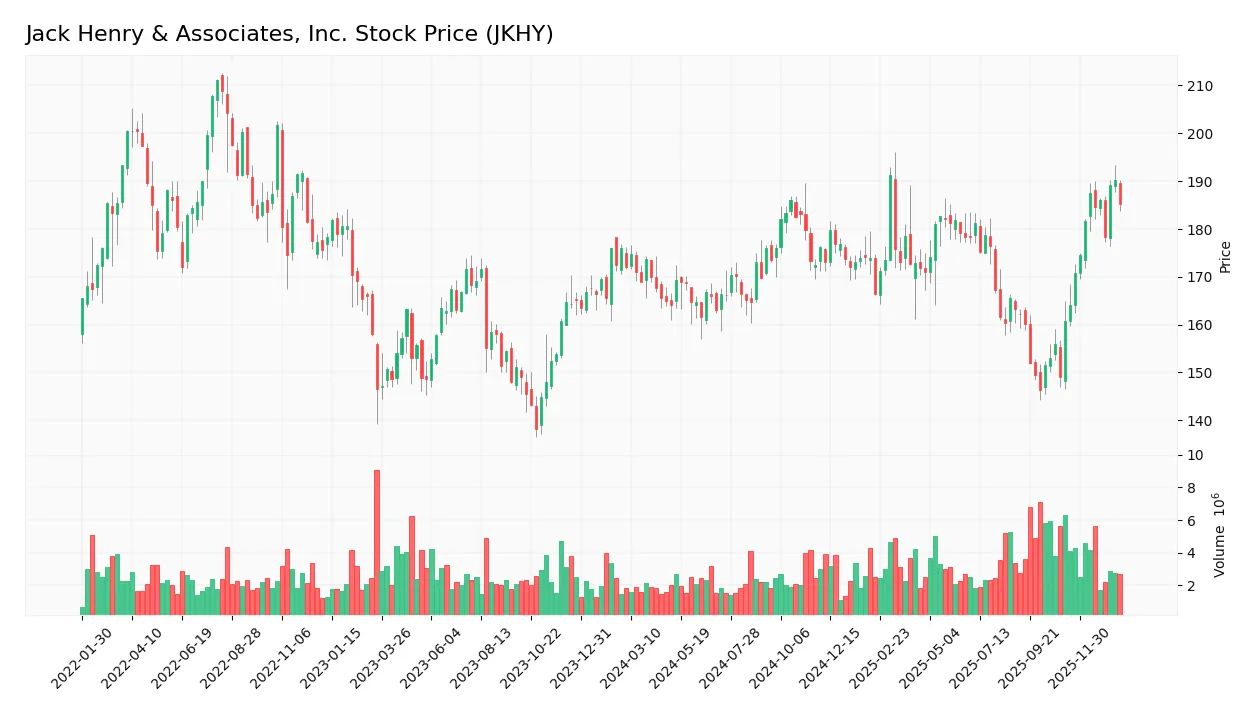
Trend Analysis
Over the past 12 months, JKHY stock increased by 7.65%, indicating a bullish trend with acceleration. The price ranged between a low of 146.26 and a high of 191.28, supported by a volatility level reflected in a 9.18 standard deviation. Recent months show a stronger slope of 2.32 and a 15.12% gain.
Volume Analysis
Trading volume shows an increasing trend with a total of 348M shares traded recently. Buyer volume accounts for 48.26%, slightly below seller volume, suggesting balanced but growing market participation. In the recent period, buyer dominance surged to 76.04%, reflecting strong buyer-driven momentum and heightened investor confidence.
Target Prices
Analysts present a moderately optimistic consensus target for Jack Henry & Associates, Inc.
| Target High | Target Low | Consensus |
|---|---|---|
| 220 | 161 | 196.57 |
The target prices suggest a potential upside from current levels, with analysts expecting the stock to trade near 197 on average, reflecting confidence in the company’s prospects.

Don’t Let Luck Decide Your Entry Point
Optimize your entry points with our advanced ProRealTime indicators. You’ll get efficient buy signals with precise price targets for maximum performance. Start outperforming now!
Analyst & Consumer Opinions
This section examines the latest analyst ratings and consumer feedback related to Jack Henry & Associates, Inc. (JKHY).
Stock Grades
Here are the latest verified analyst grades for Jack Henry & Associates, Inc., showing recent rating updates and maintained positions:
| Grading Company | Action | New Grade | Date |
|---|---|---|---|
| UBS | Maintain | Neutral | 2026-01-08 |
| Wolfe Research | Upgrade | Outperform | 2026-01-08 |
| RBC Capital | Upgrade | Outperform | 2025-12-16 |
| Baird | Maintain | Neutral | 2025-12-15 |
| Keefe, Bruyette & Woods | Upgrade | Outperform | 2025-12-08 |
| Goldman Sachs | Maintain | Neutral | 2025-11-07 |
| Wells Fargo | Maintain | Equal Weight | 2025-11-06 |
| Compass Point | Upgrade | Buy | 2025-11-06 |
| DA Davidson | Maintain | Buy | 2025-10-29 |
| Goldman Sachs | Maintain | Neutral | 2025-10-13 |
Overall, the analyst community shows a positive shift with multiple upgrades to Outperform and Buy, while several firms maintain neutral stances, indicating cautious optimism toward the stock.
Consumer Opinions
Consumers express a mix of appreciation and frustration when it comes to Jack Henry & Associates, Inc., reflecting varied experiences with its services.
| Positive Reviews | Negative Reviews |
|---|---|
| Reliable and secure payment processing solutions. | Customer support can be slow to respond during peak times. |
| User-friendly software interfaces that simplify banking operations. | Occasional software glitches during system updates. |
| Strong focus on data security, giving users peace of mind. | Some features lack customization for smaller financial institutions. |
| Consistent updates keep the platform current with industry standards. | Training resources for new users could be more comprehensive. |
Overall, Jack Henry & Associates is praised for its secure, user-friendly banking solutions, though some users point to support delays and limited customization as areas for improvement.
Risk Analysis
The following table summarizes key risks related to Jack Henry & Associates, Inc., highlighting their likelihood and potential impact:
| Category | Description | Probability | Impact |
|---|---|---|---|
| Market Valuation | Elevated P/E of 28.88 and P/B of 6.18 indicate potential overvaluation risk. | Medium | High |
| Technology Shift | Rapid fintech innovation and evolving customer demands could challenge legacy systems. | Medium | Medium |
| Regulatory Risk | Changes in financial services regulations may increase compliance costs or limit operations. | Low | Medium |
| Cybersecurity | As a technology provider to financial institutions, vulnerability to cyber attacks is critical. | Medium | High |
| Competitive Pressure | Intense competition in IT services and payment processing could pressure margins. | Medium | Medium |
| Economic Downturn | Economic slowdown could reduce demand for financial technology solutions and services. | Low | Medium |
The most significant risks for Jack Henry & Associates are market valuation concerns due to its relatively high multiples, and cybersecurity threats given its role in financial services technology. However, the company’s strong financial health, a safe Altman Z-score of 12.48, and a very strong Piotroski score of 8, mitigate bankruptcy risk substantially. Investors should monitor valuation levels and cybersecurity developments closely.
Should You Buy Jack Henry & Associates, Inc.?
Jack Henry & Associates, Inc. appears to be a robustly profitable company with a very favorable durable competitive moat, supported by growing ROIC and value creation. Its leverage profile is manageable, while its overall A- rating suggests a strong financial health profile could be seen as attractive for investors.
Strength & Efficiency Pillars
Jack Henry & Associates, Inc. exhibits strong profitability with a net margin of 19.19% and a return on equity (ROE) of 21.39%. Its return on invested capital (ROIC) stands at 17.63%, significantly exceeding the weighted average cost of capital (WACC) of 7.29%, confirming that the company is a clear value creator. Financial health is robust, supported by an Altman Z-Score of 12.48, placing it well within the safe zone, and a Piotroski Score of 8, indicating very strong financial strength. These metrics underscore a durable competitive advantage with growing profitability.
Weaknesses and Drawbacks
Valuation metrics present some caution; the price-to-earnings (P/E) ratio of 28.88 and price-to-book (P/B) ratio of 6.18 are considered unfavorable, suggesting the stock trades at a premium that may limit upside potential. Leverage is minimal with a debt-to-equity ratio of 0, which is favorable, but the current ratio of 1.27 is neutral, indicating only moderate short-term liquidity. Market pressure appears manageable with buyer dominance at 76.04% in the recent period, mitigating immediate selling risks, yet the overall volume shows a slight seller majority historically, which may signal intermittent volatility.
Our Verdict about Jack Henry & Associates, Inc.
The company’s long-term fundamental profile is favorable, supported by strong profitability, sound financial health, and clear value creation. The bullish overall stock trend combined with recent strong buyer dominance suggests momentum may continue. This profile might appear attractive for long-term exposure, though investors should remain mindful of its premium valuation that could temper near-term gains. A cautious approach could be warranted for those seeking optimal entry points.
Disclaimer: This content is for informational purposes only and does not constitute financial, investment, or other professional advice. Investing in financial markets involves a significant risk of loss, and past performance is not indicative of future results.
Additional Resources
- 8 cool things to check out at the 2026 NY Sportsman’s Expo – syracuse.com (Jan 24, 2026)
- Vest Financial LLC Invests $1.30 Million in Jack Henry & Associates, Inc. $JKHY – MarketBeat (Jan 24, 2026)
- John Henry Berglund – Skandia, MI – June 23, 1930 ~ January 18, 2026 – uppermichiganssource.com (Jan 23, 2026)
- Jack Henry & Associates to Provide Webcast of Second Quarter Fiscal 2026 Earnings Call – Yahoo Finance (Jan 21, 2026)
- Jack Henry Expands Instant Payments And Digital Assets As Valuation Stays Stretched – simplywall.st (Jan 22, 2026)
For more information about Jack Henry & Associates, Inc., please visit the official website: jackhenry.com