Home > Analyses > Technology > Jabil Inc.
Jabil Inc. powers the backbone of countless electronic devices, shaping how technology integrates into our daily lives. As a frontrunner in electronics manufacturing services, Jabil delivers cutting-edge design, production, and product management solutions across diverse industries—from 5G networks to healthcare devices. Renowned for its innovation and operational excellence, the company stands at the crossroads of technology and manufacturing. The key question for investors is whether Jabil’s robust fundamentals and market influence continue to justify its valuation and growth prospects in an evolving landscape.

Table of contents
Business Model & Company Overview
Jabil Inc., founded in 1966 and headquartered in Saint Petersburg, Florida, stands as a leading force in the hardware, equipment, and parts industry. Its integrated ecosystem spans electronics manufacturing services and diversified manufacturing solutions, delivering end-to-end design, production, and product management. From application-specific integrated circuits to three-dimensional mechanical designs, Jabil supports a broad range of industries including 5G, automotive, healthcare, and digital print, positioning itself as a comprehensive partner for complex manufacturing challenges.
The company’s revenue engine balances hardware production with software-driven services and recurring consulting offerings, such as product validation and manufacturing test solutions. Jabil’s strategic footprint across the Americas, Europe, and Asia enables it to serve a global clientele efficiently, leveraging scale and regional expertise. This global presence, combined with its diversified service portfolio, underpins a robust economic moat that secures its role as a key architect in the future of manufacturing innovation.
Financial Performance & Fundamental Metrics
This section analyzes Jabil Inc.’s income statement, key financial ratios, and dividend payout policy to provide a clear view of its fundamental strength.
Income Statement
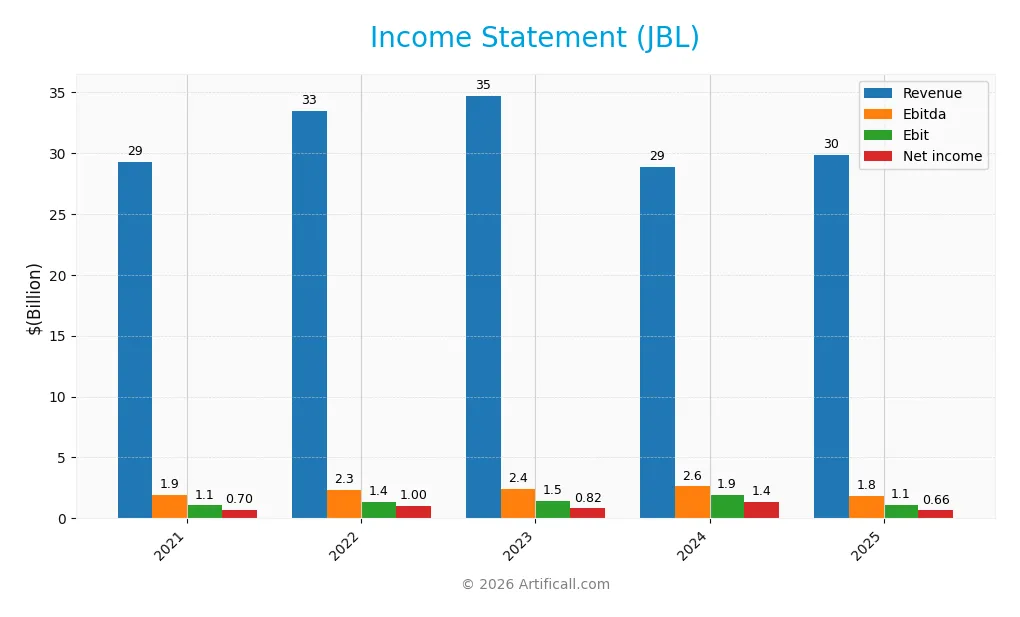
The table below summarizes Jabil Inc.’s key income statement metrics over the past five fiscal years, providing a clear view of its revenue, expenses, profitability, and earnings per share.
| 2021 | 2022 | 2023 | 2024 | 2025 | |
|---|---|---|---|---|---|
| Revenue | 29.3B | 33.5B | 34.7B | 28.9B | 29.8B |
| Cost of Revenue | 26.9B | 30.8B | 31.8B | 26.2B | 27.2B |
| Operating Expenses | 1.30B | 1.24B | 1.33B | 663M | 1.46B |
| Gross Profit | 2.36B | 2.63B | 2.87B | 2.68B | 2.65B |
| EBITDA | 1.94B | 2.30B | 2.39B | 2.62B | 1.81B |
| EBIT | 1.07B | 1.38B | 1.47B | 1.92B | 1.14B |
| Interest Expense | 130M | 151M | 206M | 173M | 244M |
| Net Income | 696M | 996M | 818M | 1.39B | 657M |
| EPS | 4.69 | 7.05 | 6.15 | 11.34 | 6.00 |
| Filing Date | 2021-10-22 | 2022-10-25 | 2023-10-20 | 2024-10-28 | 2025-10-17 |
Income Statement Evolution
Between 2021 and 2025, Jabil Inc.’s revenue showed mixed trends with a 1.77% overall unfavorable growth, while net income declined by 5.6%. Gross profit and EBIT margins remained mostly stable, with gross margin neutral at 8.88% and EBIT margin neutral at 3.81%. However, net margin contracted, reflecting pressure on profitability despite a slight revenue increase in the latest year.
Is the Income Statement Favorable?
In 2025, Jabil reported $29.8B in revenue, up 3.18% year-over-year, but net income fell sharply to $657M, a 54.13% decline in net margin and a 47% drop in EPS. Interest expense was favorable at 0.82% of revenue, yet operating income and EBIT shrank considerably. Overall, the fundamentals for 2025 appear unfavorable due to declining profitability metrics amid stable revenue growth.
Financial Ratios
The table below presents key financial ratios for Jabil Inc. from 2021 to 2025, reflecting profitability, valuation, liquidity, leverage, and efficiency metrics:
| Ratios | 2021 | 2022 | 2023 | 2024 | 2025 |
|---|---|---|---|---|---|
| Net Margin | 2.38% | 2.98% | 2.36% | 4.81% | 2.20% |
| ROE | 32.58% | 40.64% | 28.54% | 79.91% | 43.42% |
| ROIC | 12.83% | 17.50% | 14.58% | 28.18% | 16.06% |
| P/E | 13.18 | 8.55 | 18.60 | 9.64 | 34.14 |
| P/B | 4.30 | 3.47 | 5.31 | 7.70 | 14.82 |
| Current Ratio | 1.02 | 1.02 | 1.16 | 1.09 | 1.00 |
| Quick Ratio | 0.60 | 0.57 | 0.75 | 0.72 | 0.66 |
| D/E | 1.55 | 1.39 | 1.13 | 1.88 | 2.22 |
| Debt-to-Assets | 19.93% | 17.30% | 16.72% | 18.77% | 18.15% |
| Interest Coverage | 8.12 | 9.23 | 7.46 | 11.64 | 4.84 |
| Asset Turnover | 1.76 | 1.70 | 1.79 | 1.66 | 1.61 |
| Fixed Asset Turnover | 6.56 | 7.52 | 9.90 | 8.54 | 9.01 |
| Dividend Yield | 0.54% | 0.56% | 0.30% | 0.31% | 0.16% |
Evolution of Financial Ratios
From 2021 to 2025, Jabil Inc.’s Return on Equity (ROE) showed significant improvement, peaking at 79.9% in 2024 before settling at 43.4% in 2025. The Current Ratio remained relatively stable around 1.0–1.16, indicating consistent liquidity. However, the Debt-to-Equity Ratio increased steadily from 1.55 in 2021 to 2.22 in 2025, signaling rising leverage. Profitability experienced fluctuations, with net profit margin declining to 2.2% in 2025 from a high of 4.8% in 2024.
Are the Financial Ratios Favorable?
In 2025, Jabil’s profitability shows mixed signals: a favorable ROE of 43.4% contrasts with an unfavorable net margin of 2.2%. Liquidity ratios are mostly neutral to unfavorable, with a current ratio at 1.0 (neutral) and quick ratio at 0.66 (unfavorable). Leverage is unfavorable due to a high debt-to-equity ratio of 2.22, though the debt-to-assets ratio is favorable at 18.15%. Efficiency ratios, such as asset turnover (1.61) and fixed asset turnover (9.01), are favorable, while valuation multiples like PE (34.14) and PB (14.82) appear unfavorable, resulting in a slightly unfavorable overall ratios assessment.
Shareholder Return Policy
Jabil Inc. consistently pays dividends, with a payout ratio around 5.5% and a stable dividend per share near $0.33. The annual dividend yield remains low, approximately 0.16% in 2025. The company covers dividends well through free cash flow, supported by moderate share buybacks.
This disciplined approach balances shareholder returns with capital needs. Dividend payouts and buybacks appear sustainable given cash flow coverage, reducing risk of over-distribution. Overall, Jabil’s policy supports steady long-term value, reflecting prudent cash deployment and shareholder alignment.
Score analysis
The following radar chart illustrates Jabil Inc.’s key financial scores across several valuation and performance metrics:
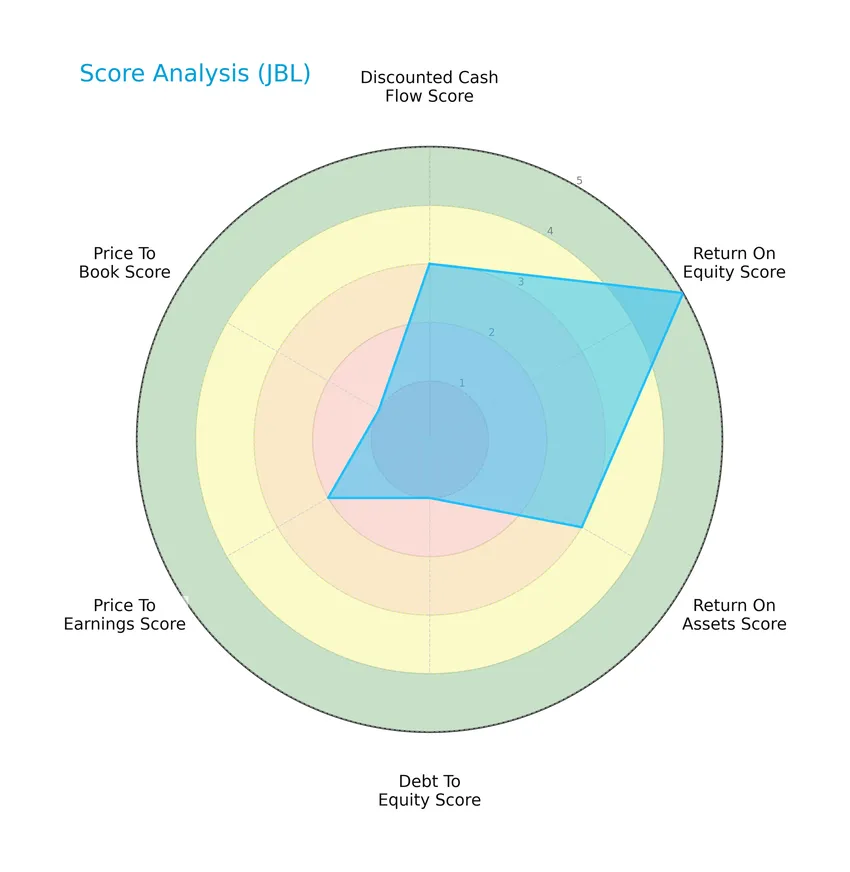
Jabil Inc. presents mixed scores: a moderate discounted cash flow and return on assets, a very favorable return on equity, but very unfavorable debt to equity and price to book ratios. The price to earnings score remains moderate, reflecting balanced market valuation.
Analysis of the company’s bankruptcy risk
Jabil Inc.’s Altman Z-Score indicates a strong financial position with a low bankruptcy risk, placing the company firmly in the safe zone:

Is the company in good financial health?
The Piotroski Score diagram below highlights Jabil Inc.’s solid financial strength and operational efficiency:

With a Piotroski Score of 8, Jabil Inc. demonstrates very strong financial health, indicating robust profitability, liquidity, and effective leverage management.
Competitive Landscape & Sector Positioning
This sector analysis will explore Jabil Inc.’s strategic positioning, revenue by segment, key products, main competitors, competitive advantages, and SWOT analysis. I will assess whether Jabil holds a competitive advantage over its industry peers in the technology hardware and equipment sector.
Strategic Positioning
Jabil Inc. maintains a diversified product portfolio across Electronics Manufacturing Services and Diversified Manufacturing Services, serving sectors like 5G, automotive, healthcare, and industrial. Geographically, it has broad exposure with significant revenues from the US (7.4B), Mexico (5.7B), China (4.2B), Malaysia (3.6B), and other regions totaling 8.8B in 2025.
Revenue by Segment
The pie chart illustrates Jabil Inc.’s revenue distribution by product segments for the fiscal year 2025, highlighting the relative size of each key business area.
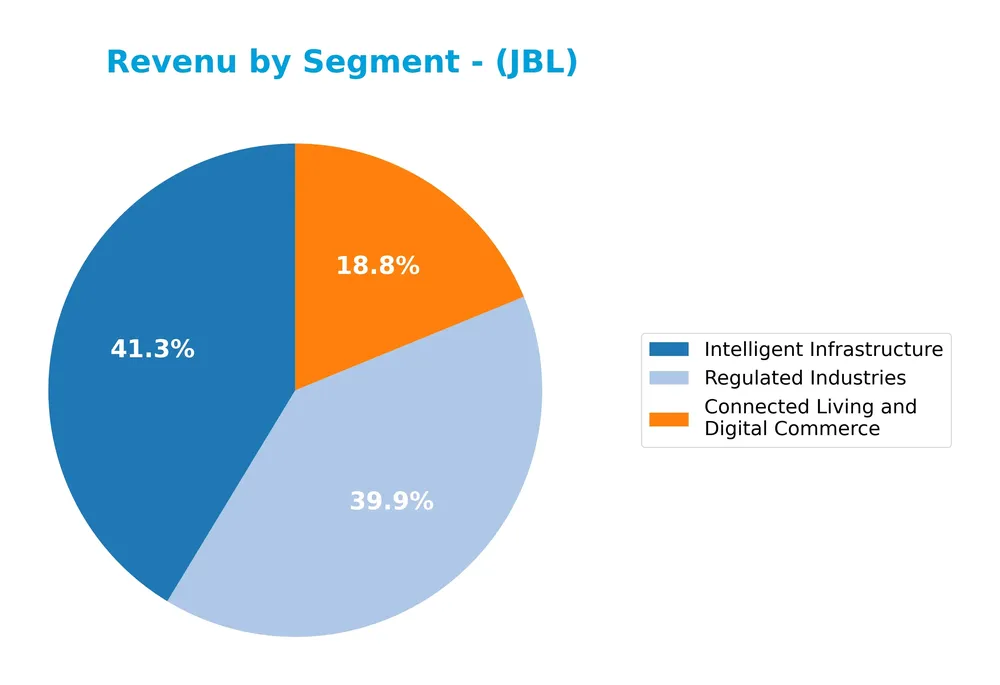
In 2025, Jabil’s revenue is divided among Connected Living and Digital Commerce (5.6B), Intelligent Infrastructure (12.3B), and Regulated Industries (11.9B). Intelligent Infrastructure leads as the largest segment, closely followed by Regulated Industries, while Connected Living contributes a smaller share. This segmentation indicates a diversified portfolio with a strong emphasis on infrastructure and regulated markets. The shift from previous years’ segment reporting suggests a strategic realignment or reclassification of business units.
Key Products & Brands
The following table outlines Jabil Inc.’s main products and brand segments with their descriptions:
| Product | Description |
|---|---|
| Electronics Manufacturing Services (EMS) | Offers electronics design, production, and product management including application-specific IC design, firmware development, rapid prototyping, and printed circuit board assemblies (PCBA). |
| Diversified Manufacturing Services (DMS) | Provides design and manufacturing services for plastic and metal enclosures, electro-mechanics, 3D mechanical design, industrial design, tooling management, and product/process validation. |
| Connected Living and Digital Commerce | Segment focused on technologies related to connected devices and digital commerce solutions. |
| Intelligent Infrastructure | Segment serving infrastructure needs in networking, storage, 5G, wireless, and cloud industries. |
| Regulated Industries | Segment addressing manufacturing requirements for regulated sectors including healthcare, automotive, and packaging. |
Jabil Inc. operates primarily through two broad manufacturing service segments—EMS and DMS—while also focusing on key industry verticals such as connected living, intelligent infrastructure, and regulated industries, reflecting its diversified service portfolio in technology-driven manufacturing.
Main Competitors
There are 20 competitors in total, with the table below listing the top 10 leaders by market capitalization:
| Competitor | Market Cap. |
|---|---|
| Amphenol Corporation | 171B |
| Corning Incorporated | 77.7B |
| TE Connectivity Ltd. | 68.6B |
| Sandisk Corporation | 40B |
| Garmin Ltd. | 39B |
| Keysight Technologies, Inc. | 35.5B |
| Celestica Inc. | 34B |
| Coherent, Inc. | 28.7B |
| Jabil Inc. | 25.7B |
| Teledyne Technologies Incorporated | 24.4B |
Jabil Inc. ranks 9th among 20 competitors in the Technology sector, Hardware, Equipment & Parts industry. Its market cap is 15.19% of the top player, Amphenol Corporation. Jabil is below the average market cap of the top 10 at 54.4B but remains above the sector median of 21.6B. It holds a 10.42% market cap gap from the next competitor above, Coherent, Inc.
Comparisons with competitors
Check out how we compare the company to its competitors:
Does JBL have a competitive advantage?
Jabil Inc. demonstrates a clear competitive advantage, as indicated by a ROIC exceeding its WACC by 6.8%, coupled with a 25% growth trend in ROIC from 2021 to 2025. This reflects efficient capital use and value creation, supporting a very favorable moat status.
Looking ahead, JBL’s diverse manufacturing services and solutions span multiple industries, including 5G, automotive, healthcare, and digital print. The company’s continued focus on electronics design and process validation positions it well to capture growth opportunities in evolving technology and manufacturing markets.
SWOT Analysis
This SWOT analysis identifies key factors influencing Jabil Inc.’s current market position and strategic outlook.
Strengths
- strong ROE at 43.42%
- durable competitive advantage with growing ROIC
- diversified global manufacturing footprint
Weaknesses
- declining net margin and EPS growth
- high debt-to-equity ratio at 2.22
- unfavorable liquidity ratios (quick ratio 0.66)
Opportunities
- expansion in emerging markets like Mexico and Malaysia
- growth potential in 5G and cloud services sectors
- increasing demand for electronics manufacturing services
Threats
- intense competition in hardware and electronics sector
- geopolitical risks affecting supply chain
- margin pressure from rising operating expenses
Overall, Jabil demonstrates solid profitability and a strong competitive moat, yet faces margin erosion and financial leverage concerns. Strategic focus should prioritize margin improvement and risk mitigation while leveraging growth in emerging markets and technology sectors.
Stock Price Action Analysis
The weekly stock chart for Jabil Inc. (JBL) over the last 12 months highlights significant price movements and trend developments:
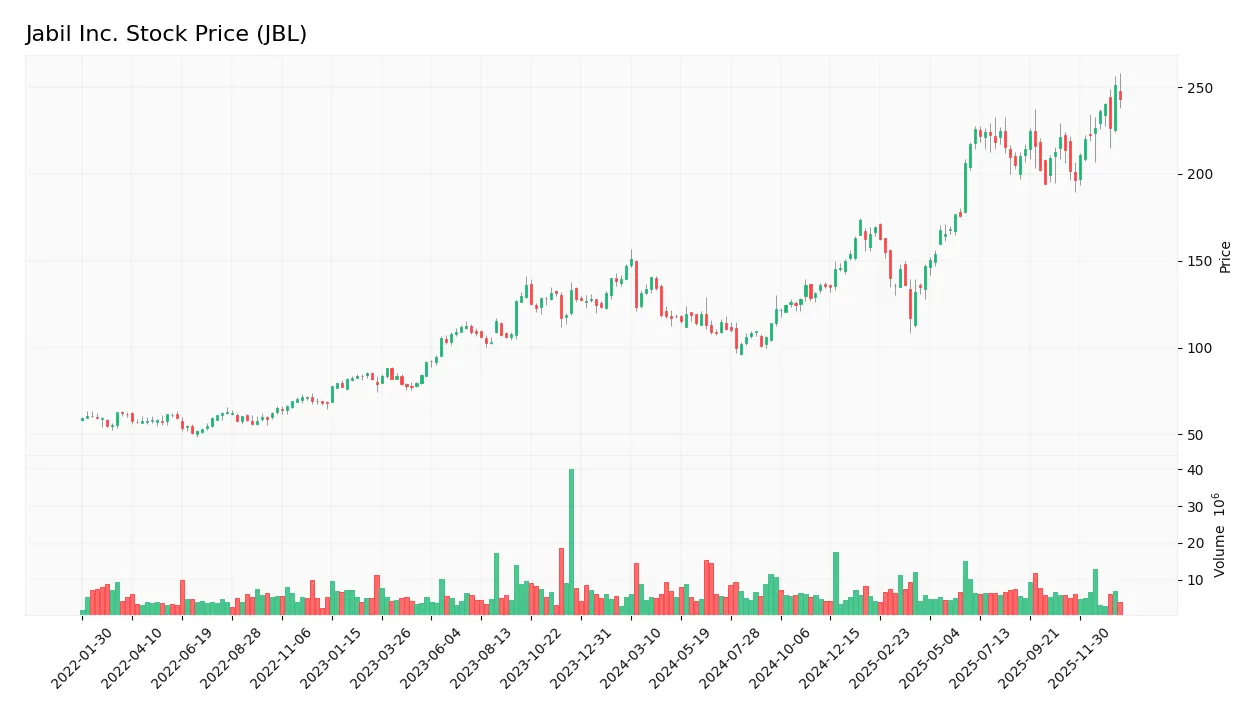
Trend Analysis
Over the past 12 months, JBL’s stock price increased by 65.2%, indicating a bullish trend with clear acceleration. The price reached a high of 251.29 and a low of 99.62, reflecting substantial volatility as shown by a standard deviation of 43.67. Recent weeks confirm continued upward momentum.
Volume Analysis
In the last three months, trading volume shows a buyer-driven pattern with buyers accounting for 61.06% of activity. However, overall volume is decreasing, suggesting cautious participation despite buyer dominance. This points to selective accumulation rather than broad market enthusiasm.
Target Prices
The consensus target prices for Jabil Inc. indicate a positive outlook among analysts.
| Target High | Target Low | Consensus |
|---|---|---|
| 283 | 244 | 267.25 |
Analysts expect Jabil’s stock price to range between 244 and 283, with a consensus target near 267, reflecting moderate confidence in its growth potential.

Don’t Let Luck Decide Your Entry Point
Optimize your entry points with our advanced ProRealTime indicators. You’ll get efficient buy signals with precise price targets for maximum performance. Start outperforming now!
Analyst & Consumer Opinions
This section examines recent analyst ratings and consumer feedback related to Jabil Inc. (JBL) performance and reputation.
Stock Grades
The following table summarizes recent stock grades for Jabil Inc. from leading financial institutions, reflecting their latest evaluations as of late 2025:
| Grading Company | Action | New Grade | Date |
|---|---|---|---|
| Barclays | Maintain | Overweight | 2025-12-18 |
| JP Morgan | Maintain | Overweight | 2025-12-18 |
| UBS | Maintain | Neutral | 2025-12-18 |
| B of A Securities | Maintain | Buy | 2025-12-10 |
| Barclays | Maintain | Overweight | 2025-09-26 |
| B of A Securities | Maintain | Buy | 2025-09-26 |
| JP Morgan | Maintain | Overweight | 2025-07-17 |
| B of A Securities | Maintain | Buy | 2025-06-20 |
| Raymond James | Maintain | Strong Buy | 2025-06-18 |
| JP Morgan | Maintain | Overweight | 2025-06-18 |
Overall, the grades show a consistent positive outlook from major analysts, with most maintaining overweight or buy ratings, while UBS holds a neutral stance. No recent downgrades or sell recommendations are evident.
Consumer Opinions
Consumers express a mix of appreciation and concern regarding Jabil Inc.’s products and services.
| Positive Reviews | Negative Reviews |
|---|---|
| High-quality manufacturing standards | Occasional delays in product delivery |
| Responsive customer service | Limited customization options |
| Competitive pricing | Some concerns about product durability |
Overall, Jabil Inc. is praised for its quality and customer support, but recurring issues with delivery times and product longevity suggest areas for improvement.
Risk Analysis
Below is a summary table of key risks associated with investing in Jabil Inc. (JBL), highlighting their probability and potential impact:
| Category | Description | Probability | Impact |
|---|---|---|---|
| Financial Health | Moderate debt-to-equity ratio (2.22) poses leverage risk despite favorable debt-to-assets ratio. | Medium | High |
| Valuation | High price-to-earnings (34.14) and price-to-book (14.82) ratios may signal overvaluation risk. | High | Medium |
| Profitability | Low net margin (2.2%) indicates thin profitability, impacting sustained earnings growth. | High | Medium |
| Liquidity | Quick ratio of 0.66 suggests limited short-term liquidity, posing operational cash flow risk. | Medium | Medium |
| Market Volatility | Beta of 1.246 reflects above-market volatility, increasing exposure to market swings. | High | Medium |
| Industry Risks | Exposure to cyclical tech hardware sector and supply chain disruptions affect revenue stability. | Medium | High |
Among these, valuation and profitability risks are the most likely and impactful given JBL’s elevated P/E and thin margins amid a competitive sector. However, the company’s strong Altman Z-score (3.16, safe zone) and Piotroski score (8, very strong) mitigate bankruptcy risk and indicate solid financial health. Caution is advised due to leverage and liquidity constraints, which could amplify downturn effects.
Should You Buy Jabil Inc.?
Jabil Inc. appears to be delivering improving profitability with a durable competitive moat supported by growing ROIC, yet its leverage profile could be seen as substantial. Despite this, the company’s overall rating of B- suggests a moderate risk-return profile for investors.
Strength & Efficiency Pillars
Jabil Inc. exhibits a robust profitability profile with a return on equity (ROE) of 43.42% and a return on invested capital (ROIC) of 16.06%, both signaling efficient capital use. Its ROIC notably exceeds the weighted average cost of capital (WACC) at 9.24%, marking the company as a clear value creator. Financial health is further supported by an Altman Z-Score of 3.16, placing Jabil comfortably in the safe zone, and a strong Piotroski score of 8, which underscores solid operational and financial strength. These metrics illustrate Jabil’s durable competitive advantage and growing profitability.
Weaknesses and Drawbacks
Despite its strengths, Jabil faces valuation challenges with a high price-to-earnings (P/E) ratio of 34.14 and a price-to-book (P/B) ratio of 14.82, reflecting a considerable premium that may pressure future returns. Leverage is a concern, with a debt-to-equity ratio of 2.22 and a quick ratio of only 0.66, indicating weaker short-term liquidity. The net margin is low at 2.2%, coupled with unfavorable recent income trends, including a 54.13% decline in net margin growth over one year. These factors suggest elevated financial risk and constrain near-term profitability.
Our Verdict about Jabil Inc.
Jabil presents a favorable long-term fundamental profile driven by strong capital efficiency and financial stability. Coupled with a bullish overall stock trend and dominant buyer behavior in the recent period, the company’s outlook may appear attractive for long-term exposure. However, its stretched valuation and leverage risks suggest that investors might consider a cautious approach, balancing potential growth against near-term headwinds.
Disclaimer: This content is for informational purposes only and does not constitute financial, investment, or other professional advice. Investing in financial markets involves a significant risk of loss, and past performance is not indicative of future results.
Additional Resources
- How Jabil’s RF Power Push with EHT Semi Could Reshape the JBL Semiconductor Narrative – simplywall.st (Jan 24, 2026)
- Jabil Inc (NYSE:JBL) Fits the Minervini Growth Momentum and Trend Template Criteria – Chartmill (Jan 23, 2026)
- Jabil to pay $0.08 dividend March 3, keeps streak since 2006 – Stock Titan (Jan 22, 2026)
- Jabil: Rating Upgrade On Better Revenue Visibility And Competitive Position – Seeking Alpha (Jan 21, 2026)
- Jabil’s (NYSE:JBL) Soft Earnings Don’t Show The Whole Picture – Yahoo Finance (Jan 20, 2026)
For more information about Jabil Inc., please visit the official website: jabil.com