Home > Analyses > Industrials > J.B. Hunt Transport Services, Inc.
J.B. Hunt transforms North American freight movement with a vast, integrated logistics network. Its flagship segments—Intermodal, Dedicated Contract Services, and Final Mile—drive efficiency across diverse supply chains. The company’s relentless innovation in fleet management and technology cements its industry leadership. As market dynamics shift and competition intensifies, I ask: do J.B. Hunt’s fundamentals still support its premium valuation and growth ambitions in 2026?

Table of contents
Business Model & Company Overview
J.B. Hunt Transport Services, Inc., founded in 1961 and headquartered in Lowell, Arkansas, dominates the Integrated Freight & Logistics sector in North America. It operates as a cohesive ecosystem across five segments—Intermodal, Dedicated Contract Services, Integrated Capacity Solutions, Final Mile Services, and Truckload—delivering comprehensive surface transportation and supply chain solutions. This multi-faceted approach positions J.B. Hunt as a critical player in freight movement and logistics innovation.
The company’s revenue engine balances asset-heavy operations, like its 104K trailing equipment and 5.6K tractors, with asset-light brokerage and technology-driven logistics services. J.B. Hunt leverages its extensive fleet and digital platforms to serve customers across the Americas, Europe, and Asia. Its competitive advantage lies in scale and operational integration, creating a durable economic moat that shapes the future of freight logistics.
Financial Performance & Fundamental Metrics
I analyze J.B. Hunt Transport Services, Inc.’s income statement, key financial ratios, and dividend payout policy to reveal its core financial health and shareholder value.
Income Statement
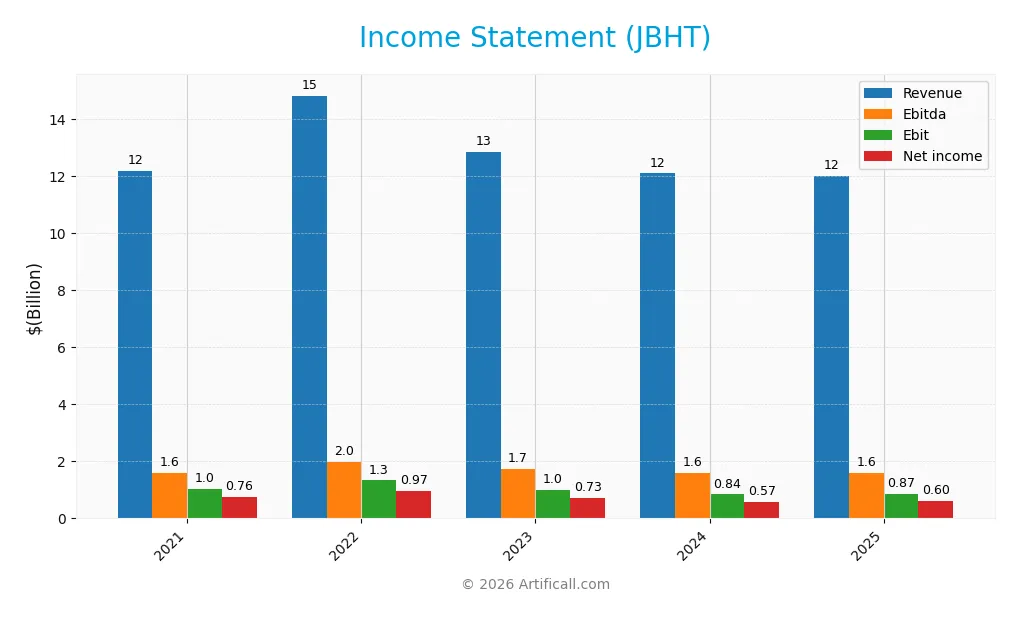
The table below summarizes J.B. Hunt Transport Services, Inc.’s key income statement figures for fiscal years 2021 through 2025, reported in USD.
| 2021 | 2022 | 2023 | 2024 | 2025 | |
|---|---|---|---|---|---|
| Revenue | 12.2B | 14.8B | 12.8B | 12.1B | 12.0B |
| Cost of Revenue | 10.3B | 12.3B | 10.6B | 10.0B | 10.7B |
| Operating Expenses | 824M | 1.1B | 1.2B | 1.2B | 397M |
| Gross Profit | 1.9B | 2.5B | 2.2B | 2.1B | 1.3B |
| EBITDA | 1.6B | 2.0B | 1.7B | 1.6B | 1.6B |
| EBIT | 1.0B | 1.3B | 1.0B | 839M | 865M |
| Interest Expense | 46M | 51M | 66M | 79M | 71M |
| Net Income | 761M | 969M | 728M | 571M | 598M |
| EPS | 7.22 | 9.31 | 7.06 | 5.60 | 6.12 |
| Filing Date | 2022-02-25 | 2023-02-24 | 2024-02-23 | 2025-02-21 | 2026-02-24 |
Income Statement Evolution
J.B. Hunt’s revenue declined slightly by 0.73% in 2025, continuing a mild downtrend over 2021-2025. Gross profit dropped sharply by nearly 39% in the last year, signaling margin pressure. EBIT grew modestly by 3.16%, while net income and margins showed mixed signals with slight improvements in net margin despite an overall negative trend since 2021.
Is the Income Statement Favorable?
In 2025, fundamentals appear neutral to unfavorable. The net margin of 4.99% is stable but low relative to historical performance. Interest expense remains favorable at 0.59% of revenue, supporting profitability. However, the significant decline in gross profit and overall net income shrinkage since 2021 highlight risks to earnings quality and margin sustainability.
Financial Ratios
The table below presents key financial ratios for J.B. Hunt Transport Services, Inc. from 2021 to 2025, offering insight into profitability, liquidity, leverage, and market valuation:
| Ratios | 2021 | 2022 | 2023 | 2024 | 2025 |
|---|---|---|---|---|---|
| Net Margin | 6.3% | 6.5% | 5.7% | 4.7% | 5.0% |
| ROE | 24.4% | 26.4% | 17.7% | 14.2% | 16.8% |
| ROIC | 14.1% | 15.4% | 10.0% | 8.4% | 9.7% |
| P/E | 28.3 | 18.7 | 28.3 | 30.5 | 31.7 |
| P/B | 6.9 | 5.0 | 5.0 | 4.3 | 5.3 |
| Current Ratio | 1.33 | 1.41 | 1.35 | 1.06 | 0.83 |
| Quick Ratio | 1.32 | 1.38 | 1.32 | 1.03 | 0.83 |
| D/E | 0.48 | 0.43 | 0.47 | 0.45 | 0.41 |
| Debt-to-Assets | 21.3% | 19.6% | 21.9% | 21.0% | 18.5% |
| Interest Coverage | 22.6 | 26.0 | 15.1 | 10.5 | 12.2 |
| Asset Turnover | 1.75 | 1.85 | 1.46 | 1.42 | 1.51 |
| Fixed Asset Turnover | 2.86 | 2.80 | 2.09 | 2.00 | 2.17 |
| Dividend Yield | 0.58% | 0.92% | 0.84% | 1.01% | 0.90% |
All ratios are calculated on a fiscal year basis.
Evolution of Financial Ratios
Return on Equity (ROE) showed an improving trend, rising from 14.2% in 2024 to 16.8% in 2025. The Current Ratio declined steadily from 1.35 in 2023 to 0.83 in 2025, signaling weaker short-term liquidity. Debt-to-Equity Ratio improved slightly, decreasing from 0.47 in 2023 to 0.41 in 2025, suggesting more prudent leverage management. Profitability margins remained fairly stable but at lower levels.
Are the Financial Ratios Fovorable?
In 2025, profitability shows mixed signals: ROE is favorable at 16.8%, but Net Margin and Dividend Yield are unfavorable at 5.0% and 0.9%, respectively. Liquidity is weak with a Current Ratio below 1, while Quick Ratio is neutral. Leverage ratios including Debt-to-Equity (0.41) and Interest Coverage (12.2) are favorable. Valuation metrics like P/E (31.7) and P/B (5.3) appear elevated, making the overall ratio profile neutral.
Shareholder Return Policy
J.B. Hunt Transport Services, Inc. maintains a consistent dividend payout ratio around 24-31%, with dividends per share rising steadily to $1.75 in 2025. The annual dividend yield hovers near 0.9-1.0%, supported by free cash flow coverage above 50%, indicating prudent capital allocation.
The company also engages in share buybacks, complementing its dividend policy. This balanced distribution approach, backed by stable profitability and cash flow, appears aligned with sustainable long-term shareholder value creation while managing payout risks.
Score analysis
The following radar chart illustrates J.B. Hunt Transport Services, Inc.’s key financial scores across multiple valuation and profitability metrics:
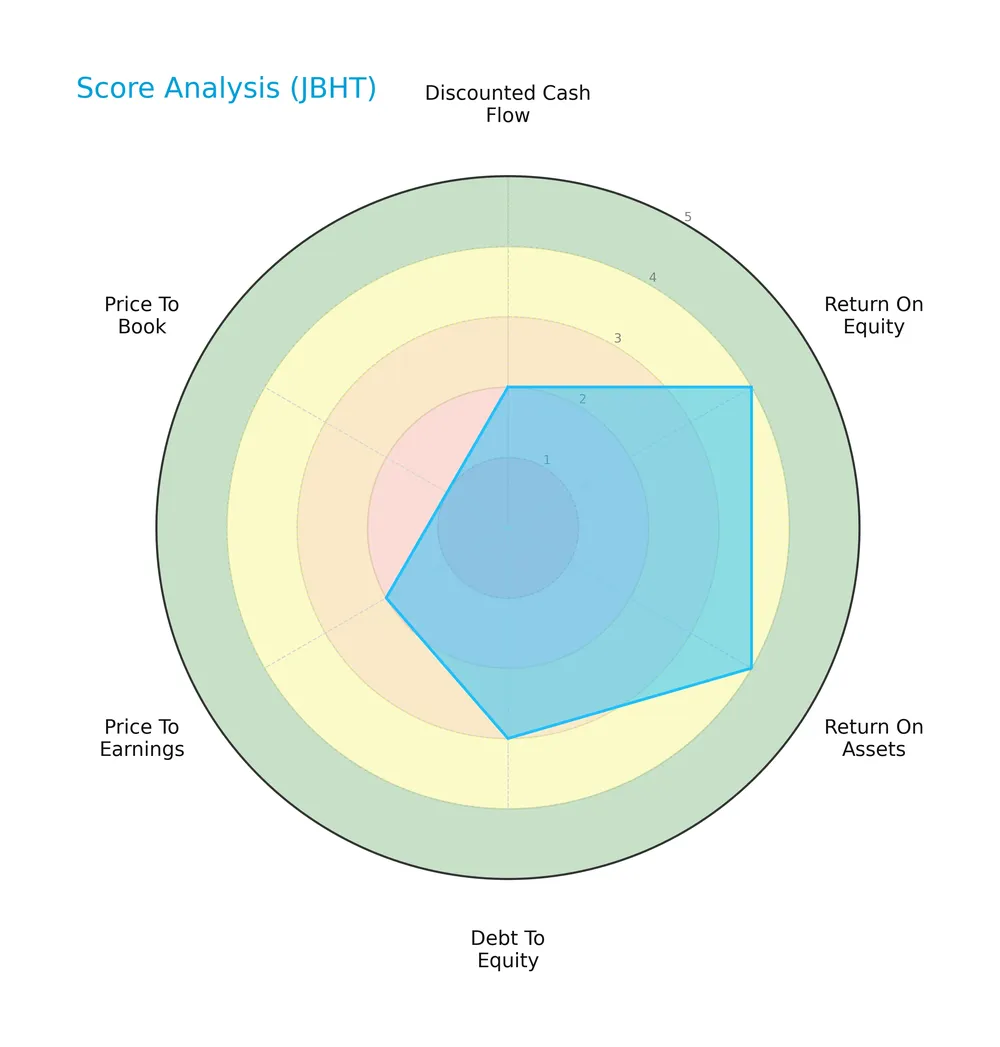
The company shows strong returns with favorable scores of 4 in ROE and ROA. Debt-to-equity is moderate at 3, while valuation metrics lag, with unfavorable scores of 2 for both DCF and P/E, and a very unfavorable 1 for P/B.
Analysis of the company’s bankruptcy risk
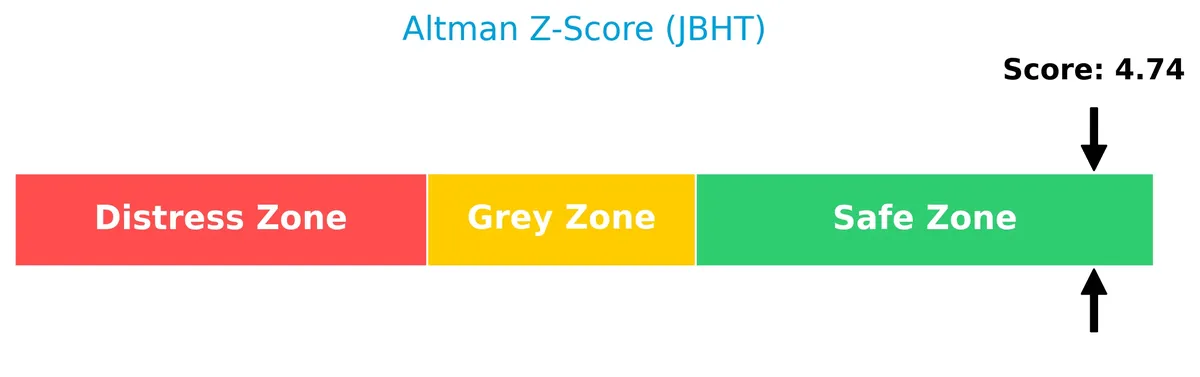
J.B. Hunt Transport Services, Inc. is positioned in the safe zone according to its Altman Z-Score, indicating a very low risk of bankruptcy:
Is the company in good financial health?
The Piotroski Score diagram below highlights the company’s financial strength and operational efficiency:

With a strong Piotroski Score of 7, the company demonstrates solid financial health, suggesting robust profitability, efficient asset use, and prudent leverage management.
Competitive Landscape & Sector Positioning
This section examines J.B. Hunt Transport Services, Inc.’s strategic positioning and revenue streams by segment. I will evaluate whether the company holds a competitive advantage over its main competitors.
Strategic Positioning
J.B. Hunt Transport Services, Inc. diversifies across five key segments: Intermodal, Dedicated Contract Services, Integrated Capacity Solutions, Final Mile Services, and Truckload. It focuses exclusively on North America, maintaining a broad product portfolio within integrated freight and logistics.
Revenue by Segment
This pie chart illustrates J.B. Hunt Transport Services, Inc.’s revenue breakdown for fiscal year 2025, highlighting the contributions of fuel surcharge and service excluding fuel surcharge segments.
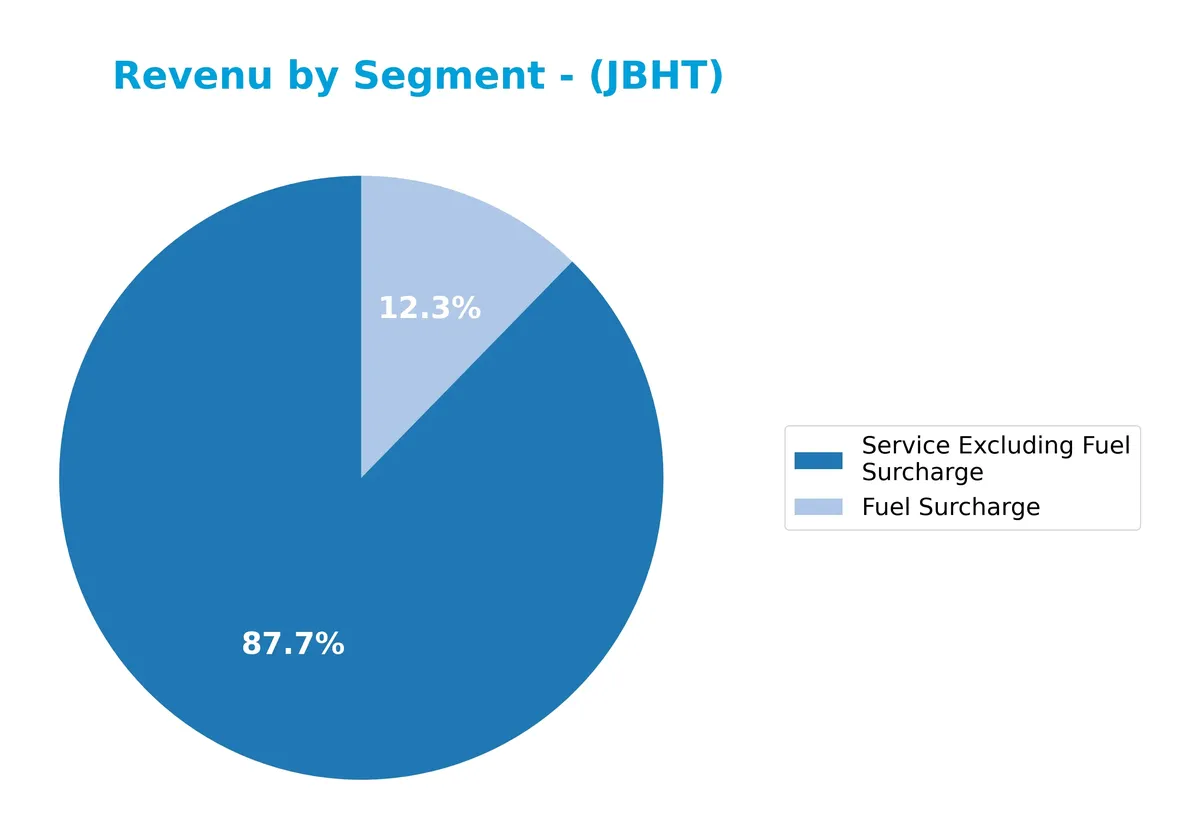
In 2025, service excluding fuel surcharge dominates with $10.5B, reflecting core operational strength. Fuel surcharge, at $1.48B, plays a smaller but notable role. Compared to prior years, service revenue slightly contracted from $10.98B in 2023, while fuel surcharge declined more sharply, signaling reduced pricing pressure or improved fuel efficiency. The business remains concentrated in service revenue, underscoring reliance on freight operations amid evolving cost dynamics.
Key Products & Brands
J.B. Hunt’s core business segments and service offerings include the following:
| Product | Description |
|---|---|
| Intermodal (JBI) | Intermodal freight solutions using company-owned trailers, tractors, and chassis fleets. |
| Dedicated Contract Services (DCS) | Customized supply chain and transportation solutions with company and customer trucks and trailers. |
| Integrated Capacity Solutions (ICS) | Freight brokerage and logistics services, including flatbed, refrigerated, expedited, and less-than-truckload. |
| Final Mile Services (FMS) | Delivery services with a fleet of company, customer, and contractor trucks and trailers. |
| Truckload (JBT) | Dry-van freight transport over roads using company tractors and trailers. |
| Fuel Surcharge | Additional charges passed on to customers to offset fluctuating fuel costs. |
| Service Excluding Fuel Surcharge | Revenue from transportation and logistics services before fuel-related fees. |
J.B. Hunt operates a diverse portfolio of freight and logistics services. Its segments blend asset-heavy intermodal and dedicated fleets with asset-light brokerage and final mile delivery, reflecting a broad integrated freight strategy.
Main Competitors
There are 5 main competitors in the Integrated Freight & Logistics industry; below are the top 5 leaders by market capitalization:
| Competitor | Market Cap. |
|---|---|
| United Parcel Service, Inc. | 85.7B |
| FedEx Corporation | 69.2B |
| Expeditors International of Washington, Inc. | 20.8B |
| C.H. Robinson Worldwide, Inc. | 19.3B |
| J.B. Hunt Transport Services, Inc. | 18.7B |
J.B. Hunt ranks 5th among its competitors with a market cap about 25% of the leader, UPS. The company sits below the average market cap of the top 10 peers (43B) but remains above the sector median (20.8B). Its market cap is roughly 9% below the next closest rival, C.H. Robinson, indicating a modest gap in scale.
Comparisons with competitors
Check out how we compare the company to its competitors:
Does JBHT have a competitive advantage?
J.B. Hunt Transport Services, Inc. currently lacks a clear competitive advantage. Its ROIC remains below WACC, indicating value erosion and declining profitability from 2021 to 2025.
Future opportunities include expanding integrated freight services and logistics solutions across North America. The company’s diverse segments position it to capture growth in evolving transportation markets.
SWOT Analysis
This analysis highlights J.B. Hunt Transport Services’ core strategic factors to guide investment decisions.
Strengths
- strong ROE at 16.78%
- diversified service segments
- robust asset turnover of 1.51
Weaknesses
- declining ROIC trend
- unfavorable revenue growth
- low current ratio at 0.83
Opportunities
- expanding integrated logistics market
- digital freight brokerage growth
- potential for margin improvement
Threats
- intense competition in freight sector
- economic cycles impact demand
- rising fuel and labor costs
J.B. Hunt shows operational strengths but faces pressure from declining profitability and liquidity constraints. The company must leverage digital innovation and scale to counter competitive and macroeconomic risks.
Stock Price Action Analysis
The weekly stock chart for J.B. Hunt Transport Services, Inc. (JBHT) illustrates price movements and volatility patterns over the past year:
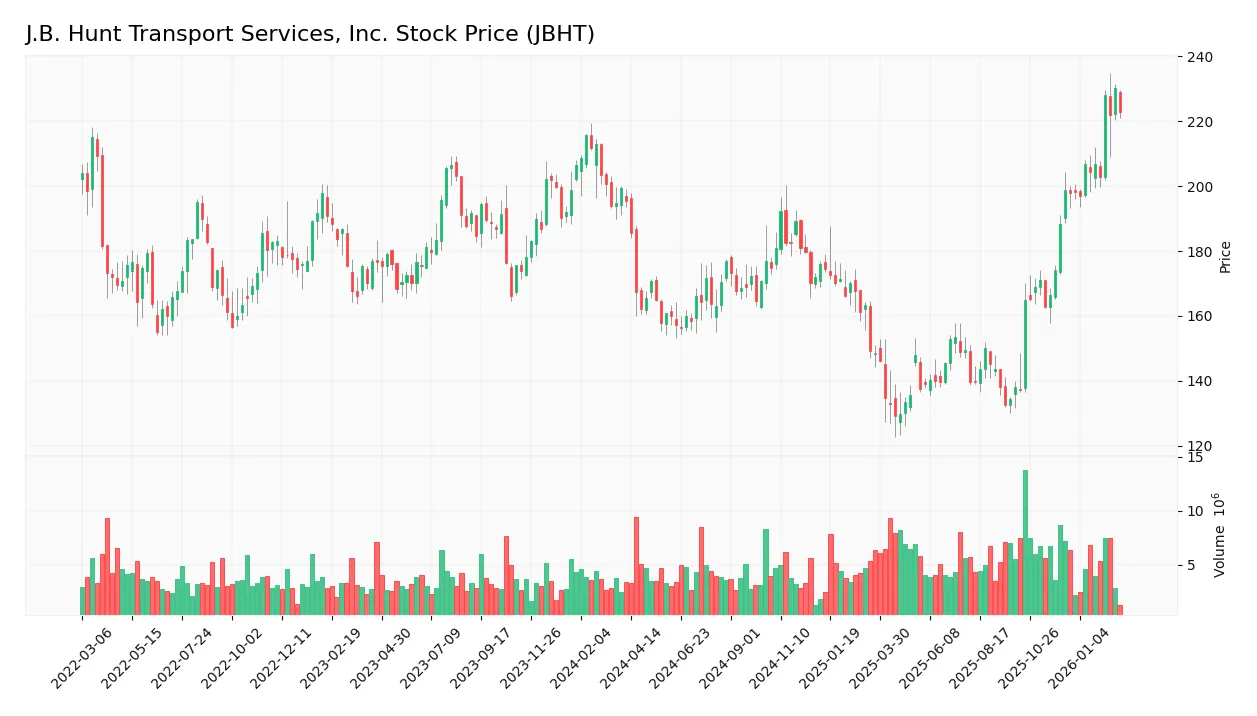
Trend Analysis
Over the past 12 months, JBHT’s stock price rose 14.11%, signaling a bullish trend with clear acceleration. The price moved from a low of 129.23 to a high of 230.16. Volatility remains elevated, with a standard deviation of 22.51, reflecting significant price swings.
Volume Analysis
Trading volume shows an increasing trend, with nearly equal buyer (50.11%) and seller (49.89%) participation overall. Recent data indicate a slight seller dominance (51.28%) and neutral buyer behavior, suggesting balanced investor sentiment with no clear directional conviction.
Target Prices
Analysts foresee a solid valuation range for J.B. Hunt Transport Services, Inc.
| Target Low | Target High | Consensus |
|---|---|---|
| 150 | 245 | 198.82 |
The target prices suggest moderate upside potential, reflecting confidence in JBHT’s growth and operational efficiency.

Don’t Let Luck Decide Your Entry Point
Optimize your entry points with our advanced ProRealTime indicators. You’ll get efficient buy signals with precise price targets for maximum performance. Start outperforming now!
Analyst & Consumer Opinions
This section examines J.B. Hunt Transport Services, Inc.’s analyst ratings and consumer feedback to reveal market sentiment.
Stock Grades
Here is a summary of the latest verified analyst grades for J.B. Hunt Transport Services, Inc., reflecting current market sentiment:
| Grading Company | Action | New Grade | Date |
|---|---|---|---|
| Benchmark | Maintain | Buy | 2026-01-20 |
| Stifel | Maintain | Hold | 2026-01-16 |
| UBS | Maintain | Neutral | 2026-01-16 |
| Barclays | Maintain | Equal Weight | 2026-01-15 |
| Truist Securities | Maintain | Hold | 2026-01-15 |
| Stifel | Maintain | Hold | 2026-01-14 |
| Evercore ISI Group | Maintain | Outperform | 2026-01-13 |
| JP Morgan | Maintain | Overweight | 2026-01-12 |
| Bernstein | Maintain | Market Perform | 2026-01-09 |
| Benchmark | Maintain | Buy | 2026-01-08 |
The grades show a broad consensus around “Hold” to “Buy,” with no recent downgrades or upgrades. This steady pattern reflects cautious optimism among analysts about JBHT’s near-term prospects.
Consumer Opinions
J.B. Hunt Transport Services, Inc. earns mixed but insightful feedback from its customers, reflecting its operational strengths and areas for improvement.
| Positive Reviews | Negative Reviews |
|---|---|
| Reliable delivery schedules and timely shipments impress clients consistently. | Some customers report occasional delays during peak seasons. |
| Customer service is praised for responsiveness and problem-solving. | Pricing can be higher compared to competitors in certain regions. |
| Technology integration, like tracking systems, enhances transparency. | A few complaints about communication lapses in complex logistics cases. |
Overall, consumers appreciate J.B. Hunt’s reliability and tech-forward approach. However, pricing pressures and sporadic delays during high demand pose challenges that management must address to sustain loyalty.
Risk Analysis
The table below outlines key risks for J.B. Hunt Transport Services, Inc., focusing on likelihood and potential impact:
| Category | Description | Probability | Impact |
|---|---|---|---|
| Valuation Risk | High P/E (31.7) and P/B (5.33) ratios indicate potential overvaluation | Medium | High |
| Liquidity Risk | Current ratio of 0.83 signals weak short-term liquidity | Medium | Medium |
| Market Volatility | Beta of 1.263 suggests above-average sensitivity to market swings | High | Medium |
| Operational Risk | Heavy asset base and fleet maintenance costs could pressure margins | Medium | Medium |
| Dividend Risk | Low dividend yield (0.9%) may disappoint income-focused investors | Low | Low |
| Credit Risk | Favorable debt metrics and strong interest coverage reduce default risk | Low | Low |
J.B. Hunt’s most significant risks stem from valuation and liquidity. Despite a safe Altman Z-score (4.74) indicating low bankruptcy risk, the stock trades at premium multiples, raising caution. The current ratio below 1 is a red flag for near-term obligations. Market volatility remains elevated with a beta above 1.2, signaling sensitivity to economic cycles.
Should You Buy J.B. Hunt Transport Services, Inc.?
J.B. Hunt appears to have improving profitability but a slightly unfavorable moat due to declining ROIC versus WACC, suggesting value erosion. Its leverage profile seems manageable. The overall B rating indicates a very favorable but cautiously moderate investment profile.
Strength & Efficiency Pillars
J.B. Hunt Transport Services, Inc. demonstrates solid profitability with a return on equity of 16.78%, reflecting effective shareholder value generation. Its interest expense ratio of 0.59% signals prudent cost control. Despite a modest net margin of 4.99%, the company operates within a safe Altman Z-Score zone (4.74), underscoring financial stability. However, the ROIC of 9.74% slightly trails the WACC of 9.2%, indicating the firm currently does not create economic value, a slight operational concern amid otherwise stable metrics.
Weaknesses and Drawbacks
Valuation metrics raise red flags; the price-to-earnings ratio at 31.73 and price-to-book at 5.33 suggest a premium market valuation, which may limit upside. The current ratio at 0.83 signals potential liquidity constraints, raising short-term solvency concerns. While the debt-to-equity ratio is moderate at 0.41, the unfavorable liquidity position could pressure financial flexibility. Recent seller dominance (51.28%) and a net income decline over the past five years (-21.36%) add to market caution and highlight operational challenges.
Our Final Verdict about J.B. Hunt Transport Services, Inc.
J.B. Hunt presents a fundamentally stable profile with a safe Altman Z-Score and strong Piotroski score (7), reflecting financial resilience. Despite a bullish long-term trend, recent seller dominance suggests a wait-and-see approach for a better entry point. The elevated valuation multiples and liquidity concerns weigh on near-term prospects. Overall, the stock might appear attractive for patient investors but carries cautionary signals that warrant close monitoring.
Disclaimer: This content is for informational purposes only and does not constitute financial, investment, or other professional advice. Investing in financial markets involves a significant risk of loss, and past performance is not indicative of future results.
Additional Resources
- Decoding JB Hunt Transport Services Inc (JBHT): A Strategic SWOT Insight – GuruFocus (Feb 25, 2026)
- J.B. Hunt (NASDAQ: JBHT) posts $12.0B 2025 revenue, buybacks and higher dividend – Stock Titan (Feb 24, 2026)
- HUNT J B TRANSPORT SERVICES INC SEC 10-K Report – TradingView (Feb 24, 2026)
- A Look At J.B. Hunt Transport Services (JBHT) Valuation After Mixed Earnings And EPS Growth Expectations – simplywall.st (Feb 23, 2026)
- Aberdeen Group plc Lowers Stake in J.B. Hunt Transport Services, Inc. $JBHT – MarketBeat (Feb 21, 2026)
For more information about J.B. Hunt Transport Services, Inc., please visit the official website: jbhunt.com