Home > Analyses > Energy > IsoEnergy Ltd.
IsoEnergy Ltd. is redefining the future of energy by advancing uranium exploration in Canada’s prolific Athabasca Basin, a region critical for nuclear fuel supply. As a nimble yet influential player in the uranium sector, IsoEnergy combines strategic property acquisitions with cutting-edge development techniques, underpinned by its reputation for operational precision and market insight. With global energy demand evolving, I explore whether IsoEnergy’s current fundamentals justify its promising growth outlook and market valuation.
Table of contents
Business Model & Company Overview
IsoEnergy Ltd., founded in 2016 and headquartered in Saskatoon, Canada, operates as a focused player in the uranium sector. It builds a cohesive ecosystem through its strategic ownership and exploration of key uranium mineral properties within the Athabasca Basin, including Larocque East and Collins Bay Extension. As a subsidiary of NexGen Energy Ltd., IsoEnergy integrates exploration and development efforts to reinforce its standing in the energy industry.
The company generates value primarily from its uranium mineral assets, emphasizing exploration and development over hardware or software products. Its operations, while concentrated in Canada, position it strategically within the global energy resource landscape. IsoEnergy’s competitive advantage lies in its control over high-potential uranium properties, underpinning its role in shaping the future of nuclear energy resource development.
Financial Performance & Fundamental Metrics
In this section, I analyze IsoEnergy Ltd.’s income statement, key financial ratios, and dividend payout policy to evaluate its financial health and investment potential.
Income Statement
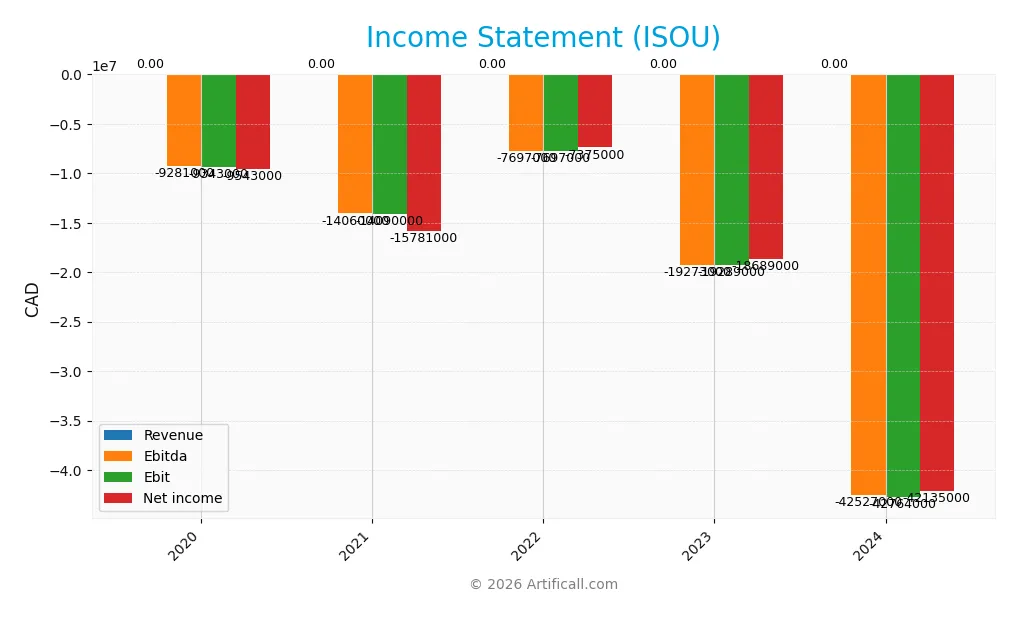
The table below presents IsoEnergy Ltd.’s income statement summary for the fiscal years 2020 through 2024, in CAD.
| 2020 | 2021 | 2022 | 2023 | 2024 | |
|---|---|---|---|---|---|
| Revenue | 0 | 0 | 0 | 0 | 0 |
| Cost of Revenue | 62K | 29K | 0 | 0 | 0 |
| Operating Expenses | 9.5M | 14.7M | 8.4M | 20.5M | 44.1M |
| Gross Profit | -62K | -29K | 0 | 0 | 0 |
| EBITDA | -9.3M | -14.1M | -7.7M | -19.3M | -42.5M |
| EBIT | -9.3M | -14.1M | -7.7M | -19.3M | -42.8M |
| Interest Expense | 258K | 647K | 702K | 1.2M | 1.4M |
| Net Income | -9.5M | -15.8M | -7.4M | -18.7M | -42.1M |
| EPS | -0.56 | -0.82 | -0.38 | -0.85 | -1.38 |
| Filing Date | 2020-12-31 | 2021-12-31 | 2022-12-31 | 2023-12-31 | 2024-12-31 |
Income Statement Evolution
IsoEnergy Ltd. recorded zero revenue consistently from 2020 to 2024, with net income steadily worsening from -9.5M CAD in 2020 to -42.1M CAD in 2024. Operating expenses increased sharply, notably general and administrative costs more than doubling in 2024. Margins remained unfavorable throughout, with no gross profit and a deteriorating EBIT margin reflecting sustained operational losses.
Is the Income Statement Favorable?
The 2024 income statement reveals significant challenges: net income declined by over 340% compared to 2020, EPS dropped to -1.38 CAD, and operating losses doubled year-over-year. Despite a slight positive in net interest income, the company’s overall fundamentals appear unfavorable, with high administrative expenses and no revenue generation. The income statement’s risk profile remains elevated, as reflected in the predominantly negative margin and growth evaluations.
Financial Ratios
The table below presents key financial ratios for IsoEnergy Ltd. (ticker: ISOU) over the fiscal years 2020 to 2024, reflecting the company’s performance and financial health dynamics:
| Ratios | 2020 | 2021 | 2022 | 2023 | 2024 |
|---|---|---|---|---|---|
| Net Margin | 0 | 0 | 0 | 0 | 0 |
| ROE | -18% | -28% | -11% | -6% | -14% |
| ROIC | -14% | -18% | -8% | -5% | -12% |
| P/E | -18.5 | -12.5 | -31.2 | -13.0 | -9.6 |
| P/B | 3.32 | 3.53 | 3.47 | 0.80 | 1.34 |
| Current Ratio | 46.8 | 36.1 | 0.86 | 1.35 | 1.70 |
| Quick Ratio | 46.8 | 36.1 | 0.86 | 1.35 | 1.70 |
| D/E | 0.27 | 0.45 | 0.83 | 0.25 | 0.10 |
| Debt-to-Assets | 21% | 30% | 56% | 22% | 9% |
| Interest Coverage | -37 | -23 | -12 | -17 | -32 |
| Asset Turnover | 0 | 0 | 0 | 0 | 0 |
| Fixed Asset Turnover | 0 | 0 | 0 | 0 | 0 |
| Dividend Yield | 0 | 0 | 0 | 0 | 0 |
Evolution of Financial Ratios
IsoEnergy Ltd. saw its Return on Equity (ROE) remain negative, moving from -18.0% in 2020 to -13.9% in 2024, indicating persistent unprofitability but with some improvement. The Current Ratio improved notably from a high of 46.8 in 2020 to a more moderate 1.7 in 2024, reflecting enhanced liquidity management. The Debt-to-Equity Ratio declined from 0.45 in 2020 to 0.10 in 2024, signaling a reduction in leverage and a more conservative capital structure.
Are the Financial Ratios Favorable?
In 2024, IsoEnergy’s liquidity ratios, including Current and Quick Ratios at 1.7, are favorable, indicating solid short-term financial health. Leverage metrics such as Debt-to-Equity (0.1) and Debt-to-Assets (9.0%) also appear favorable, suggesting low financial risk. However, profitability ratios like ROE (-13.9%) and Net Margin (0%) are unfavorable, reflecting ongoing losses. Market valuation ratios Price-to-Earnings (-9.64) and Price-to-Book (1.34) are favorable, while coverage and efficiency ratios remain unfavorable, resulting in a slightly unfavorable overall financial ratio profile.
Shareholder Return Policy
IsoEnergy Ltd. does not pay dividends, reflecting its consistent net losses and negative free cash flow per share from 2020 to 2024. The company likely prioritizes reinvestment and operational expenses over distributions, with no evidence of share buyback programs during this period.
This approach aligns with a growth or development phase, focusing on long-term value creation rather than immediate shareholder returns. The lack of dividends and buybacks supports a cautious stance on capital allocation, appropriate given ongoing losses and cash flow challenges.
Score analysis
The following radar chart presents the evaluation of key financial scores for IsoEnergy Ltd.:
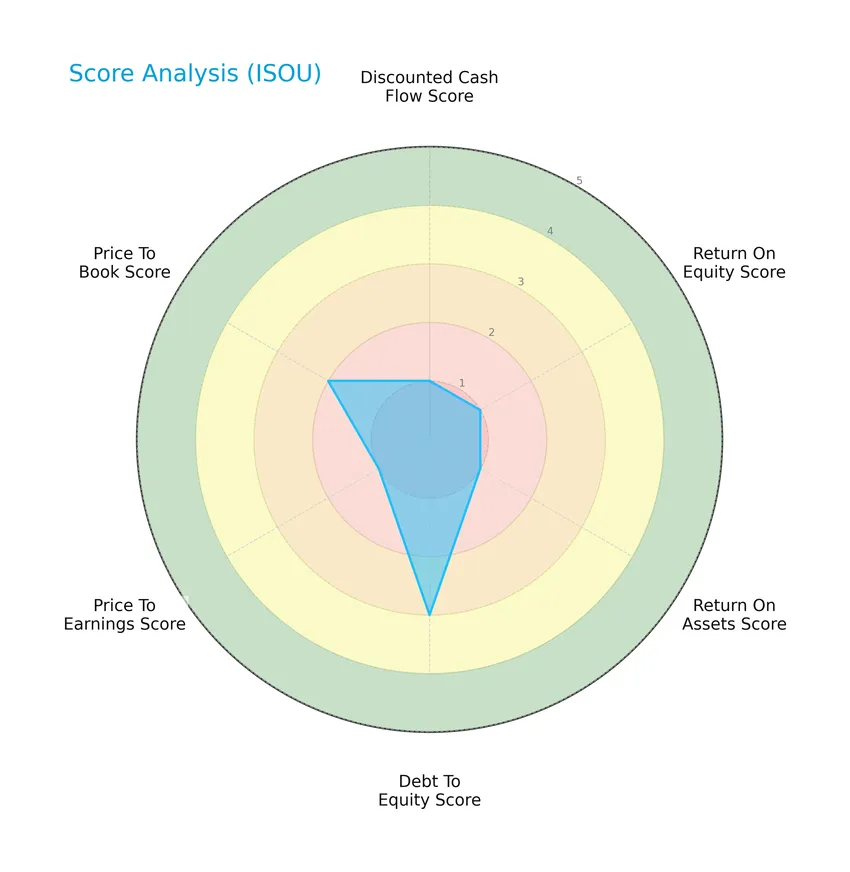
IsoEnergy Ltd. shows predominantly very unfavorable scores with low ratings in discounted cash flow, return on equity, return on assets, and price-to-earnings metrics. Debt-to-equity and price-to-book scores are moderate, indicating some balance in leverage and valuation ratios.
Analysis of the company’s bankruptcy risk
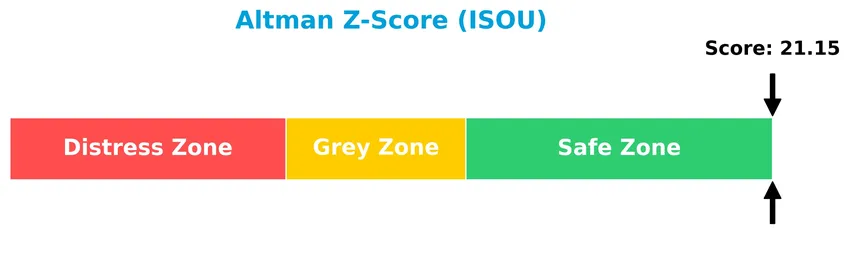
The Altman Z-Score places IsoEnergy Ltd. firmly in the safe zone, indicating a low likelihood of bankruptcy risk according to its financial ratios:
Is the company in good financial health?
The Piotroski Score diagram illustrates the company’s financial health based on nine key criteria:

With a Piotroski Score of 2, IsoEnergy Ltd. is classified as very weak in financial health, suggesting challenges in profitability, leverage, liquidity, or operational efficiency that investors should carefully consider.
Competitive Landscape & Sector Positioning
This analysis will examine IsoEnergy Ltd.’s strategic positioning, revenue by segment, key products, main competitors, and competitive advantages. I will also assess the company’s strengths, weaknesses, opportunities, and threats. The goal is to determine whether IsoEnergy holds a competitive advantage over its industry peers.
Strategic Positioning
IsoEnergy Ltd. focuses on uranium exploration and development with a geographically concentrated portfolio primarily in the Athabasca Basin, Saskatchewan, Canada. The company holds multiple property interests but remains specialized within the uranium industry, reflecting a concentrated strategic positioning in both product and geography.
Key Products & Brands
The following table outlines IsoEnergy Ltd.’s key products and brand interests in uranium mineral properties:
| Product | Description |
|---|---|
| Larocque East Property | Uranium mineral property located in the Athabasca Basin of Saskatchewan, Canada. |
| Geiger Property | Uranium exploration site in the Athabasca Basin region. |
| Thorburn Lake Property | Uranium mineral property held by IsoEnergy in Saskatchewan’s Athabasca Basin. |
| Radio Property | Uranium development and exploration site in the Athabasca Basin. |
| Hawk Property | Uranium mineral interest in the Athabasca Basin area. |
| Ranger Property | Uranium exploration property within the Athabasca Basin. |
| Collins Bay Extension | Additional uranium mineral rights adjacent to Collins Bay in the Athabasca Basin. |
IsoEnergy Ltd. focuses on acquiring, developing, and exploring uranium mineral properties primarily within the Athabasca Basin, holding significant interests across multiple sites in Saskatchewan, Canada.
Main Competitors
IsoEnergy Ltd. operates among a total of 10 competitors in the uranium industry, with the table below listing the top 10 leaders by market capitalization:
| Competitor | Market Cap. |
|---|---|
| Cameco Corporation | 39.8B |
| NexGen Energy Ltd. | 6.0B |
| Uranium Energy Corp. | 5.6B |
| Centrus Energy Corp. | 4.2B |
| Energy Fuels Inc. | 3.5B |
| Denison Mines Corp. | 2.4B |
| Ur-Energy Inc. | 507M |
| IsoEnergy Ltd. | 499M |
| Uranium Royalty Corp. | 471M |
| enCore Energy Corp. | 464M |
IsoEnergy Ltd. ranks 8th among its peers, holding approximately 1.65% of the market cap of the leading competitor, Cameco Corporation. The company is positioned below both the average market capitalization of the top 10 (6.35B) and the median market cap in the sector (2.92B). It maintains a 23.05% market cap gap to the next competitor above, indicating a moderate distance from its closest rival.
Does IsoEnergy Ltd. have a competitive advantage?
IsoEnergy Ltd. currently does not present a strong competitive advantage, as it is shedding value with a ROIC significantly below its WACC, indicating inefficient capital use and value destruction. Despite this, the company shows a growing ROIC trend, suggesting some improvement in profitability over recent years.
Looking ahead, IsoEnergy’s focus on uranium mineral properties in the Athabasca Basin positions it in a specialized market with potential opportunities for expansion and development. Its portfolio includes several properties, which may support future growth as uranium demand evolves, though current financial performance remains unfavorable.
Comparisons with competitors
Check out how we compare the company to its competitors:
SWOT Analysis
This SWOT analysis highlights the key internal and external factors affecting IsoEnergy Ltd. to guide strategic investment decisions.
Strengths
- strong asset base in Athabasca Basin
- favorable debt ratios
- recent IPO provides capital access
Weaknesses
- negative profitability margins
- zero revenue growth
- very weak Piotroski score
Opportunities
- uranium demand recovery
- strategic location in uranium-rich region
- potential for exploration success
Threats
- uranium price volatility
- regulatory risks in mining
- competitive industry pressures
IsoEnergy shows solid asset positioning and financial leverage but struggles with profitability and growth. Its strategic uranium assets offer upside if market conditions improve. Investors should weigh exploration potential against sector risks and current financial weaknesses.
Stock Price Action Analysis
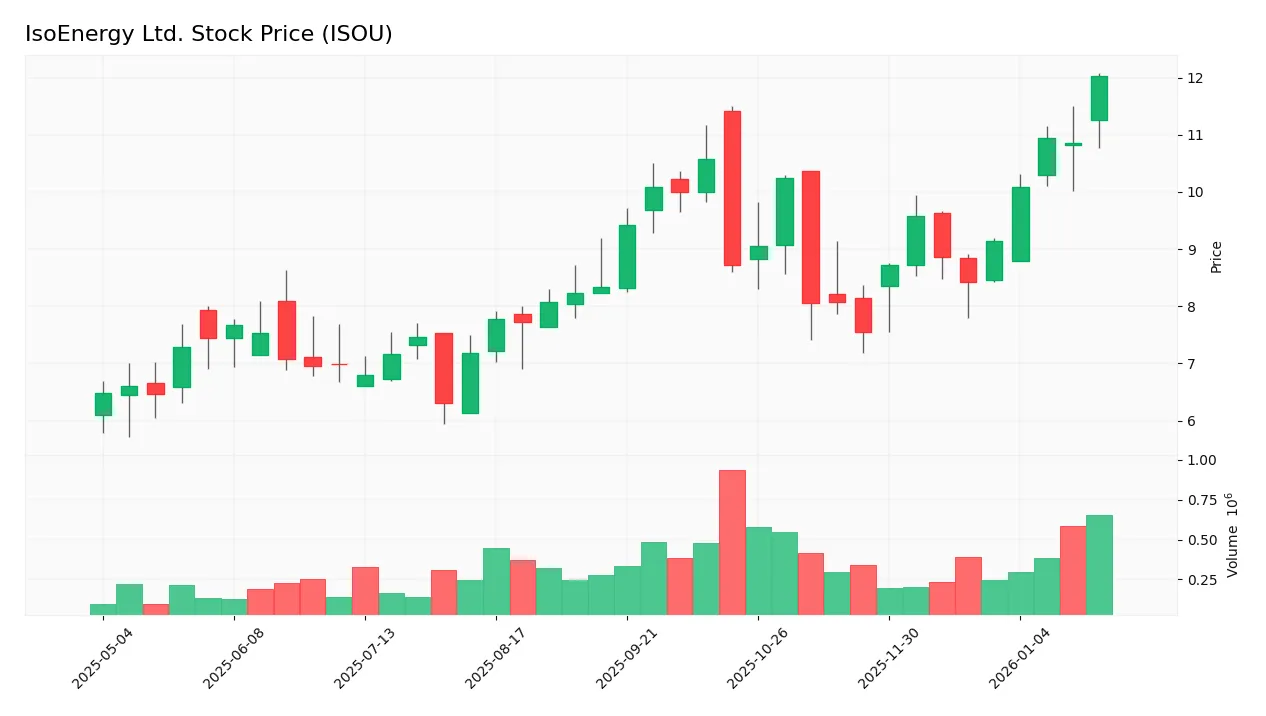
The following weekly stock chart illustrates IsoEnergy Ltd.’s price movements over the past 12 months, highlighting key fluctuations and trend developments:
Trend Analysis
Over the past 12 months, IsoEnergy Ltd. stock price increased by 85.36%, indicating a bullish trend. The stock showed acceleration with a high volatility level of 1.42 standard deviation. The price ranged between a low of 6.31 and a high of 12.03, confirming strong upward momentum throughout the period.
Volume Analysis
Over the last three months, trading volume has been increasing and is slightly buyer-dominant with buyers accounting for 53.81%. This suggests growing investor participation and a cautiously optimistic market sentiment, reflecting moderate confidence in the stock’s continued upward trend.
Target Prices
No verified target price data is available from recognized analysts for IsoEnergy Ltd. The stock’s market sentiment appears neutral to cautiously optimistic based on recent trading activity.
Analyst & Consumer Opinions
This section examines the recent grades and consumer feedback related to IsoEnergy Ltd. (ISOU).

Don’t Let Luck Decide Your Entry Point
Optimize your entry points with our advanced ProRealTime indicators. You’ll get efficient buy signals with precise price targets for maximum performance. Start outperforming now!
Stock Grades
No verified stock grades were available from recognized analysts for IsoEnergy Ltd. The absence of official ratings limits insights into current market consensus or investor sentiment regarding this stock.
Consumer Opinions
Consumers have mixed feelings about IsoEnergy Ltd., reflecting both appreciation for its innovative approach and concerns about operational challenges.
| Positive Reviews | Negative Reviews |
|---|---|
| “IsoEnergy’s commitment to sustainable energy is impressive and aligns well with future market trends.” | “The company’s project delays have caused some uncertainty among investors.” |
| “Strong potential for growth given their resource base and exploration success.” | “Communication from management could be more transparent and timely.” |
| “IsoEnergy’s environmental responsibility efforts stand out in the uranium sector.” | “Stock volatility has been high, making it risky for conservative investors.” |
Overall, consumers praise IsoEnergy for its sustainable practices and growth potential but express concerns about project delays, communication issues, and stock volatility. Balancing these factors is key for investors considering this stock.
Risk Analysis
Below is a summary table of the key risks associated with investing in IsoEnergy Ltd., highlighting their likelihood and potential impact:
| Category | Description | Probability | Impact |
|---|---|---|---|
| Financial Health | Negative profitability metrics including negative ROE (-13.9%) and negative ROIC (-12.5%). | High | High |
| Liquidity Risk | Current and quick ratios are favorable (1.7), but interest coverage is heavily negative (-31.1). | Medium | Medium |
| Market Volatility | Beta near 1 (0.955) implies stock price moves closely with the market, exposing investors to volatility. | Medium | Medium |
| Operational Risk | Zero asset turnover and fixed asset turnover indicate low operational efficiency. | High | Medium |
| Dividend Policy | No dividends paid, limiting income for dividend-focused investors. | High | Low |
| Investment Score | Very weak Piotroski score (2) suggests poor financial strength; Altman Z-score in safe zone (21.1) indicates low bankruptcy risk. | Mixed | Mixed |
The most significant risks for IsoEnergy are its continuing negative profitability and poor operational efficiency, which could constrain growth and shareholder returns despite a strong bankruptcy safety margin. Investors should also be cautious given the weak financial strength score and absence of dividend yield.
Should You Buy IsoEnergy Ltd.?
IsoEnergy Ltd. appears to be in a very favorable rating position despite a profile of weak profitability and a slightly unfavorable moat marked by value destruction yet improving returns. Supported by a manageable leverage profile and a strong Altman Z-Score suggesting financial stability, the company could be seen as a cautious value creation opportunity.
Strength & Efficiency Pillars
IsoEnergy Ltd. exhibits solid financial health, underscored by an Altman Z-Score of 21.15, placing it well within the safe zone and signaling low bankruptcy risk. The company maintains a conservative debt profile, with a debt-to-equity ratio of 0.1 and a current ratio of 1.7, both favorable indicators of liquidity and leverage management. While profitability metrics such as ROE (-13.9%) and ROIC (-12.5%) are negative, IsoEnergy benefits from a stable price-to-earnings ratio (-9.64) and a modest price-to-book ratio (1.34), reflecting reasonable market valuation parameters. Despite negative returns on invested capital compared to a WACC of 8.19%, the company’s financial structure supports operational resilience.
Weaknesses and Drawbacks
The primary weaknesses lie in IsoEnergy’s profitability and operational efficiency. With net margin at 0% and EBIT margin also at 0%, the firm struggles to generate earnings, a situation compounded by a steep 76.47% decline in EPS over the past year and a 341.53% drop in net income overall. Interest coverage is deeply negative at -31.1, signaling potential difficulties servicing debt despite low leverage. The Piotroski score of 2 reflects a very weak financial strength, further raising concerns about fundamental robustness. Market-wise, while the valuation appears moderate, the lack of dividend yield and unfavorable asset turnover ratios highlight operational inefficiencies.
Our Verdict about IsoEnergy Ltd.
IsoEnergy Ltd.’s long-term fundamental profile may appear unfavorable due to persistent profitability challenges and weak earnings growth. However, the bullish overall stock trend combined with a slightly buyer-dominant recent period suggests potential momentum that could attract investors seeking entry points. Despite its financial headwinds, the company’s sound liquidity and low leverage may offer some cushion. Therefore, the profile might suggest a cautious, wait-and-see approach while monitoring for improvements in profitability and operational performance.
Disclaimer: This content is for informational purposes only and does not constitute financial, investment, or other professional advice. Investing in financial markets involves a significant risk of loss, and past performance is not indicative of future results.
Additional Resources
- IsoEnergy (ISOU) Secures C$50 Million in Bought Deal Financing – GuruFocus (Jan 20, 2026)
- IsoEnergy Acquires Additional Securities in Premier American Uranium Inc. – PR Newswire (Dec 30, 2025)
- IsoEnergy Commences 2026 Winter Drilling Program at the Larocque East Project, Athabasca Basin – Sahm (Jan 20, 2026)
- Here is Why IsoEnergy Ltd. (ISOU) Gained This Week – Yahoo Finance (Oct 12, 2025)
- IsoEnergy (ISOU) gains following successful drill programs in Athabasca region – MSN (Jan 08, 2026)
For more information about IsoEnergy Ltd., please visit the official website: isoenergy.ca