Home > Analyses > Real Estate > Iron Mountain Incorporated
Iron Mountain safeguards the digital and physical lifeblood of over 225,000 organizations worldwide. With a sprawling network of 1,450 facilities and 90M square feet of specialized real estate, it dominates the secure storage and information management space. Its offerings span from records storage to cloud services, enabling clients to reduce risk, cut costs, and embrace digital transformation. As data demands surge, I ask: does Iron Mountain’s robust foundation still justify its premium valuation and growth prospects?

Table of contents
Business Model & Company Overview
Iron Mountain Incorporated, founded in 1951 and headquartered in Boston, MA, stands as the global leader in storage and information management services. Its ecosystem spans secure records storage, digital transformation, and art logistics, supporting over 225,000 organizations worldwide. The company leverages a vast real estate network of 90M square feet across 1,450 facilities in roughly 50 countries, safeguarding critical business information, sensitive data, and cultural artifacts with precision and reliability.
The company’s revenue engine blends physical storage, secure destruction, data centers, and cloud services, creating a diversified and recurring income stream. Iron Mountain’s strategic footprint spans the Americas, Europe, and Asia, enabling it to meet regulatory and disaster recovery needs globally. This competitive advantage solidifies its economic moat, positioning Iron Mountain as a pivotal force shaping the future of information management.
Financial Performance & Fundamental Metrics
I analyze Iron Mountain Incorporated’s income statement, key financial ratios, and dividend payout policy to assess its operational efficiency and shareholder returns.
Income Statement
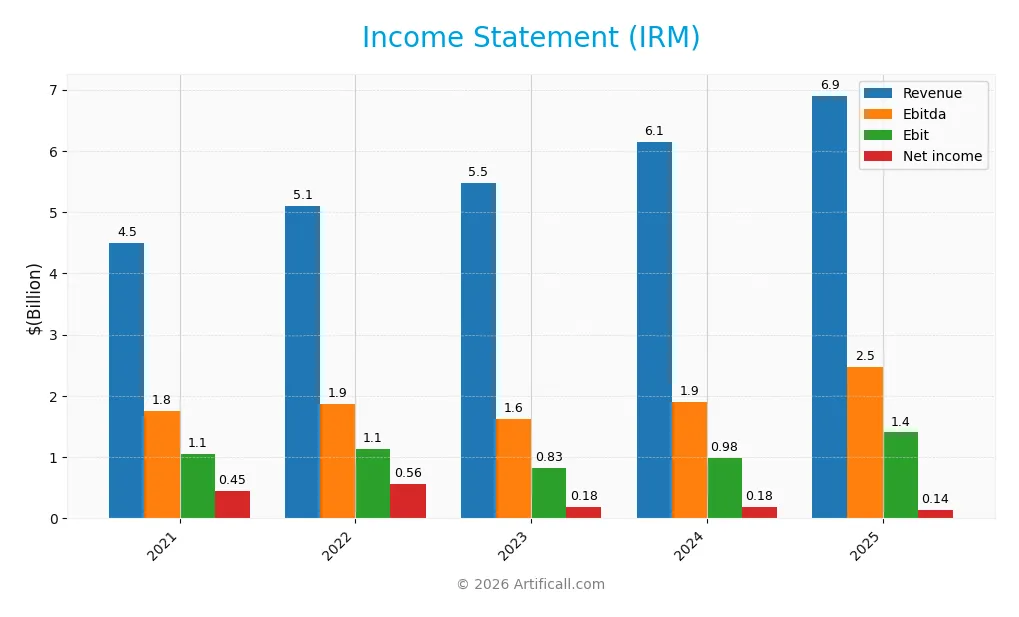
This table summarizes Iron Mountain Incorporated’s key income statement figures for fiscal years 2021 through 2025, reported in USD.
| 2021 | 2022 | 2023 | 2024 | 2025 | |
|---|---|---|---|---|---|
| Revenue | 4.49B | 5.10B | 5.48B | 6.15B | 6.90B |
| Cost of Revenue | 1.89B | 2.19B | 2.36B | 2.70B | 3.08B |
| Operating Expenses | 1.75B | 1.86B | 2.20B | 2.44B | 2.66B |
| Gross Profit | 2.60B | 2.91B | 3.12B | 3.45B | 3.82B |
| EBITDA | 1.75B | 1.87B | 1.62B | 1.91B | 2.47B |
| EBIT | 1.05B | 1.13B | 0.83B | 0.98B | 1.40B |
| Interest Expense | 425M | 496M | 598M | 736M | 829M |
| Net Income | 450M | 557M | 184M | 180M | 145M |
| EPS | 1.56 | 1.92 | 0.63 | 0.61 | 0.49 |
| Filing Date | 2022-02-24 | 2023-02-23 | 2024-02-22 | 2025-02-14 | 2026-02-12 |
Income Statement Evolution
Iron Mountain’s revenue rose steadily by 54% from 2021 to 2025, with a solid 12% increase in 2025 alone. Gross margins remained favorable at 55.4%, supporting strong profitability. EBIT margin improved significantly, up to 20.3% in 2025. However, net income declined sharply over the period, reflecting margin compression and higher interest costs, despite stable operating expenses growth.
Is the Income Statement Favorable?
In 2025, fundamentals show mixed signals. Revenue and EBIT growth are robust, with EBIT rising 43% year-over-year. Interest expense burden remains high at 12%, weighing on net margin, which fell to just 2.1%. EPS dropped nearly 20%, confirming net income challenges. Overall, the income statement is favorable on operational metrics but flagged by weakening bottom-line profitability and elevated financial costs.
Financial Ratios
The table below presents key financial ratios for Iron Mountain Incorporated (IRM) over the last five fiscal years, illustrating profitability, valuation, liquidity, leverage, efficiency, and dividend metrics:
| Ratios | 2021 | 2022 | 2023 | 2024 | 2025 |
|---|---|---|---|---|---|
| Net Margin | 10.0% | 10.9% | 3.4% | 2.9% | 2.1% |
| ROE | 52.6% | 87.5% | 87.0% | -35.8% | -14.7% |
| ROIC | 4.7% | 6.4% | 4.9% | 4.6% | 4.5% |
| P/E | 33.6 | 26.0 | 110.9 | 171.2 | 169.5 |
| P/B | 17.7 | 22.8 | 96.5 | -61.3 | -25.0 |
| Current Ratio | 0.71 | 0.81 | 0.78 | 0.55 | 0.74 |
| Quick Ratio | 0.71 | 0.81 | 0.78 | 0.55 | 0.74 |
| D/E | 13.7 | 20.9 | 69.9 | -32.5 | -19.1 |
| Debt-to-Assets | 81.0% | 82.3% | 84.6% | 87.5% | 88.7% |
| Interest Coverage | 2.0x | 2.1x | 1.5x | 1.4x | 1.4x |
| Asset Turnover | 0.31 | 0.32 | 0.31 | 0.33 | 0.33 |
| Fixed Asset Turnover | 0.64 | 0.66 | 0.61 | 0.61 | 0.57 |
| Dividend Yield | 4.7% | 5.0% | 3.6% | 2.6% | 3.8% |
Evolution of Financial Ratios
Iron Mountain’s Return on Equity (ROE) declined sharply from positive 0.87% in 2023 to negative 14.74% in 2025. The Current Ratio showed volatility, bottoming at 0.55 in 2024 before recovering slightly to 0.74 in 2025. The Debt-to-Equity Ratio swung dramatically, turning negative in 2024 and 2025, reflecting balance sheet complexities. Profitability weakened overall.
Are the Financial Ratios Favorable?
In 2025, Iron Mountain’s profitability ratios, including net margin (2.09%) and ROE (-14.74%), are unfavorable, signaling weak earnings efficiency. Liquidity metrics like the Current and Quick Ratios (0.74) also remain below the industry norm. Leverage is mixed: a high Debt-to-Assets ratio (88.67%) is unfavorable, but a negative Debt-to-Equity ratio is viewed favorably due to accounting factors. Market valuation ratios such as P/E (169.47) are stretched. Overall, 71% of key ratios are unfavorable.
Shareholder Return Policy
Iron Mountain Incorporated maintains a dividend payout ratio around 4-6%, with a steady dividend per share rise to $3.11 in 2025 and a yield near 3.75%. The company supplements returns with share buybacks, though free cash flow coverage is negative, signaling potential sustainability risks.
Despite consistent dividends and buybacks, negative free cash flow and high leverage suggest caution. The policy supports shareholder returns but may pressure long-term value if cash flow deficits persist or debt levels remain elevated.
Score analysis
The following radar chart presents the company’s evaluation across key financial metrics:
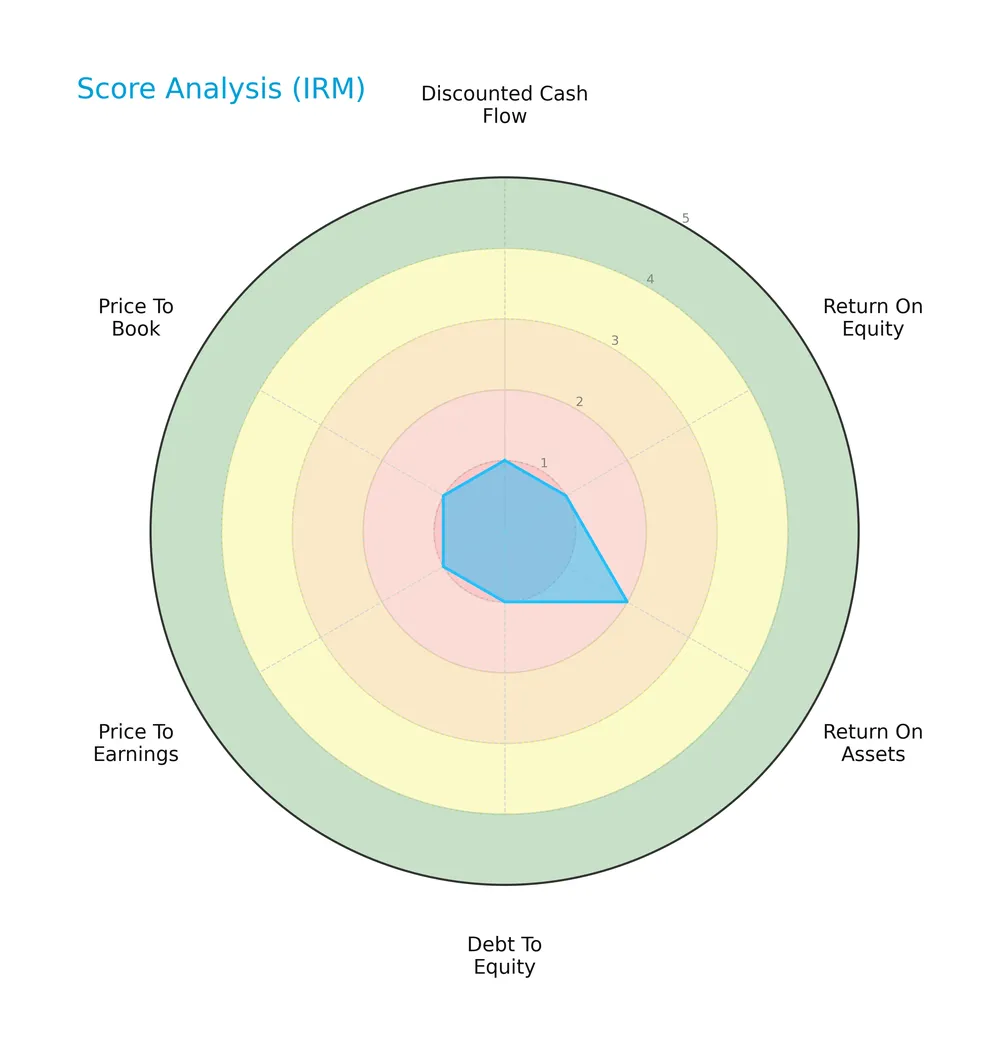
Iron Mountain Incorporated scores very unfavorably in discounted cash flow, return on equity, debt to equity, price to earnings, and price to book. Return on assets is slightly better but still unfavorable.
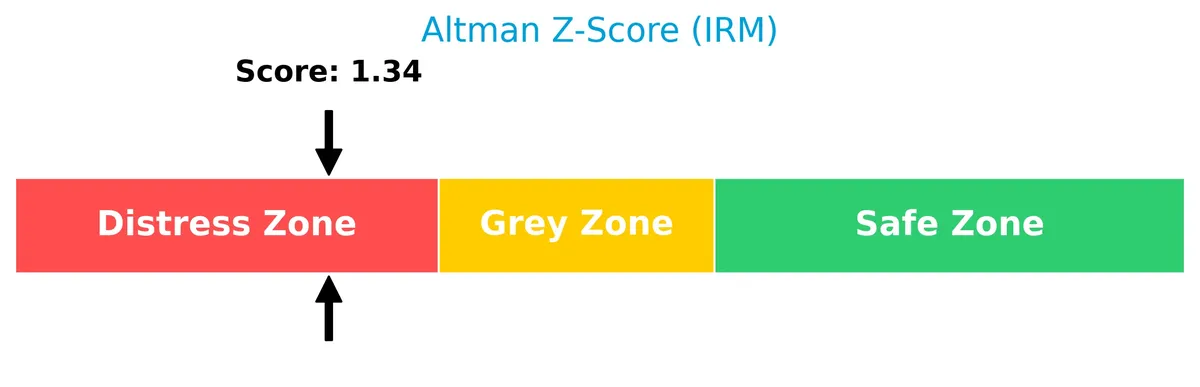
Analysis of the company’s bankruptcy risk
The Altman Z-Score places Iron Mountain in the distress zone, indicating a high probability of financial distress and potential bankruptcy:
Is the company in good financial health?
The Piotroski Score diagram illustrates the company’s moderate financial strength based on nine fundamental criteria:
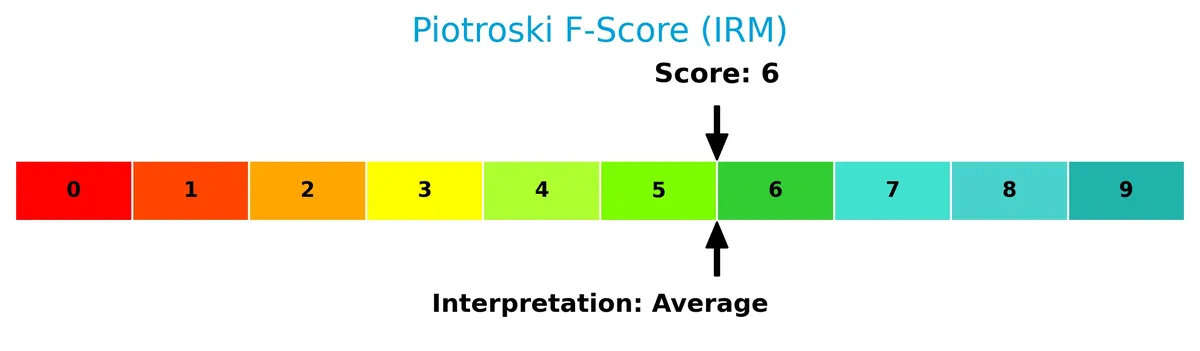
With a Piotroski Score of 6, Iron Mountain shows average financial health, suggesting some strengths but also notable risks compared to stronger peers.
Competitive Landscape & Sector Positioning
This sector analysis examines Iron Mountain Incorporated’s strategic positioning, revenue streams, key products, and competitive rivals. I will evaluate whether Iron Mountain holds a competitive advantage over its main competitors.
Strategic Positioning
Iron Mountain maintains a concentrated product portfolio focused on records and information management, complemented by a growing data center business, generating $5.3B and $803M in 2025 respectively. Geographically, it relies heavily on the US market, which accounted for $4.57B of revenue, with additional exposure in the UK and Canada.
Revenue by Segment
This pie chart illustrates Iron Mountain Incorporated’s revenue distribution by business segment for the fiscal year 2025, highlighting the primary sources of income.
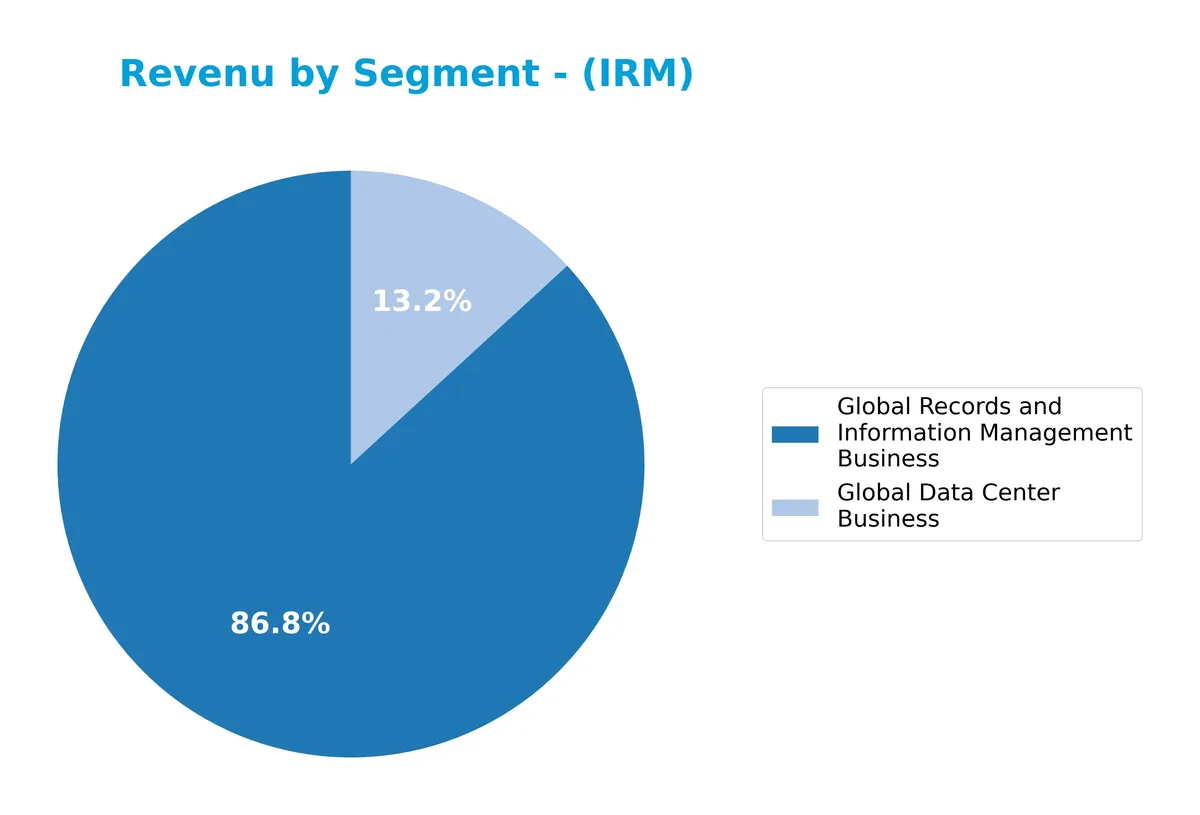
In 2025, the Global Records and Information Management Business dominates with $5.3B in revenue, showing steady growth from $4.3B in 2022. The Global Data Center Business contributes $803M, nearly doubling since 2022’s $401M. The firm’s revenue increasingly concentrates in records management, signaling a stable core. The data center segment accelerates growth, reflecting strategic diversification but also raising concentration risk toward these two segments.
Key Products & Brands
The table below summarizes Iron Mountain Incorporated’s key products and brands with their primary service focus:
| Product | Description |
|---|---|
| Global Records and Information Management | Comprehensive records storage and information management services for sensitive and critical data. |
| Global Data Center Business | Data center solutions, including digital transformation, cloud services, and secure data storage. |
| Information Destruction | Secure destruction services for sensitive information and physical assets. |
| Data Management | Services focused on managing and protecting digital and physical data assets. |
| Records Management | Traditional records storage and archival management services. |
| Data Protection and Recovery | Solutions for data protection, disaster recovery, and business continuity. |
Iron Mountain’s product portfolio spans physical and digital information management, emphasizing secure storage, destruction, and data center services. This diversified offering supports its global client base in managing risk and compliance effectively.
Main Competitors
There are 6 competitors in total in the sector; the table lists the top 10 leaders by market capitalization:
| Competitor | Market Cap. |
|---|---|
| American Tower Corporation | 81.8B |
| Equinix, Inc. | 74.5B |
| Crown Castle Inc. | 38.6B |
| Iron Mountain Incorporated | 24.6B |
| SBA Communications Corporation | 20.7B |
| Weyerhaeuser Company | 17.2B |
Iron Mountain Incorporated ranks 4th among its competitors. Its market cap is 39.67% of the sector leader’s. The company sits below the average market cap of the top 10 but above the sector median. It maintains an 18.98% gap from the next competitor above, indicating moderate separation in scale.
Comparisons with competitors
Check out how we compare the company to its competitors:
Does Iron Mountain have a competitive advantage?
Iron Mountain does not present a competitive advantage as its ROIC falls below WACC by 2.6%, indicating value destruction and declining profitability over 2021-2025. The company’s gross margin of 55.4% and EBIT margin of 20.3% remain favorable but fail to offset rising interest expenses and net margin erosion.
Looking ahead, Iron Mountain leverages a global footprint with 1,450 facilities across 50 countries and offers diversified services including digital transformation and data centers. This broad platform could unlock new growth opportunities in information management and cloud services, despite current challenges in value creation.
SWOT Analysis
This SWOT analysis highlights Iron Mountain Incorporated’s core strategic factors influencing its market position and growth potential.
Strengths
- global leader in storage services
- extensive real estate network of 90M+ sq ft
- trusted by 225,000+ organizations
Weaknesses
- declining ROIC indicates value destruction
- weak liquidity with current ratio at 0.74
- high debt-to-assets at 88.67%
Opportunities
- expanding digital transformation services
- growing demand for secure data centers
- international revenue growth, especially US and UK
Threats
- increasing interest expense pressures margins
- technology disruption risks
- regulatory compliance costs rising
Iron Mountain’s strengths in scale and trust underpin resilience, but financial weakness and high leverage constrain flexibility. Strategic focus on digital growth and cost control is critical to counteract margin pressures and evolving threats.
Stock Price Action Analysis
The weekly stock chart for Iron Mountain Incorporated (IRM) highlights significant price movements and overall market behavior over the past 12 months:
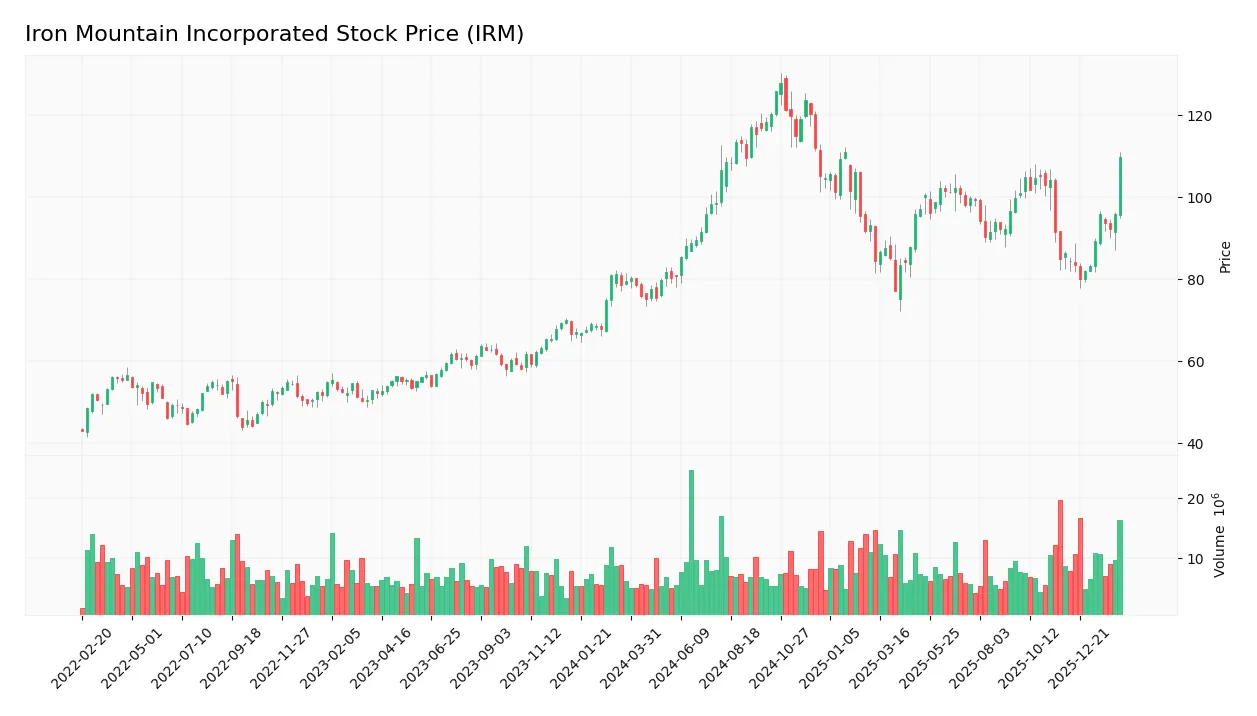
Trend Analysis
IRM’s stock rose 38.22% over the past year, confirming a bullish trend with accelerating momentum. The price fluctuated between $75.1 and $127.7, showing notable volatility with a 12.91 standard deviation. Recent three-month gains of 27.19% maintain a positive slope, supporting sustained upward momentum.
Volume Analysis
Trading volume increased notably, with buyers accounting for 57.28% of total activity year-to-date. Recent three-month data confirm slight buyer dominance at 56.79%, suggesting growing investor confidence and heightened market participation. This volume pattern supports the ongoing bullish price trend.
Target Prices
Analysts project a solid target consensus for Iron Mountain Incorporated, reflecting steady confidence in its outlook.
| Target Low | Target High | Consensus |
|---|---|---|
| 120 | 126 | 123 |
The target prices indicate moderate upside potential, with a tight range suggesting consensus on the stock’s valuation near 123.

Don’t Let Luck Decide Your Entry Point
Optimize your entry points with our advanced ProRealTime indicators. You’ll get efficient buy signals with precise price targets for maximum performance. Start outperforming now!
Analyst & Consumer Opinions
This section examines Iron Mountain Incorporated’s recent analyst ratings and consumer feedback to gauge market sentiment.
Stock Grades
Here is a summary of recent stock grades from leading financial institutions for Iron Mountain Incorporated:
| Grading Company | Action | New Grade | Date |
|---|---|---|---|
| Barclays | Maintain | Overweight | 2025-11-12 |
| JP Morgan | Maintain | Overweight | 2025-11-06 |
| Barclays | Maintain | Overweight | 2025-08-20 |
| JP Morgan | Maintain | Overweight | 2025-08-07 |
| Barclays | Maintain | Overweight | 2025-05-27 |
| Barclays | Maintain | Overweight | 2025-03-20 |
| JP Morgan | Maintain | Overweight | 2025-02-18 |
| Wells Fargo | Maintain | Overweight | 2025-02-04 |
| Barclays | Maintain | Overweight | 2025-01-28 |
| RBC Capital | Maintain | Outperform | 2024-11-27 |
The grades consistently reflect confidence in Iron Mountain’s prospects, with repeated Overweight and Outperform ratings. The consensus remains a Buy, indicating overall positive sentiment despite some Sell opinions.
Consumer Opinions
Iron Mountain Inc. commands a solid reputation among its customers, reflecting trust in its secure data management services.
| Positive Reviews | Negative Reviews |
|---|---|
| Reliable document storage with robust security. | Customer service response times can lag. |
| Easy-to-use digital platform enhances efficiency. | Pricing structure feels complex and opaque. |
| Strong disaster recovery solutions provide peace. | Some delays reported in physical document retrieval. |
Overall, consumers appreciate Iron Mountain’s security and digital ease but frequently flag customer support delays and pricing clarity as areas needing improvement. This feedback aligns with the company’s operational focus on secure, scalable solutions.
Risk Analysis
Below is a summary of Iron Mountain Incorporated’s key risks, their likelihood, and potential impact:
| Category | Description | Probability | Impact |
|---|---|---|---|
| Financial Health | Low Altman Z-Score signals distress zone, indicating bankruptcy risk. | High | Severe |
| Leverage | Debt to assets at 88.7% raises solvency concerns amid rising rates. | High | High |
| Profitability | Negative ROE (-14.7%) and low net margin (2.1%) limit cushion. | High | Medium |
| Liquidity | Current and quick ratios at 0.74 show weak short-term liquidity. | Medium | Medium |
| Interest Coverage | Coverage ratio of 1.69 signals vulnerability to interest hikes. | Medium | High |
| Valuation | Elevated P/E of 169.5 suggests overvaluation risk. | Medium | Medium |
The most pressing risks are the financial distress indicated by the Altman Z-Score and very high leverage. Iron Mountain’s debt load, combined with weak profitability and tight liquidity, heightens vulnerability to economic downturns or rising interest rates. These factors demand caution despite a stable dividend yield of 3.75%.
Should You Buy Iron Mountain Incorporated?
Iron Mountain appears to exhibit weak profitability with declining ROIC and a deteriorating competitive moat, suggesting value destruction. Its substantial leverage profile raises concerns. Despite a very unfavorable overall rating of D+, the average Piotroski score could indicate some operational resilience.
Strength & Efficiency Pillars
Iron Mountain Incorporated posts operational strength with a gross margin of 55.38% and an EBIT margin of 20.34%, signaling solid core profitability. However, its net margin is only 2.09%, reflecting weak bottom-line efficiency. ROIC stands at 4.48%, below the WACC of 7.07%, indicating the company is currently shedding value rather than creating it. This operational profile suggests efficiency in generating operating profits but insufficient returns to cover capital costs.
Weaknesses and Drawbacks
Iron Mountain is in financial distress, as the Altman Z-Score registers a dangerously low 1.34, signaling a high bankruptcy risk. The company’s valuation metrics are highly unfavorable, with a P/E ratio of 169.47 reflecting an extreme premium despite poor earnings. Liquidity is strained, evidenced by a current ratio of 0.74 and interest coverage of 1.69, both red flags for short-term solvency. High debt levels further pressure financial stability, with debt-to-assets at 88.67%.
Our Final Verdict about Iron Mountain Incorporated
Despite some operational profitability, Iron Mountain’s distressed solvency profile makes it a highly speculative investment. The low Altman Z-Score outweighs positive income statement trends and bullish market momentum. Investors should approach with extreme caution, as the solvency risk may jeopardize capital preservation despite any short-term operational improvements.
Disclaimer: This content is for informational purposes only and does not constitute financial, investment, or other professional advice. Investing in financial markets involves a significant risk of loss, and past performance is not indicative of future results.
Additional Resources
- Iron Mountain Incorporated $IRM Shares Sold by Rhumbline Advisers – MarketBeat (Feb 13, 2026)
- Iron Mountain Incorporated (NYSE:IRM) Q4 2025 Earnings Call Transcript – Insider Monkey (Feb 13, 2026)
- A Look At Iron Mountain (IRM) Valuation After Record Q4 2025 Results And Upbeat 2026 Guidance – Yahoo Finance (Feb 13, 2026)
- Iron Mountain Q4 AFFO Beat, Storage Rental & Service Revenues Rise – Zacks Investment Research (Feb 13, 2026)
- Iron Mountain Q4 2025 earnings preview: What to expect (IRM:NYSE) – Seeking Alpha (Feb 11, 2026)
For more information about Iron Mountain Incorporated, please visit the official website: ironmountain.com