Home > Analyses > Healthcare > IQVIA Holdings Inc.
IQVIA transforms how life sciences companies develop and deliver therapies, shaping healthcare decisions worldwide. It leads the medical diagnostics and research industry with cutting-edge analytics, cloud-based technology, and comprehensive clinical trial services. Renowned for innovation and deep data integration, IQVIA empowers better patient outcomes and faster drug development. As competition intensifies and technology evolves, I question whether IQVIA’s fundamentals still justify its premium valuation and growth expectations.

Table of contents
Business Model & Company Overview
IQVIA Holdings Inc., founded in 1982 and headquartered in Durham, NC, leads the medical diagnostics and research sector with a comprehensive ecosystem. It integrates advanced analytics, technology solutions, and clinical research services into a unified platform that supports life sciences innovation globally. The company’s 89K-strong workforce drives a mission to improve patient outcomes and healthcare decision-making through data and science.
IQVIA generates value through a balanced revenue engine spanning cloud-based technology, clinical trial support, and patient engagement services. Its offerings span the Americas, Europe, Africa, and Asia-Pacific, serving pharmaceutical, biotech, and device firms. The company’s competitive advantage lies in its data depth and global reach, building a durable economic moat that shapes the future of life sciences research.
Financial Performance & Fundamental Metrics
I analyze IQVIA Holdings Inc.’s income statement, key financial ratios, and dividend payout policy to assess its core profitability and shareholder returns.
Income Statement
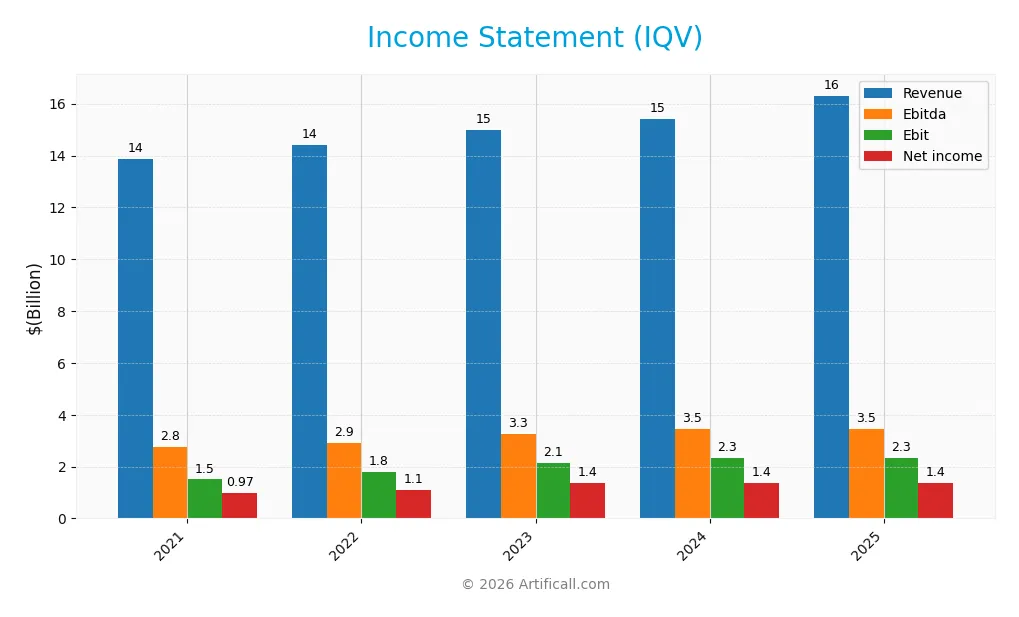
The table below presents IQVIA Holdings Inc.’s key income statement figures for fiscal years 2021 through 2025, reflecting revenue, expenses, profits, and earnings per share.
| 2021 | 2022 | 2023 | 2024 | 2025 | |
|---|---|---|---|---|---|
| Revenue | 13.9B | 14.4B | 15.0B | 15.4B | 16.3B |
| Cost of Revenue | 9.2B | 9.4B | 9.7B | 10.0B | 12.0B |
| Operating Expenses | 3.2B | 3.2B | 3.3B | 3.2B | 2.0B |
| Gross Profit | 4.6B | 5.0B | 5.2B | 5.4B | 4.3B |
| EBITDA | 2.8B | 2.9B | 3.3B | 3.5B | 3.5B |
| EBIT | 1.5B | 1.8B | 2.1B | 2.3B | 2.3B |
| Interest Expense | 375M | 416M | 672M | 670M | 729M |
| Net Income | 966M | 1.1B | 1.4B | 1.4B | 1.4B |
| EPS | 5.05 | 5.82 | 7.39 | 7.57 | 7.91 |
| Filing Date | 2022-02-16 | 2023-02-15 | 2024-02-15 | 2025-02-13 | 2026-02-17 |
Income Statement Evolution
IQVIA’s revenue rose steadily from 13.9B in 2021 to 16.3B in 2025, representing a 17.6% growth over five years. Net income grew even faster by 40.8%, boosting margins. Despite a recent one-year dip in gross profit and EBIT, overall gross margin and net margin improved, reflecting better cost control and operational efficiency.
Is the Income Statement Favorable?
In 2025, IQVIA posted a 16.3B revenue with a 26.3% gross margin and 14.2% EBIT margin, both favorable by industry standards. Net margin stood at 8.3%, supported by disciplined interest expense at 4.5%. EPS grew 4.7%, signaling solid profitability despite a slight year-over-year EBIT decline. Fundamentals appear generally favorable with controlled expenses and margin resilience.
Financial Ratios
The following table presents key financial ratios for IQVIA Holdings Inc. from 2021 to 2025, reflecting profitability, valuation, liquidity, leverage, and efficiency metrics:
| Ratios | 2021 | 2022 | 2023 | 2024 | 2025 |
|---|---|---|---|---|---|
| Net Margin | 7.0% | 7.6% | 9.1% | 8.9% | 8.3% |
| ROE | 16.0% | 18.9% | 22.2% | 22.6% | 20.9% |
| ROIC | 6.1% | 7.3% | 8.8% | 8.6% | 8.2% |
| P/E | 55.9 | 35.2 | 31.3 | 25.9 | 28.5 |
| P/B | 8.9 | 6.7 | 7.0 | 5.9 | 6.0 |
| Current Ratio | 0.91 | 0.89 | 0.86 | 0.84 | 0.75 |
| Quick Ratio | 0.91 | 0.89 | 0.86 | 0.84 | 0.75 |
| D/E | 2.06 | 2.26 | 2.27 | 2.33 | 2.49 |
| Debt-to-Assets | 50.4% | 51.4% | 52.1% | 52.6% | 54.0% |
| Interest Coverage | 3.7 | 4.3 | 2.9 | 3.3 | 3.1 |
| Asset Turnover | 0.56 | 0.57 | 0.56 | 0.57 | 0.54 |
| Fixed Asset Turnover | 15.4 | 16.7 | 18.3 | 19.9 | 19.8 |
| Dividend Yield | 0.0% | 0.0% | 0.0% | 0.0% | 0.0% |
Evolution of Financial Ratios
From 2021 to 2025, IQVIA’s Return on Equity (ROE) rose steadily from 15.99% to 20.91%, showing improved profitability. The Current Ratio declined from 0.91 to 0.75, indicating weakening liquidity. Meanwhile, the Debt-to-Equity Ratio increased from 2.06 to 2.49, reflecting higher leverage and financial risk over the period.
Are the Financial Ratios Fovorable?
In 2025, IQVIA’s profitability is solid with a favorable ROE (20.91%) above its WACC (7.8%), but net margin (8.34%) is neutral. Liquidity ratios, including a low Current Ratio (0.75), and leverage ratios, such as a high Debt-to-Equity (2.49) and Debt-to-Assets (54.0%), are unfavorable. Market multiples like P/E (28.5) and P/B (5.96) also appear stretched. Overall, the ratios paint a slightly unfavorable financial profile.
Shareholder Return Policy
IQVIA Holdings Inc. does not pay dividends, reflecting a reinvestment strategy likely aimed at supporting growth and innovation. The company does not currently engage in share buybacks either, which aligns with prioritizing capital deployment elsewhere.
This approach supports sustainable long-term value creation if reinvestments drive returns above cost of capital. However, absence of direct shareholder returns may concern income-focused investors, emphasizing the need for clear communication of capital allocation priorities.
Score analysis
The following radar chart presents a comprehensive view of IQVIA Holdings Inc.’s key financial evaluation scores:
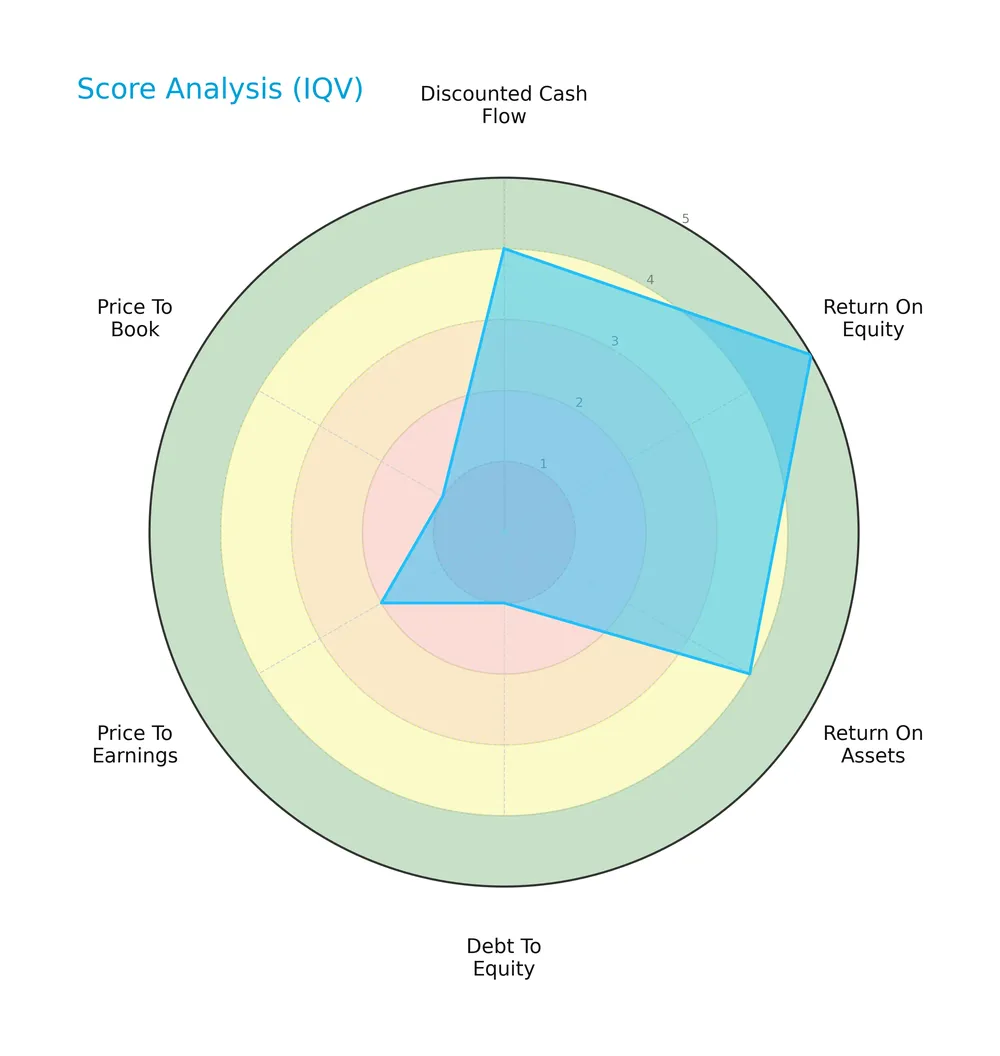
IQVIA shows strength in discounted cash flow (4), return on equity (5), and return on assets (4). However, its debt-to-equity (1), price-to-earnings (2), and price-to-book (1) scores are notably weak, indicating financial leverage and valuation concerns.
Analysis of the company’s bankruptcy risk
IQVIA’s Altman Z-Score places it in the distress zone, signaling a significant risk of financial distress and potential bankruptcy:

Is the company in good financial health?
This Piotroski diagram evaluates IQVIA’s financial strength based on nine critical criteria:
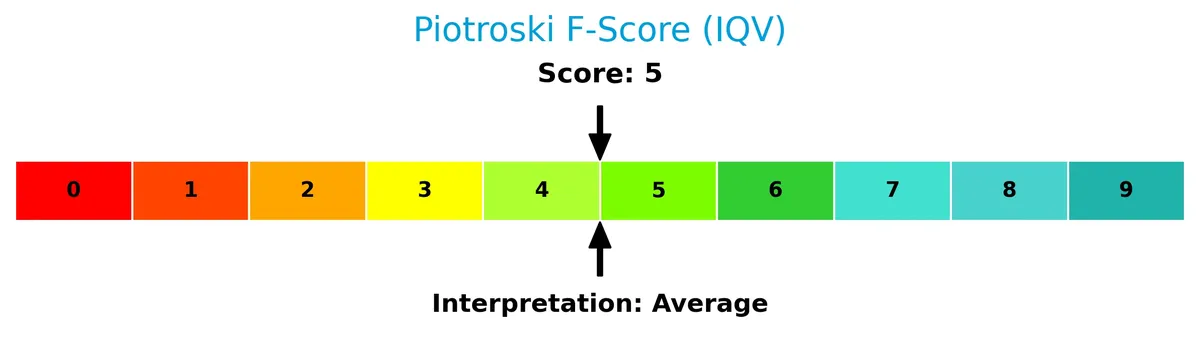
With a Piotroski Score of 5, IQVIA reflects average financial health, suggesting moderate operational efficiency and profitability but leaving room for improvement.
Competitive Landscape & Sector Positioning
This analysis explores IQVIA Holdings Inc.’s strategic positioning, revenue streams, and competitive environment. I will assess whether IQVIA holds a sustainable advantage over its main competitors.
Strategic Positioning
IQVIA Holdings Inc. maintains a diversified portfolio across three segments: Research & Development Solutions ($8.9B), Technology & Analytics Solutions ($6.6B), and Contract Sales & Medical Solutions ($788M) in 2025. Geographically, it spans Americas ($7.7B), EMEA ($5.2B), and Asia Pacific ($3.4B), reflecting broad global exposure within life sciences services.
Revenue by Segment
The pie chart illustrates IQVIA Holdings Inc.’s revenue distribution by segment for fiscal year 2025, highlighting the company’s diverse business units and their contributions.
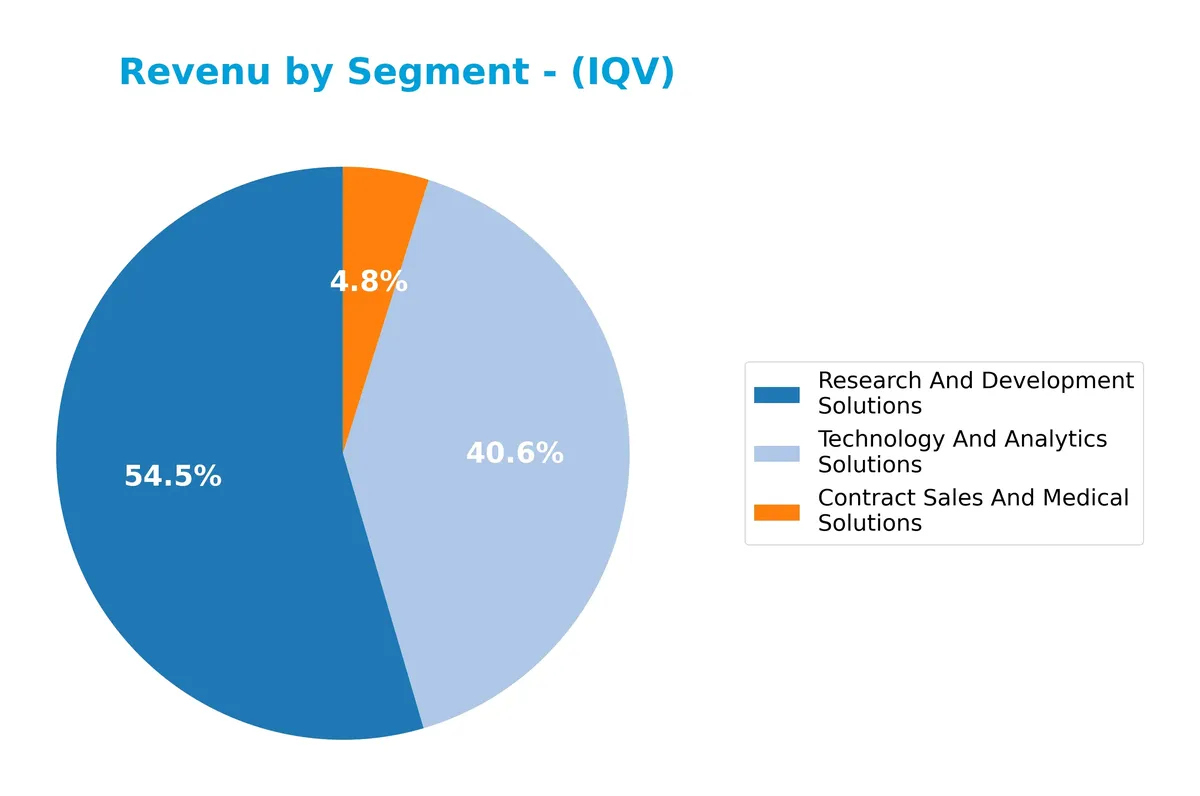
Research And Development Solutions lead with $8.9B, followed by Technology And Analytics Solutions at $6.6B, and Contract Sales And Medical Solutions at $788M. The consistent growth in R&D and Technology segments reflects IQVIA’s strong foothold in data-driven healthcare services. Contract Sales shows steady but smaller scale revenue. The 2025 figures confirm acceleration in high-margin analytics, underscoring a shift toward technology-led innovation.
Key Products & Brands
IQVIA’s revenue derives from three core segments, reflecting diverse service offerings in life sciences:
| Product | Description |
|---|---|
| Technology & Analytics Solutions | Provides cloud-based applications, real world data solutions, and consulting to improve healthcare decisions. |
| Research & Development Solutions | Offers clinical trial management, monitoring, laboratory services, and strategic planning for drug development. |
| Contract Sales & Medical Solutions | Delivers healthcare provider engagement, scientific strategy, and medical affairs services to clients. |
IQVIA’s portfolio spans advanced analytics, clinical research, and sales support. This diversified mix supports pharmaceutical, biotech, and healthcare industries globally, underlining its broad footprint in medical diagnostics and research.
Main Competitors
IQVIA Holdings Inc. faces 11 competitors in its sector; below is a table of the top 10 leaders by market capitalization:
| Competitor | Market Cap. |
|---|---|
| Thermo Fisher Scientific Inc. | 225B |
| Danaher Corporation | 165B |
| IDEXX Laboratories, Inc. | 53.5B |
| Agilent Technologies, Inc. | 39.1B |
| IQVIA Holdings Inc. | 38.4B |
| Mettler-Toledo International Inc. | 28.8B |
| Waters Corporation | 22.7B |
| Quest Diagnostics Incorporated | 19.4B |
| Revvity, Inc. | 11.6B |
| Charles River Laboratories International, Inc. | 10.0B |
IQVIA ranks 5th among its competitors, holding 12.5% of the top player’s market cap. It sits below both the average market cap of the top 10 (61.3B) and the sector median (28.8B). The company maintains a healthy 39.65% market cap lead over its nearest competitor above, underscoring a notable gap in scale.
Comparisons with competitors
Check out how we compare the company to its competitors:
Does IQV have a competitive advantage?
IQVIA Holdings Inc. does not yet demonstrate a clear competitive advantage, as its ROIC remains below WACC, indicating value shedding despite favorable profitability trends. Its overall moat status is slightly favorable, reflecting improving profitability but lacking sustained economic profits.
Looking ahead, IQVIA continues expanding across Americas, EMEA, and Asia Pacific markets, leveraging technology and analytics solutions alongside clinical research services. Future opportunities lie in cloud-based applications, strategic consulting, and contract sales, supporting its growth in the life sciences industry.
SWOT Analysis
This analysis highlights IQVIA Holdings Inc.’s internal strengths and weaknesses alongside external opportunities and threats shaping its strategic outlook.
Strengths
- strong market position in healthcare analytics
- diversified global revenue streams
- growing ROIC trend
Weaknesses
- high debt levels
- low liquidity ratios
- elevated valuation multiples
Opportunities
- expanding demand for real-world data solutions
- growth in Asia-Pacific healthcare markets
- potential for cloud-based technology expansion
Threats
- intense industry competition
- regulatory changes in healthcare
- economic sensitivity impacting R&D spending
IQVIA’s strengths in analytics and global reach position it well for growth. However, elevated leverage and valuation pose risks. Management must balance expansion with prudent capital structure to sustain competitive advantage.
Stock Price Action Analysis
The weekly stock chart for IQVIA Holdings Inc. illustrates price movements and volatility during the last 12 months:
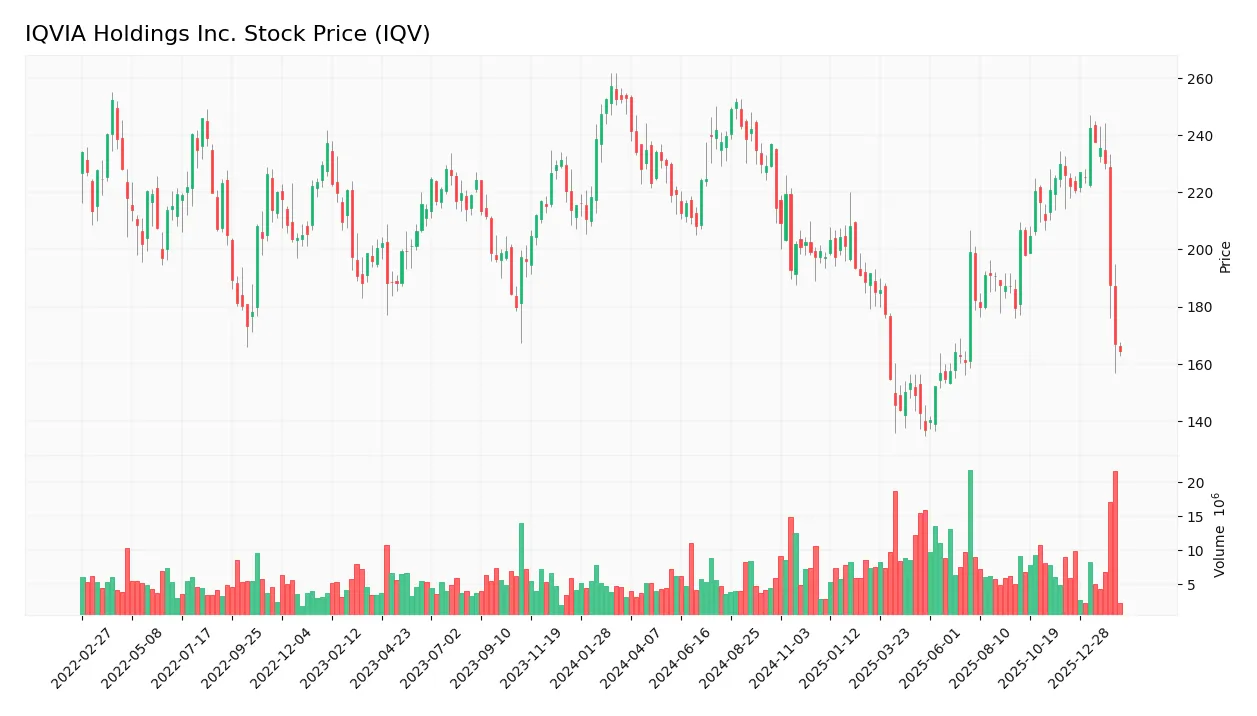
Trend Analysis
IQV’s stock fell 35% over the past year, confirming a bearish trend with decelerating losses. The 30 volatility level indicates elevated price swings. The highest price reached 252.89, while the lowest hit 137. The downward slope intensified recently, dropping 27% since December 2025.
Volume Analysis
Trading volume is increasing, with sellers dominating 57% overall and 88% in the last three months. This seller-driven activity signals persistent selling pressure and weak investor confidence, reflecting cautious market participation amid the downtrend.
Target Prices
Analysts set a target consensus that reflects moderate optimism for IQVIA Holdings Inc.
| Target Low | Target High | Consensus |
|---|---|---|
| 210 | 290 | 240.73 |
The target range suggests expectations for steady growth, with a consensus price indicating upside potential above current levels.

Don’t Let Luck Decide Your Entry Point
Optimize your entry points with our advanced ProRealTime indicators. You’ll get efficient buy signals with precise price targets for maximum performance. Start outperforming now!
Analyst & Consumer Opinions
This section examines IQVIA Holdings Inc.’s analyst ratings and consumer feedback to assess market sentiment and reputation.
Stock Grades
Here are the latest verified stock grades for IQVIA Holdings Inc. from prominent financial institutions:
| Grading Company | Action | New Grade | Date |
|---|---|---|---|
| Stifel | Maintain | Buy | 2026-02-06 |
| Citigroup | Maintain | Neutral | 2026-02-06 |
| Jefferies | Maintain | Buy | 2026-02-06 |
| JP Morgan | Maintain | Overweight | 2026-02-06 |
| UBS | Maintain | Buy | 2026-02-06 |
| Barclays | Maintain | Equal Weight | 2026-02-06 |
| TD Cowen | Maintain | Hold | 2026-01-22 |
| Truist Securities | Maintain | Buy | 2026-01-08 |
| Morgan Stanley | Maintain | Overweight | 2025-12-02 |
The overall trend shows strong confidence in IQVIA, with a majority of buy and overweight ratings. A few hold and neutral assessments indicate some caution but no outright negative sentiment.
Consumer Opinions
IQVIA Holdings Inc. consistently draws strong opinions from its diverse client base, reflecting its complex role in healthcare analytics and services.
| Positive Reviews | Negative Reviews |
|---|---|
| “Exceptional data accuracy and insightful analytics.” | “Customer service response times can be slow.” |
| “Robust platform that integrates well with our systems.” | “Pricing is on the higher side for smaller firms.” |
| “Innovative solutions that drive real-world evidence.” | “Occasional glitches in software updates.” |
Overall, consumers praise IQVIA for its data precision and innovative tools, but note challenges in customer support and cost. These issues could affect smaller clients more.
Risk Analysis
Below is a detailed table summarizing IQVIA Holdings Inc.’s key risks based on financial and market data:
| Category | Description | Probability | Impact |
|---|---|---|---|
| Financial Leverage | Debt-to-equity ratio at 2.49 signals heavy reliance on debt financing. | High | High |
| Liquidity | Current and quick ratios at 0.75 indicate insufficient short-term liquidity. | High | Medium |
| Valuation | Elevated PE (28.5) and PB (5.96) ratios suggest overvaluation risk. | Medium | Medium |
| Bankruptcy Risk | Altman Z-score of 1.8 places the company in the distress zone. | Medium | High |
| Dividend Policy | No dividend yield could deter income-focused investors. | Medium | Low |
| Market Volatility | Beta of 1.36 reflects above-market volatility sensitivity. | Medium | Medium |
The most pressing risks stem from IQVIA’s high leverage and weak liquidity, which heighten financial distress probability. The Altman Z-score confirms vulnerability, placing it near distress territory. Elevated valuation multiples add risk amid market corrections. Caution is warranted despite favorable ROE and operational metrics.
Should You Buy IQVIA Holdings Inc.?
IQVIA appears to be improving its profitability and operational efficiency, supported by a slightly favorable moat with growing ROIC. Despite a substantial leverage profile and financial distress signals, its overall rating suggests a moderate investment profile with notable risks.
Strength & Efficiency Pillars
IQVIA Holdings Inc. shows solid operational margins with a gross margin of 26.28% and an EBIT margin of 14.22%. The return on equity stands at a favorable 20.91%, reflecting efficient capital use. Its ROIC of 8.23% slightly exceeds the WACC of 7.8%, indicating the company might be a modest value creator. These metrics suggest IQVIA maintains operational effectiveness despite challenging industry conditions.
Weaknesses and Drawbacks
IQVIA is currently in the Altman Z-Score distress zone, scoring 1.80, signaling a high bankruptcy risk. This critical solvency concern overshadows its profitability. The company’s valuation appears stretched with a P/E of 28.49 and a P/B of 5.96, raising caution. Additionally, a debt-to-equity ratio of 2.49 and a low current ratio of 0.75 highlight significant leverage and liquidity risks. Recent seller dominance at 11.55% buyer volume adds short-term market pressure.
Our Final Verdict about IQVIA Holdings Inc.
Despite operational strengths, IQVIA’s low Altman Z-Score of 1.80 flags severe solvency concerns. This financial distress makes the investment profile highly speculative and too risky for conservative capital. Investors should prioritize risk management and consider waiting for clearer signs of balance sheet stability before committing.
Disclaimer: This content is for informational purposes only and does not constitute financial, investment, or other professional advice. Investing in financial markets involves a significant risk of loss, and past performance is not indicative of future results.
Additional Resources
- Decoding IQVIA Holdings Inc (IQV): A Strategic SWOT Insight – GuruFocus (Feb 18, 2026)
- Assessing IQVIA Holdings (IQV) Valuation After Sharp Three Month Share Price Pullback – Sahm (Feb 15, 2026)
- IQVIA HOLDINGS INC. SEC 10-K Report – TradingView (Feb 17, 2026)
- Rhumbline Advisers Sells 25,227 Shares of IQVIA Holdings Inc. $IQV – MarketBeat (Feb 13, 2026)
- Is the Options Market Predicting a Spike in IQVIA Stock? – Yahoo Finance (Feb 13, 2026)
For more information about IQVIA Holdings Inc., please visit the official website: iqvia.com