Home > Analyses > Technology > IonQ, Inc.
IonQ transforms computing by pioneering practical quantum machines that tackle problems beyond classical reach. As a trailblazer in computer hardware, it offers quantum computing access via major cloud platforms like AWS and Microsoft Azure. IonQ’s leadership in innovation and its scalable 20-qubit systems position it at the forefront of technology evolution. The critical question now is whether IonQ’s cutting-edge fundamentals justify its premium valuation and growth outlook in this emerging sector.

Table of contents
Business Model & Company Overview
IonQ, Inc., founded in 2015 and headquartered in College Park, Maryland, leads the frontier in quantum computing systems. It develops general-purpose quantum computers boasting 20 qubits, positioning itself at the nexus of cutting-edge technology and practical application. IonQ’s ecosystem integrates hardware innovation with cloud accessibility, reflecting a cohesive mission to democratize quantum power.
The company’s revenue engine hinges on selling quantum computing access via major cloud platforms, including AWS, Microsoft Azure, and Google Cloud, alongside its own service. This blend of hardware and recurring cloud-based services fuels its strategic reach across Americas, Europe, and Asia. IonQ’s robust competitive advantage lies in its early leadership and seamless cloud integration, shaping the future of computing innovation.
Financial Performance & Fundamental Metrics
I will analyze IonQ, Inc.’s income statement, key financial ratios, and dividend payout policy to assess its underlying financial health and shareholder value.
Income Statement
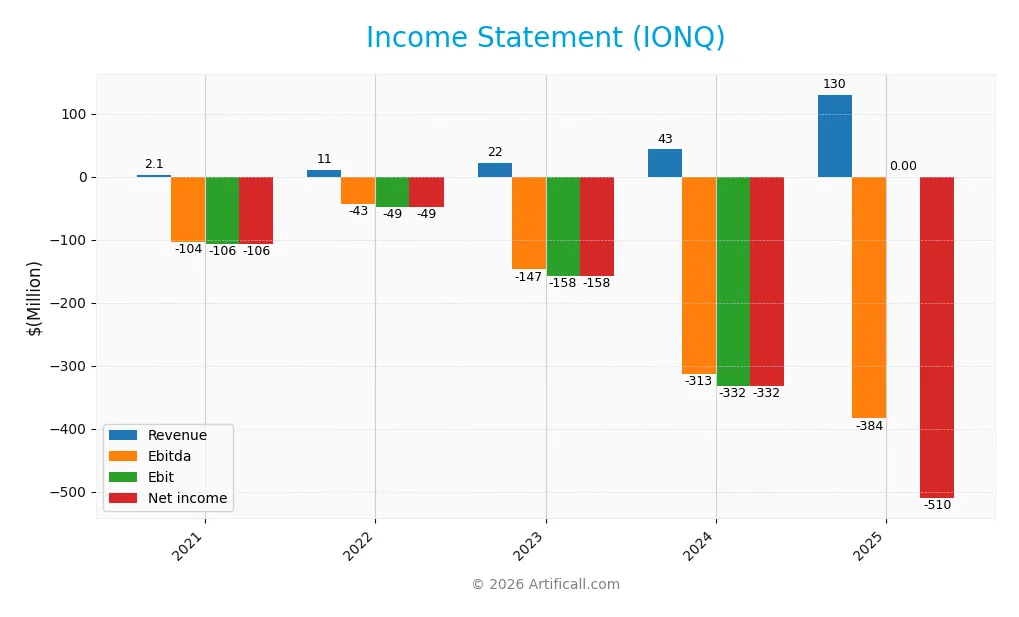
The table below presents IonQ, Inc.’s key income statement metrics for fiscal years 2021 through 2025, showing its revenue, expenses, and profitability trends.
| 2021 | 2022 | 2023 | 2024 | 2025 | |
|---|---|---|---|---|---|
| Revenue | 2.1B | 11.1M | 22.0M | 43.1M | 130.0M |
| Cost of Revenue | 3.6M | 8.5M | 8.1M | 39.3M | 77.5M |
| Operating Expenses | 37.2M | 88.3M | 171.7M | 234.8M | 686.2M |
| Gross Profit | -1.5M | 2.6M | 13.9M | 3.8M | 52.5M |
| EBITDA | -103.6M | -42.9M | -147.4M | -312.9M | -383.8M |
| EBIT | -106.2M | -48.5M | -157.8M | -331.6M | 0 |
| Interest Expense | 0 | 0 | 0 | 0 | 0 |
| Net Income | -106.2M | -48.5M | -157.8M | -331.6M | -510.4M |
| EPS | -0.55 | -0.25 | -0.78 | -1.56 | -1.82 |
| Filing Date | 2022-03-29 | 2023-03-30 | 2024-02-28 | 2025-02-26 | 2026-02-25 |
Income Statement Evolution
IonQ’s revenue surged from 2.1M in 2021 to 130M in 2025, a remarkable 6,094% increase over five years. Gross profit improved sharply, growing over 1,200% in the last year alone, lifting gross margins to a favorable 40.4%. However, net income remained negative, with margins deeply unfavorable despite some improvement, reflecting high operating expenses.
Is the Income Statement Favorable?
In 2025, IonQ posted 130M revenue with a 40.4% gross margin, showing operational scalability. Yet, net income was -510M, and net margin hit -392.5%, pressured by R&D and G&A costs totaling 551M. Despite zero interest expense and positive revenue growth, persistent losses and negative EPS (-1.82) mark fundamentals as challenging, though revenue momentum is a positive signal.
Financial Ratios
The following table summarizes IonQ, Inc.’s key financial ratios from 2021 to 2025, reflecting profitability, liquidity, leverage, and valuation metrics:
| Ratios | 2021 | 2022 | 2023 | 2024 | 2025 |
|---|---|---|---|---|---|
| Net Margin | -50.59% | -4.36% | -7.16% | -7.70% | -3.93% |
| ROE | -17.96% | -8.54% | -32.53% | -86.40% | -13.43% |
| ROIC | -6.11% | -14.82% | -30.51% | -48.55% | -9.88% |
| P/E | -30.24 | -14.06 | -15.91 | -26.83 | -24.65 |
| P/B | 5.43 | 1.20 | 5.18 | 23.18 | 3.31 |
| Current Ratio | 54.65 | 18.43 | 10.49 | 10.50 | 15.50 |
| Quick Ratio | 54.65 | 18.18 | 10.16 | 9.98 | 15.50 |
| D/E | 0.0071 | 0.0071 | 0.0167 | 0.0462 | 0.0079 |
| Debt-to-Assets | 0.66% | 0.68% | 1.46% | 3.49% | 0.46% |
| Interest Coverage | 0 | 0 | 0 | 0 | 0 |
| Asset Turnover | 0.0033 | 0.019 | 0.040 | 0.085 | 0.020 |
| Fixed Asset Turnover | 0.092 | 0.374 | 0.523 | 0.692 | 0.910 |
| Dividend Yield | 0% | 0% | 0% | 0% | 0% |
Evolution of Financial Ratios
From 2021 to 2025, IonQ’s Return on Equity (ROE) remained negative, showing persistent losses with a slight improvement in 2025 to -13.4%. The Current Ratio remained elevated but decreased from 54.7 in 2021 to 15.5 in 2025, indicating a still strong but diminishing liquidity buffer. Debt-to-Equity stayed minimal and stable near 0.01, reflecting very low leverage. Profitability margins stayed negative but showed some volatility.
Are the Financial Ratios Favorable?
In 2025, IonQ’s profitability ratios, including net margin (-392.5%) and ROE (-13.4%), are unfavorable, reflecting ongoing losses. Liquidity ratios show mixed signals: a very high Current Ratio (15.5) is flagged unfavorable due to inefficiency, while the Quick Ratio is favorable. Leverage is low with Debt-to-Equity at 0.01, favorable for risk control. Asset turnover ratios and interest coverage remain weak. Overall, 71% of key ratios are unfavorable, indicating challenging financial health.
Shareholder Return Policy
IonQ, Inc. does not pay dividends, reflecting its consistent net losses and focus on reinvestment in growth and R&D. The company does not engage in share buybacks, aligning with a strategy prioritizing capital preservation amid negative free cash flow.
This approach supports long-term value creation by emphasizing innovation over immediate shareholder payouts. However, sustained losses and absence of distributions may raise concerns for investors seeking income or near-term returns.
Score analysis
The radar chart below displays IonQ, Inc.’s key financial scores across valuation, profitability, and leverage metrics:
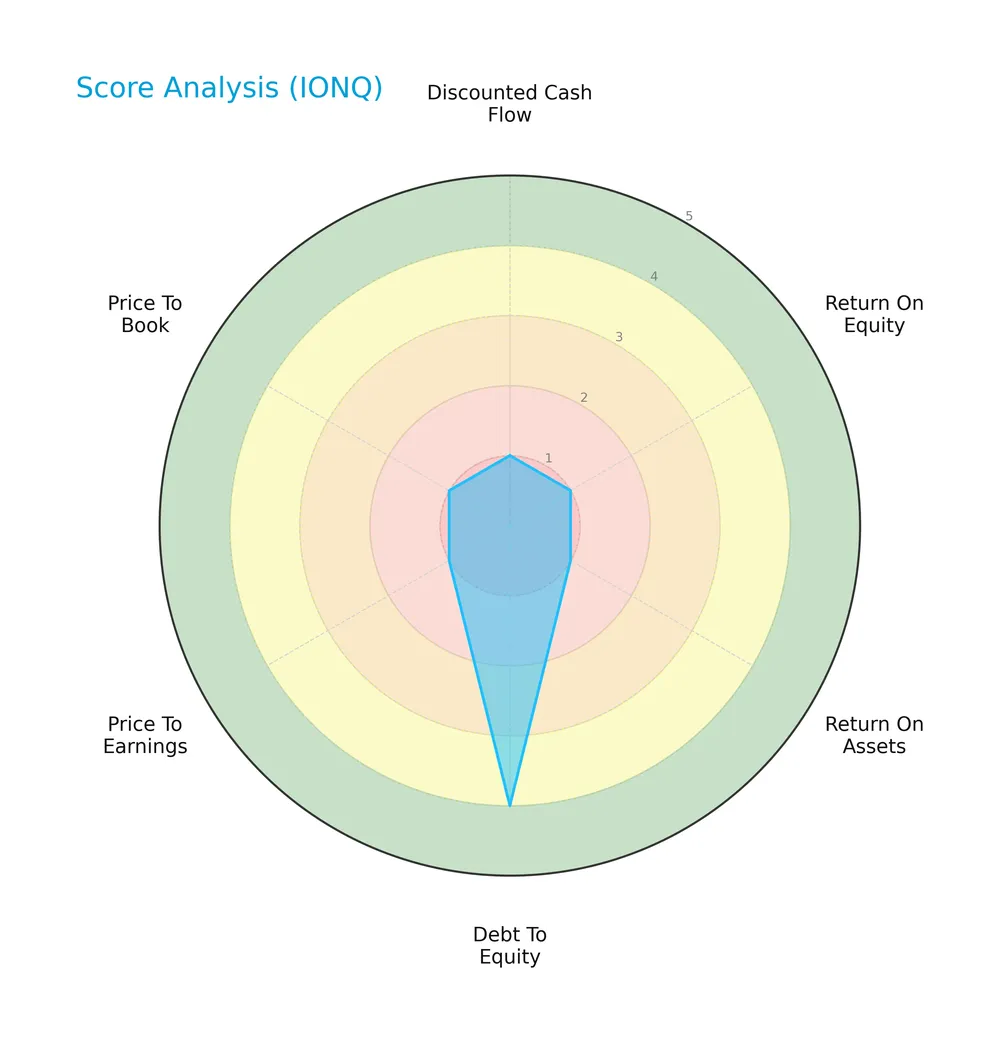
IonQ’s scores reveal significant weaknesses in profitability and valuation, with very unfavorable marks in DCF, ROE, ROA, PE, and PB ratios. The only relative strength lies in its debt-to-equity score, which is favorable, indicating moderate leverage risk.
Analysis of the company’s bankruptcy risk
IonQ’s Altman Z-Score places it in the grey zone, signaling a moderate risk of bankruptcy but not immediate financial distress:

Is the company in good financial health?
The Piotroski F-Score chart highlights IonQ’s overall financial weakness based on key performance and liquidity criteria:
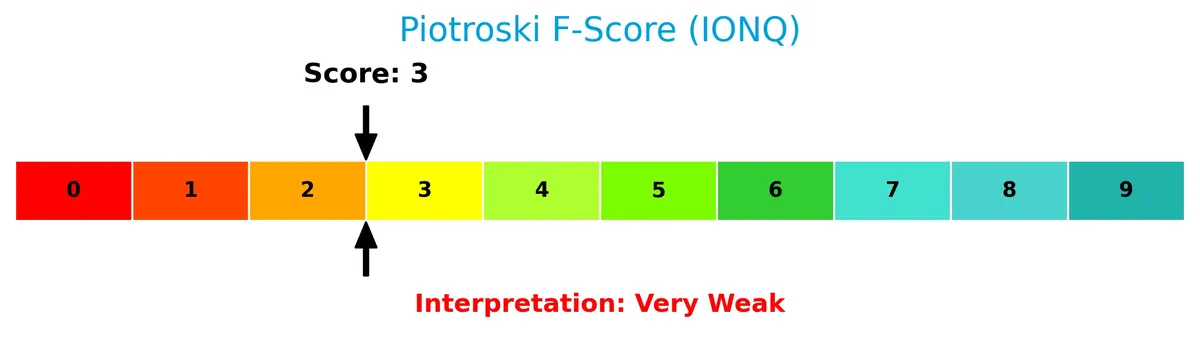
With a Piotroski score of 3, IonQ falls into the very weak category, suggesting poor financial health and limited fundamental strength.
Competitive Landscape & Sector Positioning
This sector analysis reviews IonQ, Inc.’s strategic positioning, revenue segments, key products, and main competitors. I will evaluate whether IonQ holds a sustainable competitive advantage in its industry.
Strategic Positioning
IonQ, Inc. concentrates its revenue primarily in the United States, with $87M in 2025, while expanding modestly overseas to $26M, notably $16.6M from Switzerland. The company focuses on quantum computing hardware, delivering access via major cloud platforms, reflecting a targeted, technology-driven approach.
Key Products & Brands
The following table summarizes IonQ’s primary products and brand offerings:
| Product | Description |
|---|---|
| Quantum Computing Systems | General-purpose quantum computers featuring 20 qubits. |
| Cloud Quantum Access | Quantum computing access via cloud platforms including AWS Amazon Braket, Microsoft Azure Quantum, Google Cloud Marketplace, and IonQ’s own cloud service. |
IonQ focuses on developing advanced quantum computing hardware and delivering cloud-based access. This hybrid approach targets both technology innovation and scalable market reach.
Main Competitors
IonQ, Inc. faces competition from 12 companies in its sector, with the table below showing the top 10 leaders by market capitalization:
| Competitor | Market Cap. |
|---|---|
| Arista Networks, Inc. | 168B |
| Dell Technologies Inc. | 86B |
| Western Digital Corporation | 65B |
| Seagate Technology Holdings plc | 61B |
| Pure Storage, Inc. | 22B |
| NetApp, Inc. | 21B |
| HP Inc. | 21B |
| Super Micro Computer, Inc. | 18B |
| IonQ, Inc. | 16B |
| D-Wave Quantum Inc. | 9B |
IonQ ranks 9th among its peers, holding about 7.1% of the market cap of the sector leader, Arista Networks. Its market cap is below both the top 10 average of 48.7B and the sector median of 21B. IonQ sits 54.8% below its closest competitor above, Super Micro Computer, indicating a notable gap in scale.
Does IonQ have a competitive advantage?
IonQ does not currently present a competitive advantage, as its ROIC is significantly below WACC and declining, indicating the company is destroying value. Despite favorable revenue growth and gross margins, profitability remains negative with a net margin of -392.55%, signaling ongoing challenges.
Looking ahead, IonQ’s access to quantum computing markets through major cloud platforms offers growth opportunities. Expansion into new geographies, especially the substantial increase in non-U.S. revenue, could enhance its competitive positioning if profitability improves.
Comparisons with competitors
Check out how we compare the company to its competitors:
SWOT Analysis
This SWOT analysis highlights IonQ’s core strategic factors to guide investment decisions.
Strengths
- Rapid revenue growth over 6000% since 2021
- Strong gross margin at 40.4%
- Low debt and strong liquidity with current ratio 15.5
Weaknesses
- Negative net margin at -392.55%
- Declining ROIC well below WACC, destroying value
- Weak profitability and poor returns on equity and assets
Opportunities
- Expanding quantum computing market with cloud integration
- Strategic partnerships with AWS, Microsoft, Google
- Increasing demand for advanced computing solutions
Threats
- High beta of 2.6 indicates stock volatility
- Intense competition in quantum hardware
- Technology and execution risks in emerging sector
IonQ demonstrates strong growth potential and healthy gross margins but struggles with profitability and value creation. The firm must focus on improving operational efficiency while leveraging cloud partnerships to capitalize on a nascent market. Risk management remains critical given financial weaknesses and sector volatility.
Stock Price Action Analysis
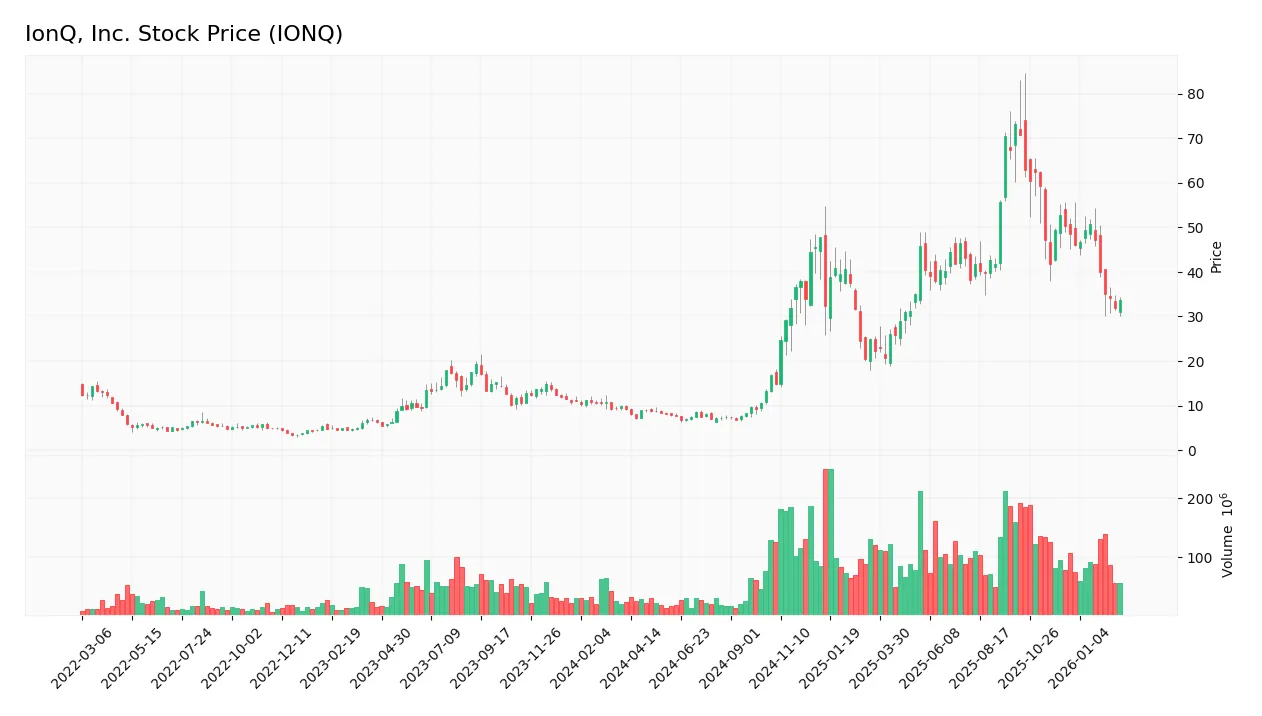
The following weekly stock chart illustrates IonQ’s price movement and volatility over the analyzed period:
Trend Analysis
Over the past two years, IonQ’s stock surged 265%, indicating a strong bullish trend with decelerating momentum. The price ranged from a low of 6.76 to a peak of 73.28, displaying significant volatility with an 18.16 standard deviation. Recent months show a 33% decline, reflecting a short-term neutral to bearish tilt.
Volume Analysis
In the last three months, seller volume dominated at 72%, signaling a seller-driven phase. Total volume increased, suggesting heightened market participation but weak buyer conviction. This shift indicates cautious or negative investor sentiment amid recent price declines.
Target Prices
Analysts present a moderately bullish consensus on IonQ, Inc. with a wide target range reflecting growth potential and sector volatility.
| Target Low | Target High | Consensus |
|---|---|---|
| 35 | 100 | 69.29 |
The target prices suggest optimism tempered by uncertainty. The consensus near 69 indicates expectations for substantial upside from current levels.
Analyst & Consumer Opinions
This section examines recent analyst ratings and consumer feedback to provide a balanced view of IonQ, Inc.

Don’t Let Luck Decide Your Entry Point
Optimize your entry points with our advanced ProRealTime indicators. You’ll get efficient buy signals with precise price targets for maximum performance. Start outperforming now!
Stock Grades
Here are the latest verified stock grades for IonQ, Inc. from established financial institutions:
| Grading Company | Action | New Grade | Date |
|---|---|---|---|
| Benchmark | Maintain | Buy | 2024-08-12 |
| Goldman Sachs | Maintain | Neutral | 2024-08-09 |
| Craig-Hallum | Maintain | Buy | 2024-08-08 |
| Needham | Maintain | Buy | 2024-05-16 |
| Needham | Maintain | Buy | 2024-05-09 |
| Goldman Sachs | Maintain | Neutral | 2024-02-29 |
| Needham | Maintain | Buy | 2024-02-29 |
| Morgan Stanley | Maintain | Equal Weight | 2023-10-30 |
| Needham | Maintain | Buy | 2023-09-20 |
| Needham | Maintain | Buy | 2023-09-19 |
The overall trend shows consistent Buy ratings from Needham and Benchmark, while Goldman Sachs and Morgan Stanley lean toward Neutral or Equal Weight. This mix indicates cautious optimism with no recent rating downgrades.
Consumer Opinions
IonQ, Inc. inspires a mix of enthusiasm and caution among its users, reflecting the cutting-edge nature of quantum computing.
| Positive Reviews | Negative Reviews |
|---|---|
| “IonQ’s technology shows impressive potential for groundbreaking applications.” | “High costs limit accessibility for smaller businesses.” |
| “Customer support is responsive and knowledgeable.” | “Software integration can be complex and requires expertise.” |
| “Consistent updates improve system stability and performance.” | “Limited availability of quantum algorithms slows adoption.” |
Overall, consumers praise IonQ’s innovative technology and strong support. However, cost and usability remain significant barriers, tempering broader market enthusiasm.
Risk Analysis
Below is a summary table highlighting IonQ’s key risks, including their likelihood and potential impact on the company’s future:
| Category | Description | Probability | Impact |
|---|---|---|---|
| Financial Stability | Altman Z-Score in grey zone (2.54) signals moderate bankruptcy risk amid ongoing losses. | Medium | High |
| Profitability | Negative net margin (-393%) and ROIC (-9.88%) reflect weak ability to generate returns. | High | High |
| Market Volatility | High beta (2.60) exposes shares to amplified price swings versus the broader market. | High | Medium |
| Liquidity | Current ratio of 15.5 appears strong but may indicate excess cash, inefficient capital use. | Medium | Medium |
| Debt Management | Very low debt (D/E 0.01) limits financial risk but may constrain growth leverage opportunities. | Low | Low |
| Innovation Risk | Quantum computing is nascent; technology or competitive shifts could disrupt IonQ’s business. | Medium | High |
IonQ faces a challenging financial profile with severe losses and weak returns, despite a robust liquidity position. Market volatility remains a clear risk given the stock’s elevated beta. The moderate Altman Z-Score signals caution but no immediate distress. The most pressing risks are profitability and innovation execution, critical for sustaining a moat in this emerging technology sector.
Should You Buy IonQ, Inc.?
IonQ appears to be a company with deteriorating profitability and a very unfavorable moat, reflecting declining operational efficiency and value destruction. Despite a manageable leverage profile, its overall rating is a cautious C-, suggesting significant financial challenges remain.
Strength & Efficiency Pillars
IonQ, Inc. shows solid operational efficiency with a gross margin of 40.4%, indicating strong product pricing or cost control. However, key profitability metrics underperform, with a net margin at -392.55%, ROE at -13.43%, and ROIC at -9.88%. The company’s ROIC is well below its WACC of 15.85%, signaling value destruction rather than creation. Despite favorable debt metrics, IonQ struggles to convert revenues into profits, reflecting early-stage challenges in scaling its quantum computing business.
Weaknesses and Drawbacks
IonQ faces significant financial headwinds. Its Altman Z-Score of 2.54 places it in the “Grey Zone,” signaling moderate bankruptcy risk. The company’s valuation appears stretched with a price-to-book ratio of 3.31, while the price-to-earnings is negative due to losses, complicating traditional valuation metrics. The current ratio is an unusually high 15.5, which may indicate inefficient asset use or cash hoarding rather than liquidity strength. Recent market dynamics favor sellers, with buyer dominance at only 27.65%, adding near-term pressure on the stock.
Our Final Verdict about IonQ, Inc.
IonQ presents a mixed profile. Its long-term trend is bullish, reflecting strong revenue growth and investor interest. However, the financial distress signals in the grey zone, coupled with negative profitability and weak Piotroski score of 3, suggest caution. Despite operational promise, recent seller dominance and valuation concerns indicate the stock may appear too risky for conservative capital. Investors might consider waiting for clearer signs of financial stabilization before increasing exposure.
Disclaimer: This content is for informational purposes only and does not constitute financial, investment, or other professional advice. Investing in financial markets involves a significant risk of loss, and past performance is not indicative of future results.
Additional Resources
- IONQ Earnings: Stock Jumps after Posting Strong Q4 Results – TipRanks (Feb 25, 2026)
- IonQ Achieves $130.0 Million of GAAP Revenues, Beating Guidance by 20% – IonQ Quantum Computing (Feb 25, 2026)
- IonQ: The Management Is Doing A Good Job (NYSE:IONQ) – Seeking Alpha (Feb 23, 2026)
- IonQ becomes first public quantum firm to top $100M in GAAP revenue – Stock Titan (Feb 25, 2026)
- IonQ in focus as quantum computing firm selected for Golden Dome contract (IONQ:NYSE) – Seeking Alpha (Feb 23, 2026)
For more information about IonQ, Inc., please visit the official website: ionq.com