Home > Analyses > Real Estate > Invitation Homes Inc.
Invitation Homes reshapes American living by providing modern, single-family homes tailored to evolving lifestyle needs. As the nation’s largest single-family home leasing company, it excels in delivering quality housing near jobs and schools, blending convenience with comfort. Known for strong service and community focus, Invitation Homes stands out in residential real estate. Yet, with market dynamics shifting, I ask whether its fundamentals still support its current valuation and growth outlook.

Table of contents
Business Model & Company Overview
Invitation Homes Inc., founded in 2017 and headquartered in Dallas, TX, dominates the US residential real estate sector as the nation’s premier single-family home leasing company. Its core business integrates high-quality, updated homes with valued features like proximity to jobs and good schools. The company’s mission centers on turning houses into homes, delivering a cohesive ecosystem of residences tailored to evolving lifestyle demands.
The company’s revenue engine balances leasing income from a vast portfolio of single-family homes across the Americas. Invitation Homes leverages strategic market presence to meet demand in key urban and suburban areas. Its competitive advantage lies in high-touch resident services and scale, creating a sustainable economic moat that shapes the future of residential real estate leasing.
Financial Performance & Fundamental Metrics
I will analyze Invitation Homes Inc.’s income statement, key financial ratios, and dividend payout policy to evaluate its core financial health and shareholder returns.
Income Statement
The table below presents Invitation Homes Inc.’s annual income statement figures for 2021 through 2025, expressed in USD and rounded to millions for clarity.

| 2021 | 2022 | 2023 | 2024 | 2025 | |
|---|---|---|---|---|---|
| Revenue | 2.0B | 2.2B | 2.4B | 2.6B | 2.7B |
| Cost of Revenue | 778M | 874M | 976M | 1.1B | 2.6B |
| Operating Expenses | 668M | 712M | 757M | 805M | -640M |
| Gross Profit | 1.2B | 1.4B | 1.5B | 1.5B | 101M |
| EBITDA | 1.2B | 1.3B | 1.5B | 1.5B | 1.5B |
| EBIT | 585M | 689M | 854M | 821M | 725M |
| Interest Expense | 323M | 304M | 333M | 366M | 353M |
| Net Income | 261M | 383M | 519M | 454M | 588M |
| EPS | 0.45 | 0.63 | 0.85 | 0.74 | 0.96 |
| Filing Date | 2022-02-22 | 2023-02-22 | 2024-02-21 | 2025-02-27 | 2026-02-19 |
Income Statement Evolution
Invitation Homes Inc. shows a steady revenue growth of 37% from 2021 to 2025, with a 4.2% rise in 2025 alone. Net income more than doubled over the period, reflecting a 125% increase. Despite a steep gross profit decline in 2025, net margin improved by 24%, supported by better operating expense control and a 30% EPS growth.
Is the Income Statement Favorable?
The 2025 income statement reveals mixed signals. EBIT margin at 26.6% and net margin at 21.5% are favorable, indicating strong operational efficiency. However, interest expense remains high at nearly 13% of revenue, a clear headwind. Overall, fundamentals lean favorable given solid profitability and margin expansion despite cost pressures and interest costs.
Financial Ratios
The table below presents key financial ratios for Invitation Homes Inc. (INVH) over the past five fiscal years, offering a snapshot of profitability, valuation, liquidity, leverage, and efficiency:
| Ratios | 2021 | 2022 | 2023 | 2024 | 2025 |
|---|---|---|---|---|---|
| Net Margin | 13.1% | 17.1% | 21.4% | 17.3% | 21.5% |
| ROE | 2.7% | 3.7% | 5.1% | 4.7% | 6.2% |
| ROIC | 3.0% | 3.6% | 3.7% | 4.0% | 4.0% |
| P/E | 100.2 | 47.1 | 40.2 | 43.1 | 29.0 |
| P/B | 2.67 | 1.76 | 2.06 | 2.01 | 1.79 |
| Current Ratio | 5.06 | 3.41 | 5.71 | 0.82 | 0 |
| Quick Ratio | 5.06 | 3.41 | 5.71 | 0.82 | 0 |
| D/E | 0.82 | 0.75 | 0.84 | 0.84 | 0.88 |
| Debt-to-Assets | 43.1% | 41.9% | 44.5% | 43.9% | 44.9% |
| Interest Coverage | 1.71 | 2.14 | 2.10 | 2.02 | 2.10 |
| Asset Turnover | 0.11 | 0.12 | 0.13 | 0.14 | 0.15 |
| Fixed Asset Turnover | 59.5 | 54.6 | 54.0 | 36.6 | 0 |
| Dividend Yield | 1.50% | 3.0% | 3.1% | 3.5% | 4.2% |
Evolution of Financial Ratios
Invitation Homes Inc.’s ROE showed a modest rise to 6.17% in 2025 but remains below typical sector benchmarks, indicating limited equity profitability improvement. The Current Ratio declined to zero, signaling liquidity concerns. Debt-to-Equity Ratio increased slightly to 0.88, reflecting stable but cautious leverage. Profitability margins, including net margin, improved, reaching 21.54%, suggesting better operational efficiency.
Are the Financial Ratios Favorable?
In 2025, profitability ratios like net margin and dividend yield appear favorable, highlighting strong earnings and shareholder returns. However, ROE and ROIC underperform relative to the 6.4% WACC, indicating returns insufficient to cover capital costs. Liquidity ratios are unfavorable, with zero current and quick ratios raising red flags. Leverage metrics and market valuation ratios remain neutral to slightly unfavorable, resulting in a generally cautious outlook.
Shareholder Return Policy
Invitation Homes Inc. pays dividends with a payout ratio exceeding 120%, reflecting distributions above net income. The dividend per share has steadily increased, yielding around 4.2% in 2025. The company also pursues share buybacks, supported by free cash flow coverage above 1.6x.
While dividend growth and buybacks suggest shareholder value focus, the payout ratio above 100% signals potential sustainability risks. Maintaining distributions above earnings could pressure financial flexibility if cash flows weaken, warranting close monitoring of capital allocation.
Score analysis
The radar chart below highlights Invitation Homes Inc.’s key financial metric scores for a comprehensive view:

Invitation Homes Inc. scores very favorably on discounted cash flow (5) and favorably on return on assets (4). Return on equity is moderate (3). However, debt to equity (2), price to book (2), and price to earnings (1) scores are unfavorable to very unfavorable, reflecting valuation and leverage concerns.
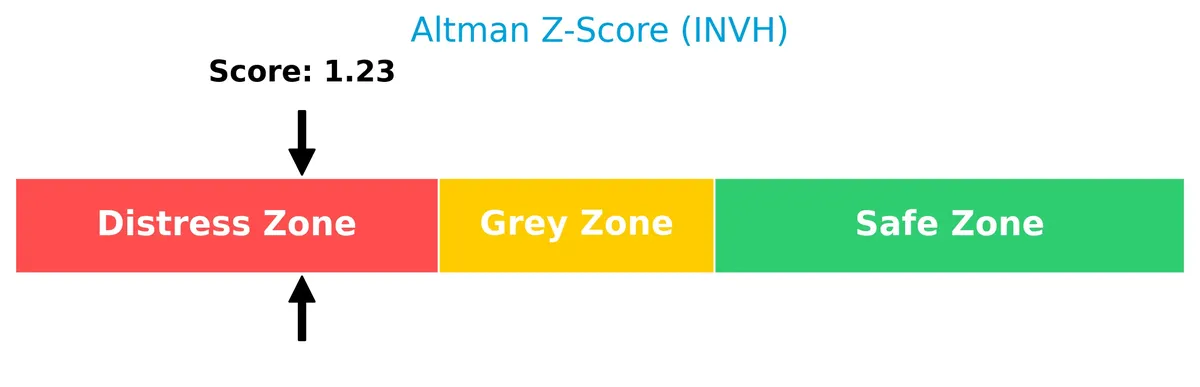
Analysis of the company’s bankruptcy risk
Invitation Homes Inc. currently falls in the distress zone based on its Altman Z-Score, indicating a high risk of financial distress:
Is the company in good financial health?
The Piotroski Score diagram provides insight into Invitation Homes Inc.’s overall financial health and strength:

With a Piotroski Score of 5, the company shows average financial health. This score suggests moderate strength but leaves room for improvement in profitability, efficiency, and liquidity metrics.
Competitive Landscape & Sector Positioning
This analysis explores Invitation Homes Inc.’s strategic positioning within the residential REIT sector. I will examine revenue by segment, key products, and main competitors. I aim to determine whether Invitation Homes holds a sustainable competitive advantage.
Strategic Positioning
Invitation Homes Inc. focuses exclusively on single-family home leasing within the US, emphasizing quality, location, and resident experience. It maintains a concentrated portfolio in residential real estate, prioritizing proximity to jobs and schools, reflecting a targeted geographic and product strategy.
Key Products & Brands
Invitation Homes Inc. offers a focused portfolio of single-family rental homes with distinct residential advantages:
| Product | Description |
|---|---|
| Single-Family Home Leasing | Provides access to high-quality, updated single-family homes located near jobs and good schools. |
Invitation Homes specializes exclusively in leasing single-family homes. Its properties emphasize quality updates and prime locations, supporting resident lifestyles and long-term occupancy. This focused product line reinforces the company’s leadership in residential REITs.
Main Competitors
Invitation Homes Inc. faces competition from 7 key players, with the table below listing the top 7 leaders by market capitalization:
| Competitor | Market Cap. |
|---|---|
| AvalonBay Communities, Inc. | 25.6B |
| Equity Residential | 23.6B |
| Invitation Homes Inc. | 17.0B |
| Essex Property Trust, Inc. | 16.5B |
| Mid-America Apartment Communities, Inc. | 16.3B |
| UDR, Inc. | 12.1B |
| Camden Property Trust | 11.7B |
Invitation Homes Inc. ranks 3rd among its competitors with a market cap at 60.5% of the leader AvalonBay Communities. It sits below both the average market cap of the top 10 (17.6B) and the sector median (16.5B). The company holds a significant 52.2% gap from its closest competitor above, indicating a notable lead in its peer group.
Does INVH have a competitive advantage?
Invitation Homes Inc. shows a slightly unfavorable competitive advantage, as its ROIC remains below WACC, indicating value destruction despite improving profitability. The company’s EBIT margin of 26.56% and net margin of 21.54% are favorable, but interest expenses at 12.95% weigh on returns.
Looking ahead, Invitation Homes focuses on expanding access to high-quality single-family homes near jobs and schools, aligning with changing lifestyle demands. Growth in revenue (4.21% last year) and net income (125% over five years) suggests opportunities in evolving residential markets and resident services.
Comparisons with competitors
Check out how we compare the company to its competitors:
SWOT Analysis
This analysis highlights Invitation Homes Inc.’s key internal and external factors affecting its strategic position.
Strengths
- leading single-family home leasing platform
- strong net margin at 21.54%
- growing ROIC trend
Weaknesses
- ROIC below WACC, indicating value destruction
- low current and quick ratios signal liquidity risks
- unfavorable PE ratio at 28.97
Opportunities
- expanding demand for quality rental homes
- potential to improve operational efficiency
- rising net margin and EPS growth
Threats
- rising interest expenses pressuring margins
- competitive real estate market
- economic downturn impacting rental demand
Invitation Homes shows robust profitability and growth trends but faces liquidity and valuation concerns. The company must focus on strengthening its balance sheet and leveraging market demand to sustain its competitive edge.
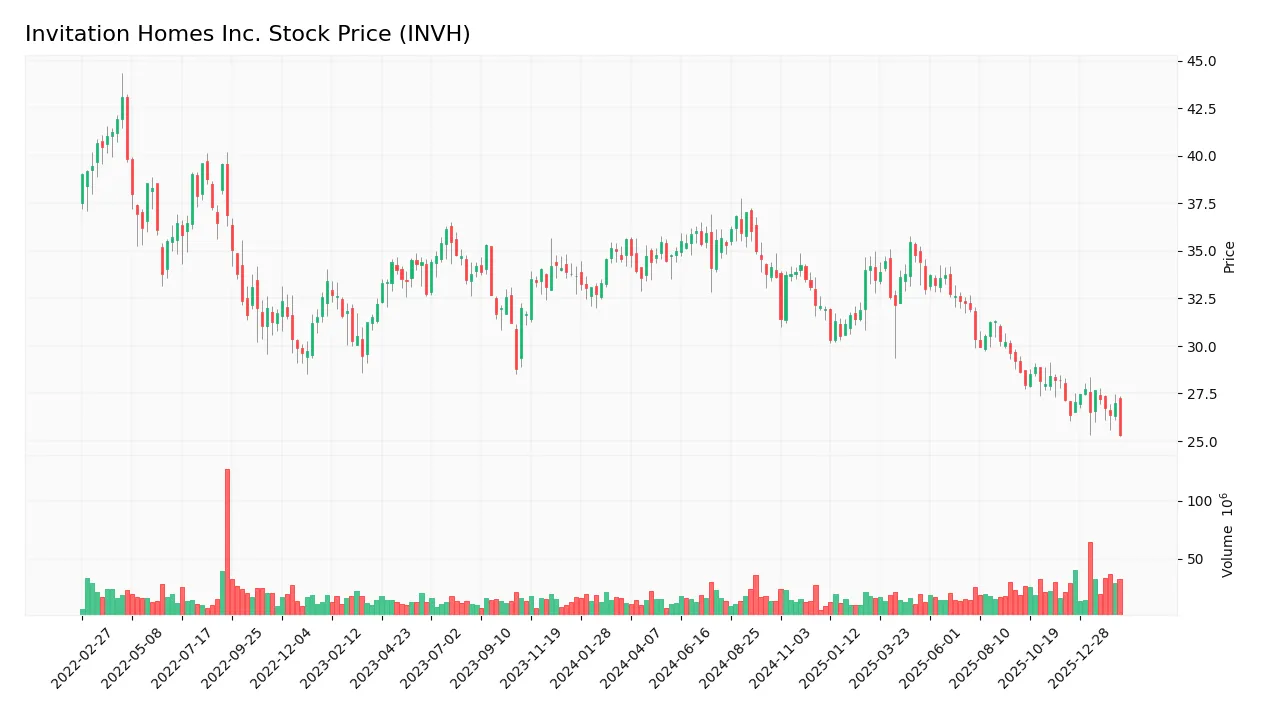
Stock Price Action Analysis
The weekly price chart of Invitation Homes Inc. (INVH) reveals the stock’s movement and volatility over the past 12 months:
Trend Analysis
Over the past 12 months, INVH’s stock price declined by 28.95%, marking a clear bearish trend with accelerating downward momentum. The stock fluctuated between a high of 37.02 and a low of 25.3, reflecting significant volatility with a standard deviation of 2.98. Recent months show a continued weak slope of -0.08 and mild volatility at 0.65.
Volume Analysis
Trading volume has increased overall, totaling 2.17B shares, with sellers dominating 58.1% of activity. In the last three months, seller volume outpaced buyers by 65%, indicating persistent selling pressure. This suggests declining investor confidence and cautious market participation in INVH’s shares.
Target Prices
Analysts project a moderate upside for Invitation Homes Inc., reflecting cautious optimism.
| Target Low | Target High | Consensus |
|---|---|---|
| 27 | 40 | 33.13 |
The target prices suggest analysts expect steady growth, with a consensus price about 15% above current levels, indicating confidence tempered by market risks.
Analyst & Consumer Opinions
This section examines Invitation Homes Inc.’s analyst ratings and consumer feedback to provide a balanced perspective.

Don’t Let Luck Decide Your Entry Point
Optimize your entry points with our advanced ProRealTime indicators. You’ll get efficient buy signals with precise price targets for maximum performance. Start outperforming now!
Stock Grades
The latest verified analyst grades for Invitation Homes Inc. display a consistent pattern of cautious optimism as follows:
| Grading Company | Action | New Grade | Date |
|---|---|---|---|
| Keybanc | maintain | Overweight | 2026-02-20 |
| Evercore ISI Group | maintain | Outperform | 2026-02-20 |
| Citizens | maintain | Market Outperform | 2026-02-20 |
| RBC Capital | maintain | Sector Perform | 2026-02-20 |
| Scotiabank | maintain | Sector Perform | 2026-01-14 |
| UBS | maintain | Buy | 2026-01-08 |
| Mizuho | downgrade | Neutral | 2026-01-08 |
| Barclays | maintain | Overweight | 2025-11-25 |
| JP Morgan | maintain | Overweight | 2025-11-18 |
| Morgan Stanley | maintain | Equal Weight | 2025-11-13 |
Most analysts maintain positive ratings, with several Overweight and Outperform grades. The only downgrade was Mizuho’s shift from Outperform to Neutral, signaling some caution amid overall favorable sentiment.
Consumer Opinions
Invitation Homes Inc. evokes mixed reactions from its tenant base, reflecting the challenges and strengths of large-scale residential landlords.
| Positive Reviews | Negative Reviews |
|---|---|
| Properties are well-maintained and clean. | Some tenants report slow maintenance response. |
| Leasing process is straightforward and quick. | Rent increases above inflation are common. |
| Management is professional and communicative. | Occasional issues with noise and neighbor disputes. |
Overall, tenants appreciate Invitation Homes’ property upkeep and efficient leasing. However, concerns about rent hikes and maintenance delays recur often, signaling areas for operational improvement.
Risk Analysis
Below is a summary of Invitation Homes Inc.’s primary risks, categorized by likelihood and potential impact:
| Category | Description | Probability | Impact |
|---|---|---|---|
| Financial Health | Altman Z-Score indicates high bankruptcy risk (1.23). | High | Severe |
| Valuation | Elevated P/E ratio (28.97) suggests overvaluation risk. | Medium | Moderate |
| Liquidity | Current and quick ratios at zero signal poor liquidity. | High | High |
| Profitability | ROE (6.17%) and ROIC (3.97%) below WACC (6.4%) imply weak capital returns. | Medium | Moderate |
| Debt Management | Debt-to-equity ratio (0.88) is moderate, interest coverage (2.05) is borderline. | Medium | Moderate |
| Market Volatility | Beta of 0.834 reflects somewhat lower sensitivity to market swings. | Low | Low |
The most alarming risk is the distressed Altman Z-Score, indicating a significant bankruptcy probability in the near term. Poor liquidity ratios compound this threat, limiting the company’s ability to cover short-term obligations. While the dividend yield remains attractive at 4.21%, investors must weigh this against the weak profitability and stretched valuation. I advise caution, as Invitation Homes faces notable financial stress amid a challenging real estate market.
Should You Buy Invitation Homes Inc.?
Invitation Homes Inc. appears to be in a moderate financial position with improving profitability yet a slightly unfavorable moat, as it is shedding value despite growing ROIC. Supported by substantial leverage and a B rating, it suggests cautious operational efficiency.
Strength & Efficiency Pillars
Invitation Homes Inc. reports a robust net margin of 21.54%, reflecting solid operational profitability. The EBIT margin at 26.56% further confirms efficient core earnings. However, the return on invested capital (ROIC) stands at 3.97%, below the weighted average cost of capital (WACC) of 6.4%, indicating the company currently destroys value despite improving profitability. The firm’s moderate revenue growth of 4.21% and favorable net margin growth of 24.29% signal operational momentum amid challenging market conditions.
Weaknesses and Drawbacks
The company is in financial distress with an Altman Z-Score of 1.23, signaling a high bankruptcy risk. This solvency concern overshadows other metrics. The price-to-earnings ratio of 28.97 suggests the stock trades at a premium, which may limit upside. Liquidity is a critical red flag, with a current ratio and quick ratio both at zero. This severely restricts the company’s ability to cover short-term obligations, compounding financial risk. Seller dominance at 64.6% in recent trading adds further short-term pressure.
Our Final Verdict about Invitation Homes Inc.
Despite operational strengths and improving margins, Invitation Homes’ Altman Z-Score firmly places it in the distress zone. This solvency risk makes the investment profile highly speculative. Investors should prioritize capital preservation and approach with caution. The company may appear attractive operationally but remains too risky for conservative capital allocation given the elevated bankruptcy threat and liquidity constraints.
Disclaimer: This content is for informational purposes only and does not constitute financial, investment, or other professional advice. Investing in financial markets involves a significant risk of loss, and past performance is not indicative of future results.
Additional Resources
- Invitation Homes Inc (INVH) Q4 2025 Earnings Call Highlights: Navigating Growth and Challenges in a Dynamic Market – GuruFocus (Feb 19, 2026)
- Invitation Homes Inc. Q4 Income Advances – Nasdaq (Feb 18, 2026)
- Invitation Homes Reports Fourth Quarter and Full Year 2025 Results – Business Wire (Feb 18, 2026)
- Invitation Homes Inc. SEC 10-K Report – TradingView (Feb 19, 2026)
- INVITATION HOMES ($INVH) Releases Q4 2025 Earnings – Quiver Quantitative (Feb 18, 2026)
For more information about Invitation Homes Inc., please visit the official website: InvitationHomes.com