Home > Analyses > Financial Services > Invesco Ltd.
Invesco Ltd. shapes global wealth management by expertly navigating diverse asset classes for millions of clients. It commands respect as a top-tier investment manager, offering innovative mutual funds, ETFs, and private funds that blend growth, value, and alternative strategies. Known for its disciplined, quantitative approach, Invesco influences markets and client portfolios worldwide. The key question now: do its fundamentals support its current valuation and future growth amid evolving market dynamics?
Table of contents
Business Model & Company Overview
Invesco Ltd., founded in 1935 and headquartered in Atlanta, GA, commands a leading position in asset management. It serves a broad client base—from retail investors to sovereign wealth funds—through a unified mission: delivering tailored investment solutions across equities, fixed income, and alternatives. This holistic approach creates a cohesive ecosystem designed to meet diverse financial goals.
The company generates revenue by managing client-focused portfolios, mutual funds, and ETFs, balancing active management with quantitative strategies. Its presence spans the Americas, Europe, and Asia, enabling global market access. Invesco’s economic moat lies in its diversified product suite and deep client relationships, positioning it as a key influencer shaping the asset management industry’s future.
Financial Performance & Fundamental Metrics
I will analyze Invesco Ltd.’s income statement, key financial ratios, and dividend payout policy to assess its profitability and capital allocation efficiency.
Income Statement
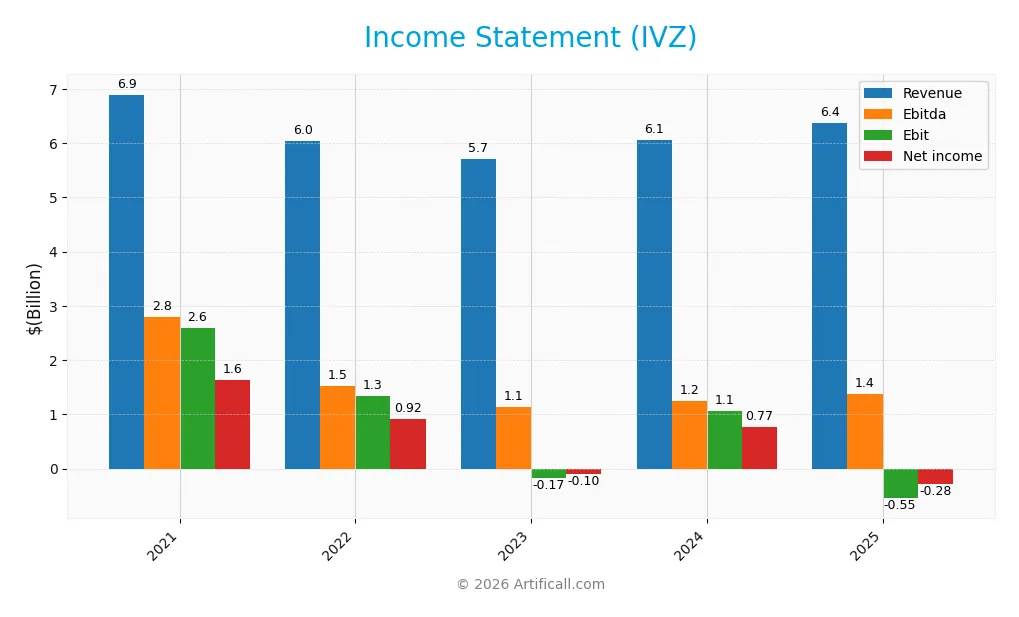
The table below summarizes Invesco Ltd.’s key income statement figures for fiscal years 2021 to 2025, showing trends in revenue, expenses, and profitability.
| 2021 | 2022 | 2023 | 2024 | 2025 | |
|---|---|---|---|---|---|
| Revenue | 6.89B | 6.05B | 5.72B | 6.07B | 6.38B |
| Cost of Revenue | 4.06B | 3.61B | 3.71B | 4.04B | 3.62B |
| Operating Expenses | 1.05B | 1.12B | 2.44B | 1.20B | 3.45B |
| Gross Profit | 2.83B | 2.44B | 2.01B | 2.03B | 2.75B |
| EBITDA | 2.80B | 1.53B | 1.13B | 1.24B | 1.38B |
| EBIT | 2.60B | 1.33B | -167M | 1.06B | -547M |
| Interest Expense | 95M | 85M | 71M | 58M | 83M |
| Net Income | 1.63B | 921M | -97M | 775M | -282M |
| EPS | 3.01 | 1.50 | -0.73 | 1.18 | -1.61 |
| Filing Date | 2022-02-18 | 2023-02-23 | 2024-02-21 | 2025-02-25 | 2026-02-24 |
Income Statement Evolution
From 2021 to 2025, Invesco’s revenue declined by 7.5%, with a slight 5.1% rebound in 2025. Gross profit improved sharply in 2025, up 35.8% year-over-year, lifting gross margin to a favorable 43.2%. However, EBIT and net income margins deteriorated significantly, reflecting rising costs and operational challenges.
Is the Income Statement Favorable?
The 2025 income statement shows revenue growth but a negative EBIT margin of -8.6% and net margin of -4.4%, both unfavorable. Despite a solid gross margin and controlled interest expense, operating expenses increased proportionally. Earnings per share plunged 235.6% year-over-year, resulting in a broadly unfavorable fundamental profile for the year.
Financial Ratios
The following table presents key financial ratios for Invesco Ltd. over the fiscal years 2021 through 2025:
| Ratios | 2021 | 2022 | 2023 | 2024 | 2025 |
|---|---|---|---|---|---|
| Net Margin | 24% | 15% | -2% | 13% | -4% |
| ROE | 11% | 6% | -1% | 5% | -2% |
| ROIC | 5% | 3% | -1% | 2% | -3% |
| P/E | 6.5 | 8.9 | -83.7 | 10.3 | -42.1 |
| P/B | 0.69 | 0.54 | 0.56 | 0.55 | 0.97 |
| Current Ratio | 1.25 | 1.62 | 1.27 | 3.14 | 0.31 |
| Quick Ratio | 1.25 | 1.62 | 1.27 | 3.14 | 0.31 |
| D/E | 0.63 | 0.56 | 0.62 | 0.52 | 0.88 |
| Debt-to-Assets | 30% | 29% | 31% | 28% | 40% |
| Interest Coverage | 18.9 | 15.5 | -6.2 | 14.3 | -8.4 |
| Asset Turnover | 0.21 | 0.20 | 0.20 | 0.22 | 0.24 |
| Fixed Asset Turnover | 13.3 | 10.8 | 9.5 | 12.7 | 0.0 |
| Dividend Yield | 5.1% | 6.9% | 7.3% | 7.6% | 3.2% |
Net margin and profitability ratios show volatility, with negative earnings in 2023 and 2025. The current ratio declined sharply in 2025, indicating liquidity risk. Interest coverage turns negative in 2023 and 2025, signaling stress servicing debt. Fixed asset turnover is zero in 2025, possibly reflecting asset reclassification or impairment. Dividend yield remains attractive but with payout volatility.
Evolution of Financial Ratios
Return on Equity (ROE) declined steadily, turning negative at -2.3% in 2025 from positive levels in earlier years. The Current Ratio fell sharply to 0.31, indicating reduced liquidity compared to above 1.2 in prior years. Debt-to-Equity Ratio rose moderately to 0.88, remaining relatively stable. Profitability showed marked deterioration, with net margins slipping into negative territory.
Are the Financial Ratios Favorable?
In 2025, profitability ratios are unfavorable with negative net margin and ROE. Liquidity is weak, as the Current and Quick Ratios are well below 1, signaling potential short-term solvency risks. Leverage ratios, including Debt-to-Equity at 0.88, are neutral but warrant monitoring. Market valuation metrics like Price-to-Book at 0.97 and Dividend Yield of 3.18% remain favorable. Overall, the financial ratios largely point to an unfavorable profile.
Shareholder Return Policy
Invesco Ltd. maintains a consistent dividend payment, with a yield around 3.18% in 2025 despite a negative net income that suggests coverage challenges. The dividend payout ratio is negative, implying dividends exceed reported earnings, which may strain sustainability.
The company also engages in share buybacks, reflecting a mixed approach to shareholder returns. Given the negative profitability and payout coverage concerns, this policy may raise questions about long-term value sustainability despite providing current income to shareholders.
Score analysis
The radar chart below visualizes key financial scores to assess Invesco Ltd.’s valuation and profitability metrics:
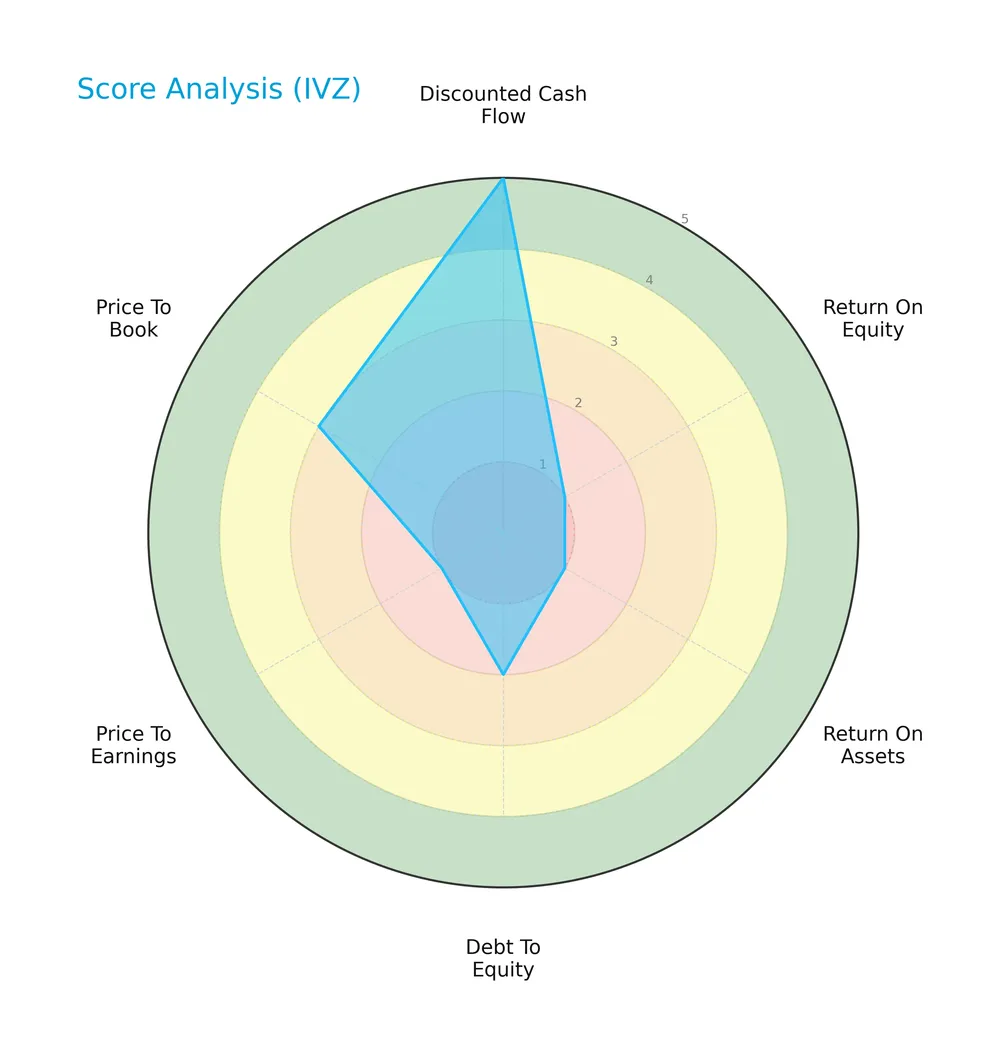
Invesco Ltd. shows a very favorable discounted cash flow score of 5 but scores very unfavorably on return on equity and assets (both 1). Debt-to-equity is unfavorable at 2, with price-to-earnings also very unfavorable at 1. Price-to-book stands at a moderate 3.
Analysis of the company’s bankruptcy risk
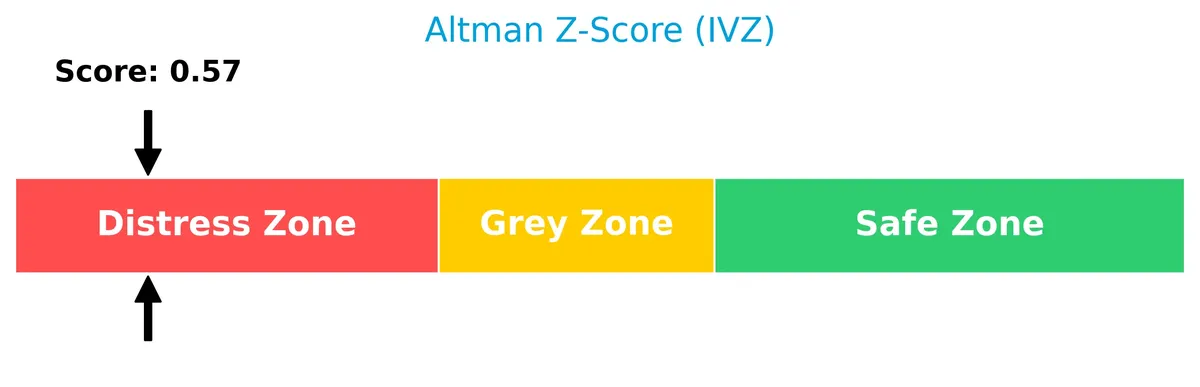
The Altman Z-Score places Invesco Ltd. in the distress zone, signaling a high risk of financial distress and possible bankruptcy:
Is the company in good financial health?
The Piotroski Score diagram highlights Invesco Ltd.’s average financial health status:

With a Piotroski score of 5, the company demonstrates moderate financial strength but lacks the robustness seen in stronger value investments.
Competitive Landscape & Sector Positioning
This sector analysis explores Invesco Ltd.’s strategic positioning, revenue streams, and key products. I will examine its main competitors and assess its competitive advantages. Next, I will evaluate whether Invesco holds a sustainable edge over its rivals.
Strategic Positioning
Invesco Ltd. maintains a diversified product portfolio focused on investment advice, distribution, and financial services, with $4.35B revenue from investment advice in 2024. Geographically, it concentrates heavily in the Americas ($4.65B), with moderate exposure in EMEA ($1.14B) and Asia ($271M), reflecting a concentrated yet globally spread presence.
Revenue by Segment
This pie chart displays Invesco Ltd.’s revenue distribution by business segment for the fiscal year 2024, highlighting the relative contribution of each segment to total revenue.
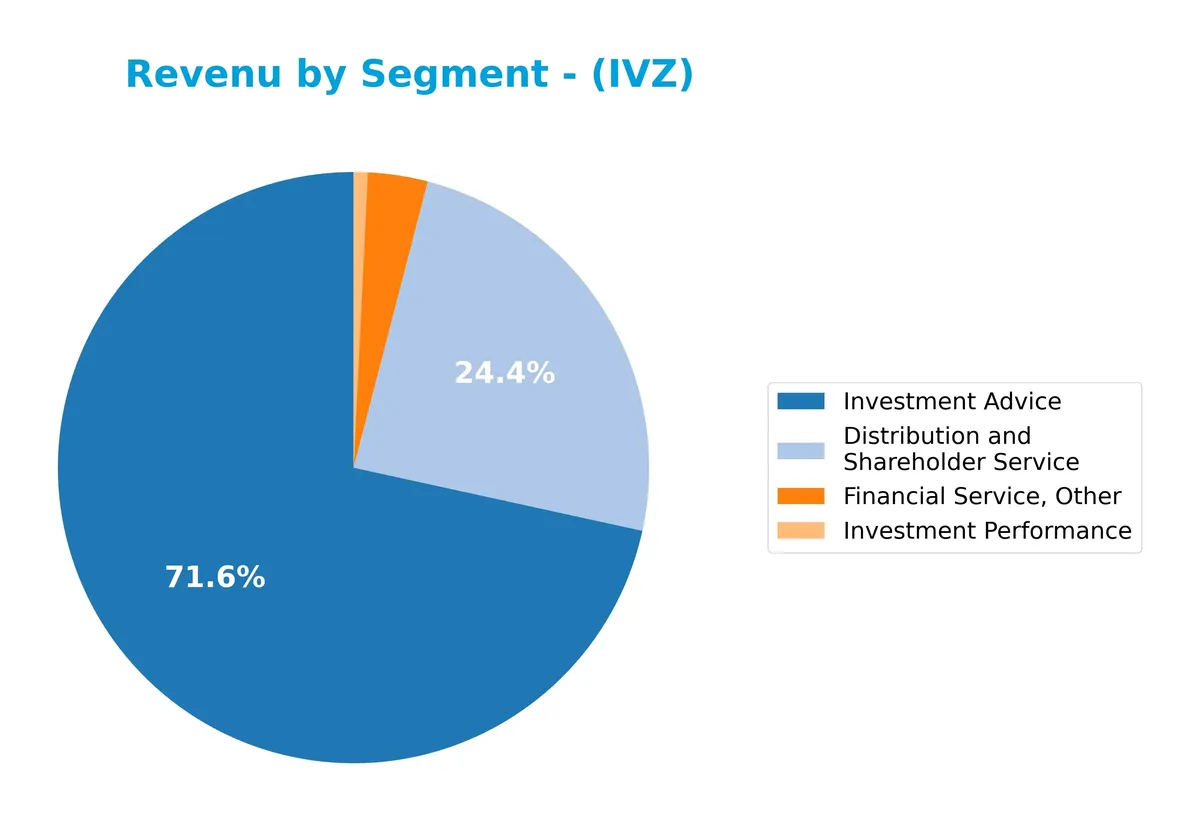
Invesco’s revenue heavily depends on Investment Advice, which generated $4.34B in 2024, showing steady growth after a dip in 2021. Distribution and Shareholder Service remains the second largest segment at $1.48B, recovering from a slight decline in prior years. Financial Service, Other, and Investment Performance contribute marginally, with $199M and $46M respectively, indicating concentration risk in core advisory services. The 2024 figures suggest cautious acceleration in advisory revenues amid stability in other segments.
Key Products & Brands
Below is a summary of Invesco Ltd.’s key products and services generating revenue:
| Product | Description |
|---|---|
| Investment Advice | Provides portfolio management and advisory services for equity, fixed income, and alternative assets. |
| Distribution and Shareholder Service | Supports mutual funds, ETFs, and private funds through distribution and client servicing. |
| Financial Service, Other | Includes ancillary financial services beyond core investment advice and distribution. |
| Investment Performance | Revenue derived from performance fees linked to investment fund returns. |
Invesco’s revenue mainly stems from investment advice and distribution services. The firm offers diversified asset management solutions across public and alternative markets, reflecting its broad client base and product mix.
Main Competitors
Invesco Ltd. faces 11 competitors in the Asset Management industry; here are the top 10 leaders by market capitalization:
| Competitor | Market Cap. |
|---|---|
| Blackstone Inc. | 191B |
| BlackRock, Inc. | 168B |
| KKR & Co. Inc. | 115B |
| The Bank of New York Mellon Corporation | 82B |
| Ares Management Corporation | 55B |
| Ameriprise Financial, Inc. | 46B |
| State Street Corporation | 36B |
| Northern Trust Corporation | 26B |
| T. Rowe Price Group, Inc. | 23B |
| Franklin Resources, Inc. | 12B |
Invesco Ltd. ranks 11th, holding only 6.12% of the market cap of Blackstone Inc., the sector leader. It sits below both the average market cap of the top 10 competitors (75B) and the sector median (46B). The company is 6.33% smaller than its next closest competitor, Franklin Resources, highlighting a notable gap in scale.
Comparisons with competitors
Check out how we compare the company to its competitors:
Does Invesco Ltd. have a competitive advantage?
Invesco Ltd. currently lacks a competitive advantage, as its ROIC is significantly below its WACC, indicating value destruction and declining profitability over 2021-2025. This situation signals inefficient capital use and weak economic moat compared to industry peers.
Looking ahead, Invesco’s broad product range across equities, fixed income, and alternative markets provides opportunities for growth in diverse client segments. Expansion in global markets, especially in Asia and EMEA, could improve scale and margins if operational challenges are addressed.
SWOT Analysis
This SWOT analysis highlights Invesco Ltd.’s key internal and external factors affecting its strategic positioning.
Strengths
- Diversified global client base
- Strong dividend yield (3.18%)
- Favorable gross margin (43.18%)
Weaknesses
- Negative net margin (-4.42%)
- Declining ROIC vs WACC, value destruction
- Low liquidity ratios (current ratio 0.31)
Opportunities
- Expansion in emerging markets
- Growth in alternative investment products
- Leveraging quantitative strategies
Threats
- Rising competition in asset management
- Market volatility impacting fees
- Regulatory and interest rate risks
Invesco’s strong operational base contrasts sharply with its profitability and liquidity challenges. The firm must focus on reversing value destruction and improving efficiency to capitalize on growth opportunities amid a competitive, volatile landscape.
Stock Price Action Analysis
The following weekly chart illustrates Invesco Ltd. (IVZ) stock price movements over the past 100 weeks, capturing key highs, lows, and recent volatility:
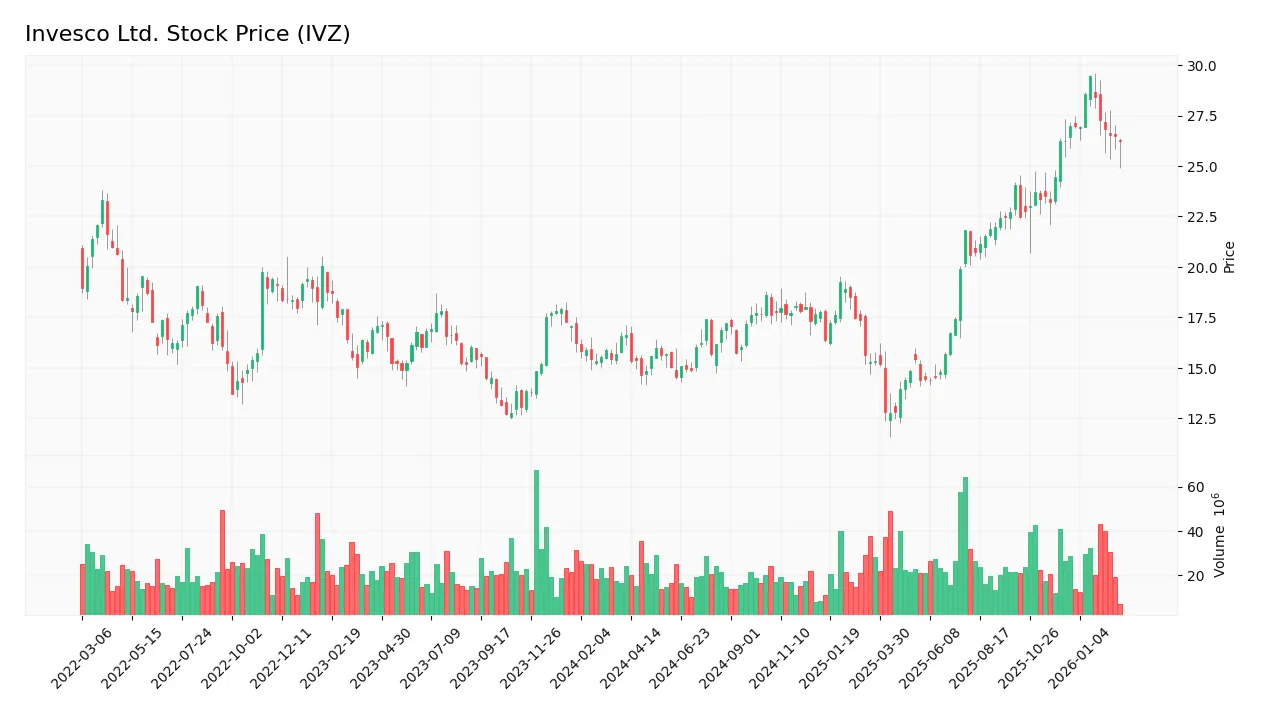
Trend Analysis
Over the past 12 months, IVZ stock gained 57.63%, reflecting a strong bullish trend despite decelerating momentum. The price ranged between 12.78 and 29.44, with volatility at a moderate 4.25%. However, from December 2025 to March 2026, the trend flattened, showing a negligible -0.06% change and slight negative slope, indicating short-term neutral to bearish pressure.
Volume Analysis
Total trading volume increased steadily to 2.79B shares, with buyers accounting for 61.6%, signaling buyer-driven momentum overall. Contrastingly, in the recent three months ending March 2026, seller volume dominated at 61.5%, with declining buyer participation, suggesting weakening bullish sentiment and cautious investor engagement.
Target Prices
Analysts set a clear target consensus for Invesco Ltd., signaling moderate upside potential.
| Target Low | Target High | Consensus |
|---|---|---|
| 24 | 34.5 | 29.8 |
The target range suggests analysts expect Invesco’s shares to trade between $24 and $34.5, with a consensus near $29.8, reflecting cautious optimism.

Don’t Let Luck Decide Your Entry Point
Optimize your entry points with our advanced ProRealTime indicators. You’ll get efficient buy signals with precise price targets for maximum performance. Start outperforming now!
Analyst & Consumer Opinions
This section reviews recent analyst ratings and consumer feedback concerning Invesco Ltd., highlighting key market perspectives.
Stock Grades
Here is the latest summary of verified analyst grades for Invesco Ltd. from recognized firms:
| Grading Company | Action | New Grade | Date |
|---|---|---|---|
| Goldman Sachs | Maintain | Neutral | 2026-02-12 |
| Goldman Sachs | Maintain | Neutral | 2026-01-28 |
| Barclays | Maintain | Equal Weight | 2026-01-28 |
| RBC Capital | Maintain | Outperform | 2026-01-28 |
| Argus Research | Maintain | Buy | 2026-01-28 |
| RBC Capital | Upgrade | Outperform | 2026-01-21 |
| JP Morgan | Maintain | Neutral | 2026-01-20 |
| Barclays | Maintain | Equal Weight | 2026-01-15 |
| Morgan Stanley | Maintain | Equal Weight | 2025-12-17 |
| Deutsche Bank | Upgrade | Buy | 2025-12-17 |
The consensus grades show a stable outlook with most firms maintaining neutral or equal weight ratings. Notable upgrades from Deutsche Bank and RBC Capital suggest selective optimism within the analyst community.
Consumer Opinions
Invesco Ltd. sparks mixed reactions among its clients, reflecting diverse experiences with its investment services.
| Positive Reviews | Negative Reviews |
|---|---|
| Transparent communication on portfolio changes | Customer service response times are slow |
| Competitive fee structure for mutual funds | Mobile app occasionally glitches |
| Strong performance in diversified ETFs | Limited product options for niche investors |
| User-friendly online platform | Some clients find reporting tools complex |
Overall, consumers praise Invesco for transparency and competitive fees but frequently cite customer service delays and tech issues as areas needing improvement. This feedback highlights operational friction despite solid investment offerings.
Risk Analysis
Below is a concise overview of Invesco Ltd.’s primary risks, assessing likelihood and potential impact:
| Category | Description | Probability | Impact |
|---|---|---|---|
| Financial Health | Altman Z-Score at 0.57 signals high bankruptcy risk. | High | Severe |
| Profitability | Negative net margin (-4.42%) and ROE (-2.3%) indicate losses. | High | High |
| Liquidity | Current ratio 0.31 warns of poor short-term asset coverage. | High | Moderate |
| Debt Management | Interest coverage negative (-6.63) risks financial distress. | Medium | High |
| Market Volatility | Beta of 1.66 suggests high sensitivity to market swings. | High | Moderate |
| Valuation | Despite weak fundamentals, P/B of 0.97 suggests undervaluation. | Medium | Moderate |
Invesco faces critical financial risks, notably its distress-zone Altman Z-Score and consistent losses. Liquidity and interest coverage weaknesses heighten bankruptcy risk. Market volatility may exacerbate share price swings. Prudent risk management remains essential.
Should You Buy Invesco Ltd.?
Invesco Ltd. appears to be facing a very unfavorable moat with declining ROIC, suggesting value destruction. While its leverage profile raises caution, the profitability and financial strength could be seen as weak, reflected in a conservative C+ rating overall.
Strength & Efficiency Pillars
Invesco Ltd. posts a gross margin of 43.18%, showing operational efficiency in revenue generation. Interest expense remains low at 1.29%, supporting manageable financing costs. However, profitability indicators falter with a negative net margin of -4.42%, ROE of -2.3%, and ROIC of -3.16%, all unfavorable. The firm’s ROIC (-3.16%) falls well below its WACC (7.12%), signaling that Invesco is currently destroying value rather than creating it.
Weaknesses and Drawbacks
Invesco is in financial distress, as the Altman Z-Score stands at a perilous 0.57, far below the 1.8 distress threshold. This metric trumps all profitability concerns and suggests a high bankruptcy risk. Additional red flags include a critically low current ratio of 0.31, indicating liquidity constraints. The interest coverage ratio is deeply negative at -6.63, underscoring difficulty in servicing debt. Despite a modest debt-to-equity ratio of 0.88, the firm’s weak profitability and liquidity pose significant solvency challenges. Recent seller dominance (38.5% buyers) adds short-term market pressure.
Our Final Verdict about Invesco Ltd.
Despite pockets of operational efficiency, Invesco’s solvency position is highly precarious with an Altman Z-Score in the distress zone at 0.57. This elevates the investment risk to a level I consider highly speculative. Until the company addresses its liquidity and profitability issues, the profile remains too risky for conservative capital, regardless of the broader bullish long-term market trend.
Disclaimer: This content is for informational purposes only and does not constitute financial, investment, or other professional advice. Investing in financial markets involves a significant risk of loss, and past performance is not indicative of future results.
Additional Resources
- Invesco Ltd. SEC 10-K Report – TradingView (Feb 24, 2026)
- Invesco Ltd. (IVZ) Announces New $1 Billion Share Repurchase Pla – GuruFocus (Feb 24, 2026)
- Fund Update: New $230.4M $IVZ stock position opened by Invesco Ltd. – Quiver Quantitative (Feb 19, 2026)
- Vanguard Group Inc. Raises Position in Invesco Ltd. $IVZ – MarketBeat (Feb 22, 2026)
- Invesco Gains 16.6% in 3 Months: How to Play the Stock Now – Finviz (Feb 18, 2026)
For more information about Invesco Ltd., please visit the official website: invesco.com