Home > Analyses > Healthcare > Intuitive Surgical, Inc.
Intuitive Surgical transforms how surgeons perform complex operations by pioneering minimally invasive technologies. Its da Vinci Surgical System revolutionizes patient care with precision robotics, while the Ion endoluminal system expands diagnostic capabilities in lung biopsies. Renowned for innovation and quality, Intuitive commands a dominant position in medical instruments. As healthcare evolves rapidly, I ask: do Intuitive’s fundamentals justify its lofty valuation and promise sustainable growth?
Table of contents
Business Model & Company Overview
Intuitive Surgical, Inc. stands as a leader in the medical instruments and supplies sector, headquartered in Sunnyvale, California. Founded in 1995, the company drives innovation through its core business: the da Vinci Surgical System, which revolutionizes minimally invasive surgery. Its ecosystem extends to the Ion endoluminal system, advanced stapling and energy instruments, and integrated digital platforms that enhance surgical precision and outcomes.
The company’s revenue engine balances high-margin hardware sales with recurring services including installation, maintenance, and customer support. It commands a strategic presence across the Americas, Europe, and Asia, broadening access to advanced surgical care. Intuitive Surgical’s competitive advantage lies in its comprehensive technology suite and global footprint, shaping the future of minimally invasive procedures with a robust economic moat.
Financial Performance & Fundamental Metrics
I analyze Intuitive Surgical, Inc.’s income statement, key financial ratios, and dividend payout policy to assess its core financial health and shareholder returns.
Income Statement
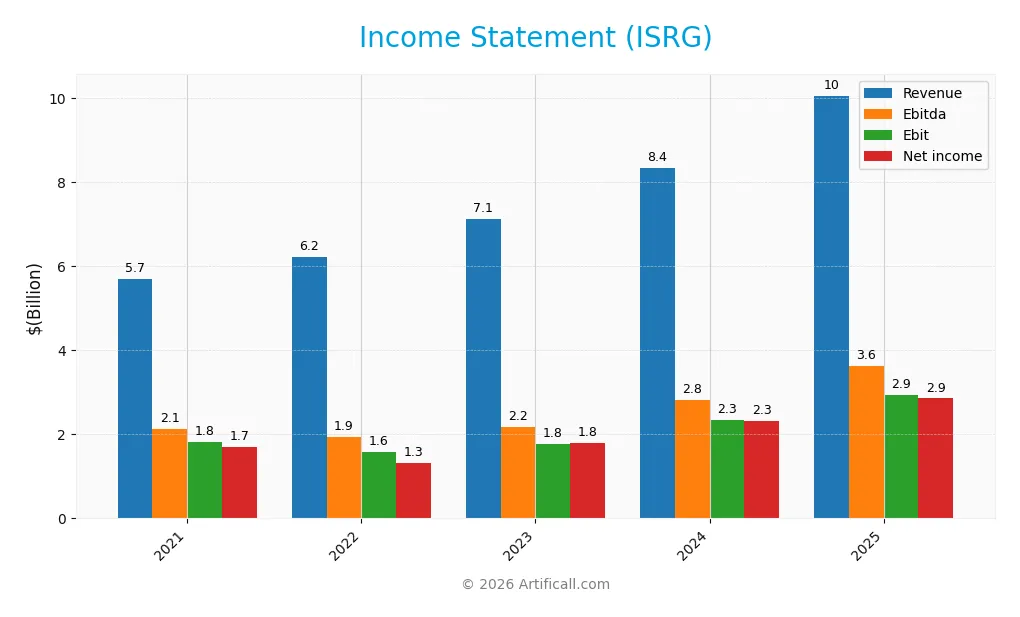
Below is Intuitive Surgical, Inc.’s income statement summary for fiscal years 2021 through 2025, showing key profitability metrics and earnings per share.
| 2021 | 2022 | 2023 | 2024 | 2025 | |
|---|---|---|---|---|---|
| Revenue | 5.71B | 6.22B | 7.12B | 8.35B | 10.06B |
| Cost of Revenue | 1.75B | 2.03B | 2.39B | 2.72B | 3.42B |
| Operating Expenses | 2.14B | 2.62B | 2.96B | 3.29B | 3.70B |
| Gross Profit | 3.96B | 4.20B | 4.73B | 5.63B | 6.64B |
| EBITDA | 2.13B | 1.94B | 2.17B | 2.81B | 3.62B |
| EBIT | 1.82B | 1.58B | 1.77B | 2.35B | 2.95B |
| Interest Expense | 0 | 0 | 0 | 0 | 0 |
| Net Income | 1.70B | 1.32B | 1.80B | 2.32B | 2.86B |
| EPS | 4.79 | 3.72 | 5.12 | 6.54 | 8.00 |
| Filing Date | 2022-02-03 | 2023-02-10 | 2024-01-31 | 2025-01-31 | 2026-02-03 |
Income Statement Evolution
Intuitive Surgical’s revenue grew 76% from 2021 to 2025, with a 20.5% increase in the last year alone. Net income expanded 68% over five years, although net margin declined slightly by 4.9%. Gross and EBIT margins remained robust at 66% and 29.3%, respectively, signaling sustained operational efficiency.
Is the Income Statement Favorable?
The 2025 income statement shows strong fundamentals with a 28.4% net margin and zero interest expense, reflecting efficient capital structure. Revenue and EBIT grew over 20%, while EPS jumped 22.6%, indicating solid profitability growth. Despite a slight net margin dip, overall metrics signal a favorable income profile for the company.
Financial Ratios
The table below presents key financial ratios for Intuitive Surgical, Inc. (ISRG) over the last five fiscal years, illustrating profitability, liquidity, leverage, and valuation metrics:
| Ratios | 2021 | 2022 | 2023 | 2024 | 2025 |
|---|---|---|---|---|---|
| Net Margin | 30% | 21% | 25% | 28% | 28% |
| ROE | 14% | 12% | 14% | 14% | 16% |
| ROIC | 13% | 11% | 12% | 12% | 14% |
| P/E | 75.1x | 71.4x | 65.9x | 79.8x | 70.8x |
| P/B | 10.7x | 8.5x | 8.9x | 11.3x | 11.3x |
| Current Ratio | 5.1x | 4.4x | 4.8x | 4.1x | 4.9x |
| Quick Ratio | 4.6x | 3.8x | 4.0x | 3.2x | 4.0x |
| D/E | 0.007 | 0.000 | 0.000 | 0.009 | 0.017 |
| Debt-to-Assets | 0.6% | 0.0% | 0.0% | 0.8% | 1.5% |
| Interest Coverage | 0x | 0x | 0x | 0x | 0x |
| Asset Turnover | 0.42x | 0.48x | 0.46x | 0.44x | 0.49x |
| Fixed Asset Turnover | 3.0x | 2.6x | 2.0x | 1.7x | 1.9x |
| Dividend Yield | 0% | 0% | 0% | 0% | 0% |
*All ratios are rounded to nearest whole number or one decimal place.*
Evolution of Financial Ratios
Return on Equity (ROE) steadily improved from 12.0% in 2022 to 16.0% in 2025, reflecting enhanced profitability. The Current Ratio rose from 4.40 to 4.87, indicating strengthened liquidity. Debt-to-Equity Ratio remained consistently low, below 0.02, highlighting minimal leverage and financial conservatism. Profit margins showed stable growth, with net margin reaching 28.4% in 2025.
Are the Financial Ratios Favorable?
Profitability ratios such as net margin (28.4%) and ROE (16.0%) rate favorable, outperforming typical sector benchmarks. Liquidity is mixed: the quick ratio is favorable at 3.96, but the high current ratio (4.87) suggests possible inefficient asset use. Leverage remains minimal and favorable with a debt-to-equity of 0.02. Valuation multiples like PE (70.8) and PB (11.3) appear elevated and unfavorable. Overall, the ratios are slightly favorable but warrant caution on valuation and asset efficiency.
Shareholder Return Policy
Intuitive Surgical, Inc. does not pay dividends, reflecting a reinvestment strategy focused on growth and innovation. The company maintains strong free cash flow and operating cash flow, supporting capital expenditures and potential share repurchases.
Share buybacks are part of the return policy, aligning with long-term value creation by optimizing capital allocation. This approach prioritizes sustainable growth over immediate cash returns, consistent with industry practices for high-margin, technology-driven firms.
Score analysis
The radar chart below illustrates Intuitive Surgical’s key financial scores and valuation metrics:
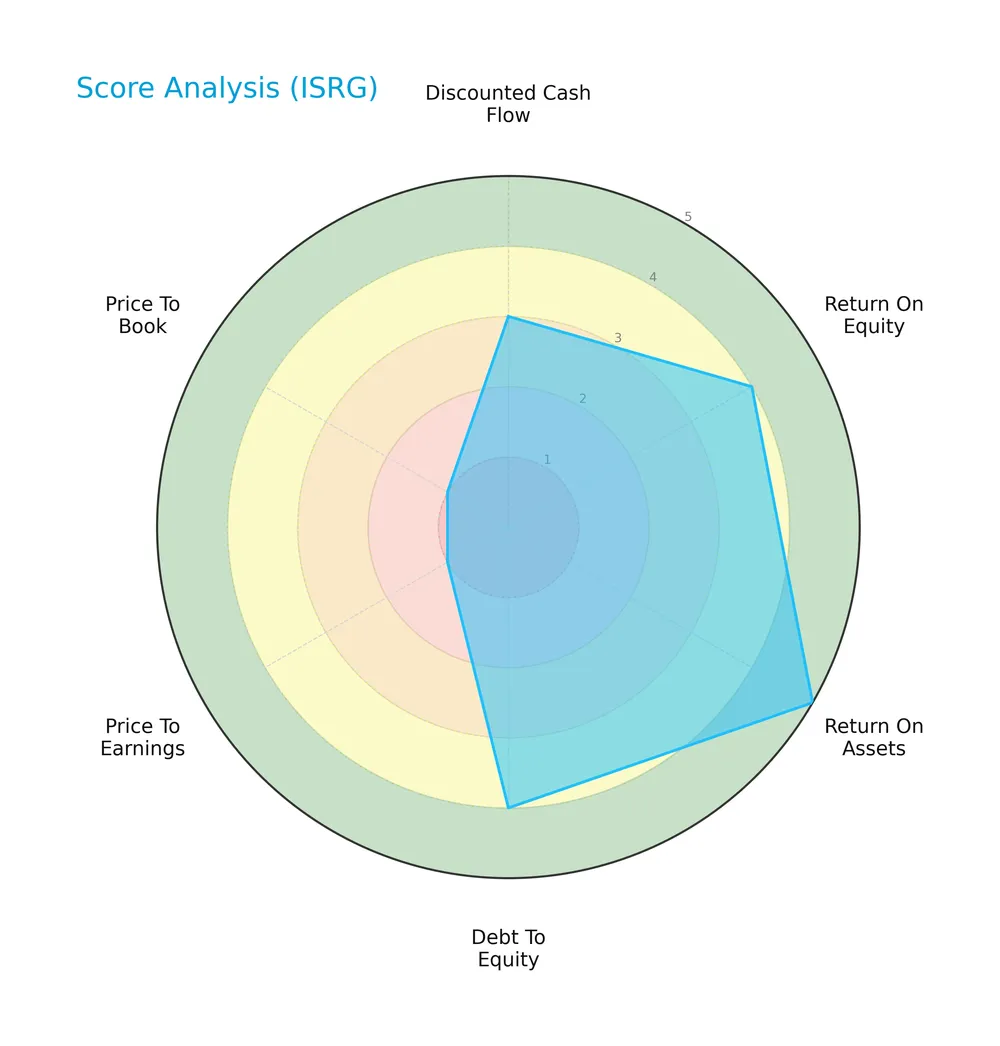
Intuitive Surgical scores well on return on equity (4) and assets (5), and maintains favorable debt-to-equity (4). However, valuation ratios show weakness, with very unfavorable price-to-earnings (1) and price-to-book (1) scores.
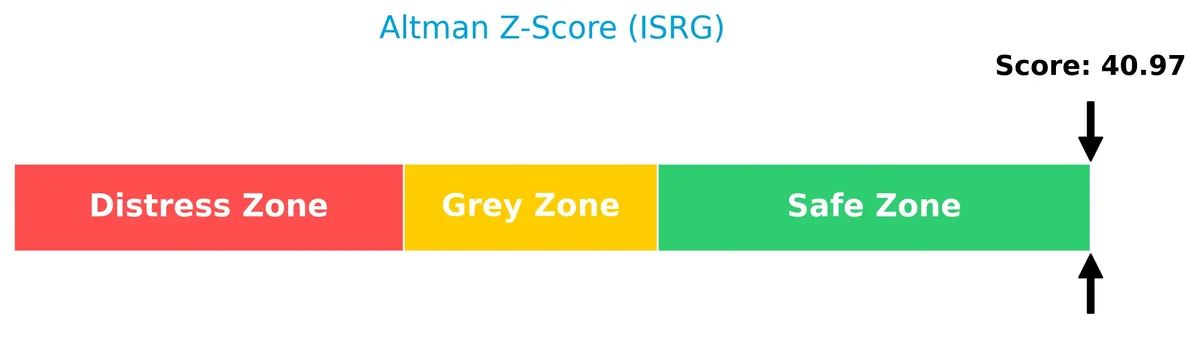
Analysis of the company’s bankruptcy risk
The Altman Z-Score indicates Intuitive Surgical is in the safe zone, signaling a very low bankruptcy risk:
Is the company in good financial health?
The Piotroski Score chart highlights Intuitive Surgical’s strong financial health based on profitability, leverage, and efficiency metrics:

With a score of 7, the company demonstrates robust financial strength, suggesting it manages resources effectively and sustains operational stability.
Competitive Landscape & Sector Positioning
This section examines Intuitive Surgical’s strategic positioning, revenue segments, key products, and main competitors. I will assess whether the company holds a competitive advantage within the medical instruments and supplies sector.
Strategic Positioning
Intuitive Surgical, Inc. concentrates on minimally invasive surgical systems and related instruments, with 2024 revenues dominated by Instruments & Accessories at $5.08B and Systems at $1.97B. Its product portfolio focuses on advanced surgical technology, complemented by growing service offerings totaling $1.31B.
Revenue by Segment
This pie chart illustrates Intuitive Surgical’s revenue distribution by product segments for fiscal year 2024, highlighting the relative contribution of each segment to total sales.
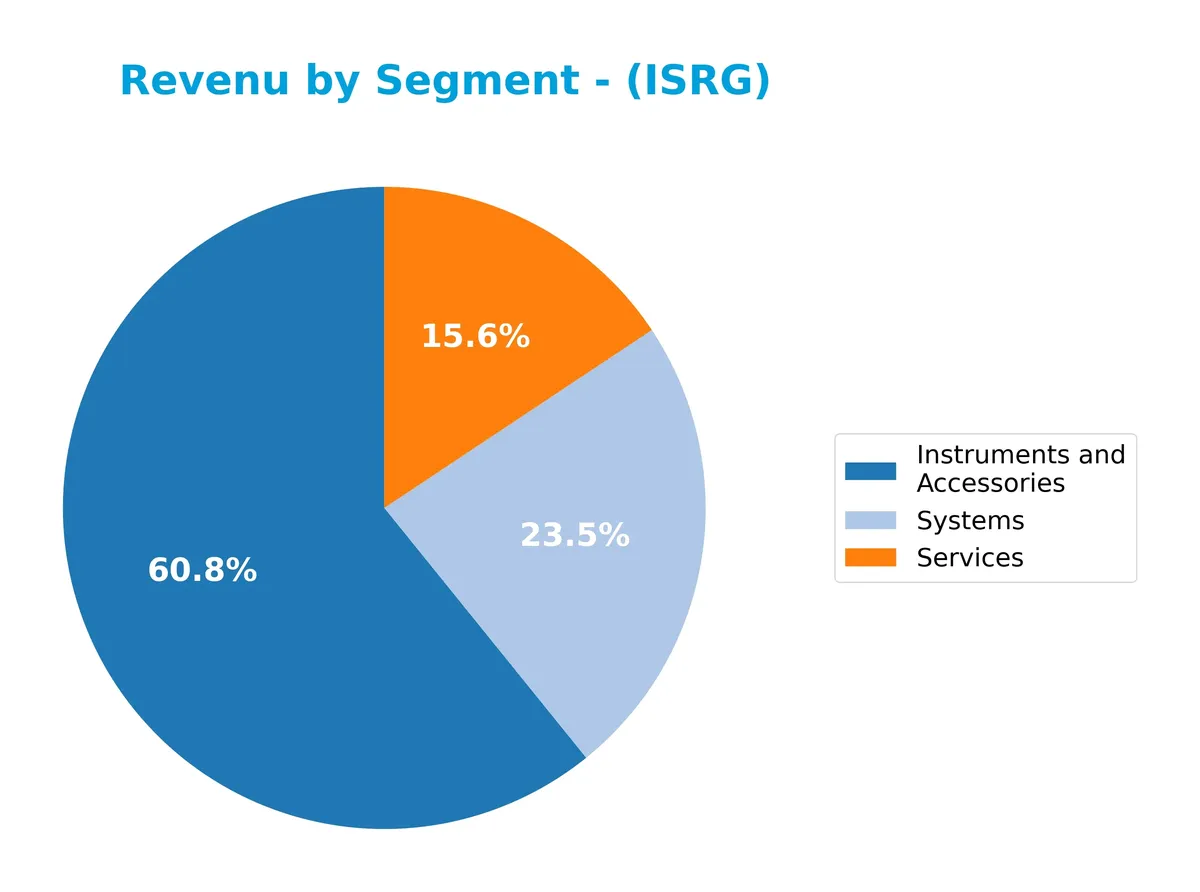
In 2024, Instruments and Accessories dominate revenue with $5.1B, reflecting steady growth from $4.3B in 2023. Systems contribute $2.0B, showing moderate expansion. Services, while the smallest at $1.3B, also grow consistently. The trend reveals a clear reliance on Instruments and Accessories, signaling concentration risk if innovation slows. The steady rise across all segments underscores robust demand and effective capital allocation in a competitive medtech market.
Key Products & Brands
The following table outlines Intuitive Surgical’s primary products and brands with brief descriptions:
| Product | Description |
|---|---|
| da Vinci Surgical System | A robotic platform enabling complex surgeries through minimally invasive techniques. |
| Ion Endoluminal System | A diagnostic tool for minimally invasive lung biopsies, expanding beyond surgical applications. |
| Instruments and Accessories | Surgical tools and stapling, energy, and core instrumentation designed for use with Intuitive’s systems. |
| Services | Support offerings including installation, repair, maintenance, and educational programs for technology users. |
Intuitive Surgical’s portfolio centers on advanced robotic surgical systems and complementary instruments. Their expanding diagnostic platform diversifies revenue streams while comprehensive service offerings support customer retention and operational efficiency.
Main Competitors
Intuitive Surgical, Inc. faces 8 main competitors, with the table below listing the top 8 leaders by market capitalization:
| Competitor | Market Cap. |
|---|---|
| Intuitive Surgical, Inc. | 201B |
| Becton, Dickinson and Company | 56B |
| ResMed Inc. | 36B |
| West Pharmaceutical Services, Inc. | 20B |
| Hologic, Inc. | 16.6B |
| The Cooper Companies, Inc. | 16.1B |
| Baxter International Inc. | 10B |
| AptarGroup, Inc. | 8.1B |
Intuitive Surgical ranks 1st among its 8 competitors, with a market cap 87.8% the size of the sector leader. The company stands well above both the average market cap of the top 10 competitors (45.4B) and the sector median (18.3B). It maintains a substantial gap, exceeding 214% in market cap, from its closest rival below in size.
Comparisons with competitors
Check out how we compare the company to its competitors:
Does Intuitive Surgical have a competitive advantage?
Intuitive Surgical demonstrates a strong competitive advantage with a very favorable moat. Its ROIC exceeds WACC by over 2%, indicating efficient capital use and consistent value creation.
Looking ahead, the company expands beyond surgery with the Ion endoluminal system for minimally invasive lung biopsies. This diversification opens new markets and growth opportunities in diagnostics.
SWOT Analysis
This SWOT analysis highlights Intuitive Surgical’s core competitive position and strategic challenges.
Strengths
- strong moat with ROIC well above WACC
- robust revenue growth of 20.5% in 2025
- high net margin of 28.4%
Weaknesses
- very high valuation multiples (PE 70.8, PB 11.3)
- low asset turnover (0.49) signals underutilized assets
- no dividend yield to attract income investors
Opportunities
- expanding minimally invasive surgery market
- growth in diagnostic procedures with Ion system
- digital integration improving hospital workflow
Threats
- intense competition in medical robotics
- regulatory risks and approval delays
- economic downturn impacting hospital capital spending
Intuitive Surgical demonstrates a durable competitive advantage and strong profitability. However, sky-high valuations and operational inefficiencies pose concerns. The company must capitalize on growth opportunities while navigating regulatory and competitive risks prudently.
Stock Price Action Analysis
The following weekly chart depicts Intuitive Surgical, Inc.’s stock price movements and key levels over the past 12 months:
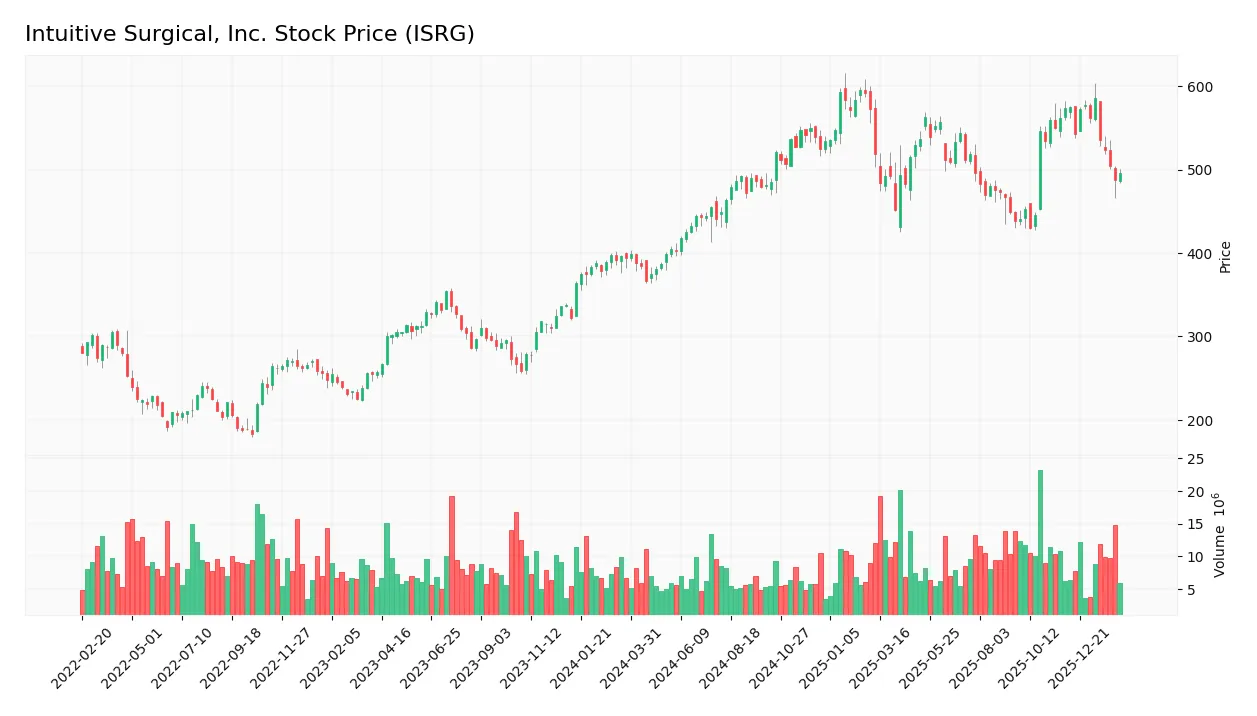
Trend Analysis
Over the past 12 months, ISRG’s stock gained 25.9%, indicating a bullish trend despite decelerating momentum. The price ranged between 366.34 and a high of 595.55. Recent months show a 13.49% decline, signaling short-term weakness. Volatility remains elevated with a 57.98 standard deviation overall.
Volume Analysis
Trading volume has increased overall, with buyers accounting for 51.87% of total activity, suggesting moderate buyer dominance. However, in the last three months, sellers slightly dominated at 57.8M versus 43.1M buyer volume. This shift points to cautious investor sentiment amid recent price weakness.
Target Prices
Analysts set a solid target consensus for Intuitive Surgical, Inc., reflecting optimistic growth prospects.
| Target Low | Target High | Consensus |
|---|---|---|
| 550 | 750 | 641.25 |
The target range indicates confidence in ISRG’s potential, with a consensus near 641 signaling steady upside from current levels.

Don’t Let Luck Decide Your Entry Point
Optimize your entry points with our advanced ProRealTime indicators. You’ll get efficient buy signals with precise price targets for maximum performance. Start outperforming now!
Analyst & Consumer Opinions
I will review Intuitive Surgical, Inc.’s analyst ratings and consumer feedback to provide a balanced perspective.
Stock Grades
Here are the latest verified grades from established financial institutions for Intuitive Surgical, Inc.:
| Grading Company | Action | New Grade | Date |
|---|---|---|---|
| Freedom Capital Markets | Buy | Buy | 2026-01-27 |
| Barclays | Maintain | Overweight | 2026-01-26 |
| Citigroup | Maintain | Neutral | 2026-01-23 |
| Bernstein | Maintain | Outperform | 2026-01-23 |
| Piper Sandler | Maintain | Overweight | 2026-01-23 |
| Evercore ISI Group | Maintain | In Line | 2026-01-23 |
| BTIG | Maintain | Buy | 2026-01-23 |
| Bernstein | Maintain | Outperform | 2026-01-09 |
| Barclays | Maintain | Overweight | 2026-01-07 |
| BTIG | Maintain | Buy | 2026-01-07 |
The consensus leans toward a positive outlook, with multiple firms maintaining Buy or Overweight ratings. Freedom Capital Markets recently upgraded the stock, signaling growing confidence.
Consumer Opinions
Intuitive Surgical, Inc. commands strong consumer interest, with users frequently praising its innovation and reliability.
| Positive Reviews | Negative Reviews |
|---|---|
| “The robotic surgery systems greatly improve surgical precision.” | “High cost of equipment limits accessibility for smaller hospitals.” |
| “Excellent technical support and training programs for surgeons.” | “Some users report occasional software glitches during procedures.” |
| “Consistent improvements in product design enhance usability.” | “Long installation and setup times can disrupt hospital workflows.” |
Overall, consumers applaud Intuitive Surgical for its cutting-edge technology and robust support. However, cost barriers and operational hiccups remain recurring concerns.
Risk Analysis
Below is a table summarizing Intuitive Surgical’s key risks with their likelihood and potential impact:
| Category | Description | Probability | Impact |
|---|---|---|---|
| Valuation Risk | Elevated PE (70.78) and PB (11.34) suggest the stock trades at a premium. | High | High |
| Market Volatility | Beta of 1.66 indicates above-average sensitivity to market swings. | Medium | Medium |
| Competitive Risk | Innovation pace in medical instruments may challenge market leadership. | Medium | High |
| Operational Risk | Asset turnover of 0.49 signals underutilization of assets, limiting growth. | Medium | Medium |
| Dividend Policy | No dividends might deter income-focused investors during market downturns. | High | Low |
| Debt and Liquidity | Strong liquidity (current ratio 4.87) but flagged unfavorable; may mask inefficiencies. | Low | Low |
Intuitive Surgical’s greatest concerns stem from sky-high valuation multiples and market volatility. The stock’s 2026 premium pricing demands continued growth to justify investor optimism. Its robust liquidity and minimal debt provide a buffer, but competitive innovation remains a pivotal risk.
Should You Buy Intuitive Surgical, Inc.?
Intuitive Surgical appears to be a robust operator with a durable moat supported by growing ROIC well above WACC. Its leverage profile remains manageable, enhancing operational efficiency. Despite valuation challenges, the overall B+ rating suggests a very favorable financial health profile.
Strength & Efficiency Pillars
Intuitive Surgical, Inc. delivers robust operational efficiency, reflected in a net margin of 28.38% and return on equity of 16.02%. Its return on invested capital (ROIC) stands at 13.71%, surpassing the weighted average cost of capital (WACC) at 11.58%, confirming the company as a clear value creator. The firm’s strong gross margin of 66.0% and a favorable EBIT margin of 29.27% underpin sustainable profitability. I observe growing ROIC trends, signaling a durable moat and consistent value creation over time.
Weaknesses and Drawbacks
Despite operational strength, Intuitive Surgical faces valuation headwinds. The price-to-earnings ratio at 70.78 and price-to-book ratio of 11.34 indicate a richly priced stock, raising concerns about premium valuation risk. The current ratio of 4.87, while seemingly high, is flagged as unfavorable due to potential inefficiency in asset utilization. Additionally, the recent period shows a slightly seller-dominant market behavior with only 42.74% buyer dominance, suggesting short-term market pressure that could affect near-term price momentum.
Our Final Verdict about Intuitive Surgical, Inc.
The company exhibits a strong fundamental profile with clear value creation and operational excellence. However, despite the overall bullish long-term trend, recent seller dominance and elevated valuation metrics suggest a cautious stance. For investors, Intuitive Surgical may appear attractive for long-term exposure but could warrant a wait-and-see approach to capture a more favorable entry point amid short-term market pressures.
Disclaimer: This content is for informational purposes only and does not constitute financial, investment, or other professional advice. Investing in financial markets involves a significant risk of loss, and past performance is not indicative of future results.
Additional Resources
- Midwest Trust Co Grows Holdings in Intuitive Surgical, Inc. $ISRG – MarketBeat (Feb 11, 2026)
- Should You Buy ISRG Stock Despite a 13% Fall in Three Months? – The Globe and Mail (Feb 11, 2026)
- Intuitive Surgical, Inc. (ISRG) Is a Trending Stock: Facts to Know Before Betting on It – Yahoo Finance (Feb 06, 2026)
- Rhumbline Advisers Sells 3,628 Shares of Intuitive Surgical, Inc. $ISRG – MarketBeat (Feb 11, 2026)
- ISRG Intuitive Surgical (NASDAQ) pre-market $488.15 09 Feb 2026: AI stocks outlook – Meyka (Feb 09, 2026)
For more information about Intuitive Surgical, Inc., please visit the official website: intuitive.com