Home > Analyses > Technology > Intuit Inc.
Intuit Inc. transforms how millions manage their finances daily, seamlessly blending technology with personal and business financial needs. As a dominant force in software applications, Intuit leads with flagship products like QuickBooks and TurboTax, renowned for their innovation and user-friendly design. Its expanding ecosystem, including Credit Karma and ProConnect, strengthens its market influence. Yet, amid evolving competition and economic shifts, the question remains: does Intuit’s robust foundation still warrant its premium valuation and growth expectations?

Table of contents
Business Model & Company Overview
Intuit Inc., founded in 1983 and headquartered in Mountain View, California, stands as a dominant player in the software application sector. Its ecosystem spans financial management and compliance tools for consumers, small businesses, self-employed professionals, and accountants across the US, Canada, and beyond. This integrated suite includes QuickBooks, TurboTax, Credit Karma, and ProConnect, which together form a cohesive platform simplifying complex financial tasks.
The company’s revenue engine balances cloud-based software, desktop solutions, and recurring services, driven by offerings like QuickBooks Online Advanced and TurboTax. Intuit’s strategic footprint covers the Americas, Europe, and Asia, leveraging multi-channel sales and digital distribution. Its competitive advantage lies in this broad, interconnected presence and persistent innovation, securing a robust economic moat that shapes the future of financial technology.
Financial Performance & Fundamental Metrics
This section provides a clear overview of Intuit Inc.’s income statement, key financial ratios, and dividend payout policy to evaluate its financial health and investor returns.
Income Statement
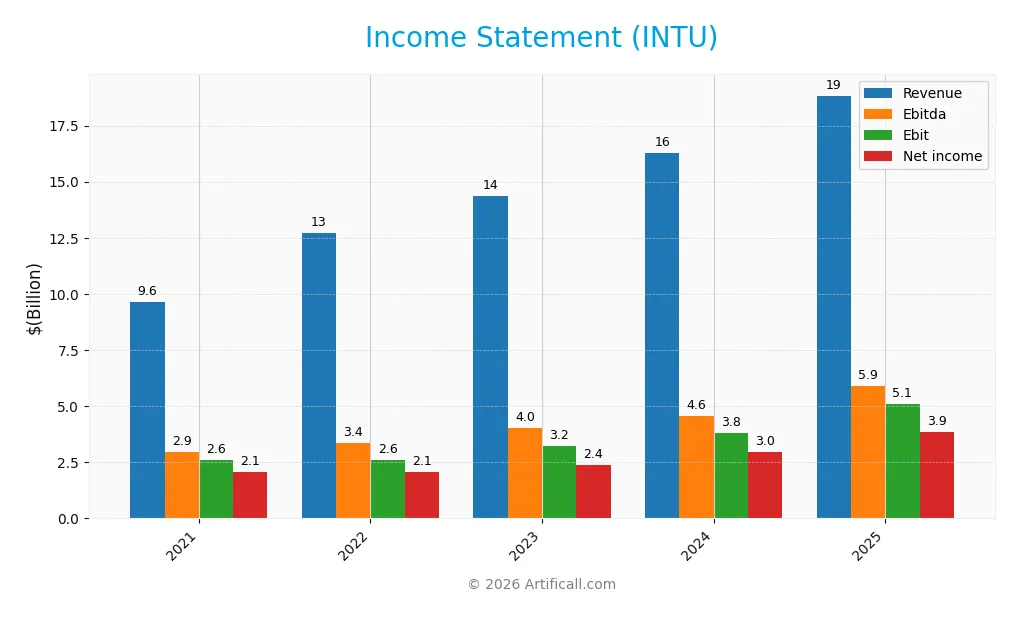
The following table summarizes Intuit Inc.’s key income statement figures over the past five fiscal years, providing a concise view of revenue, expenses, profitability, and earnings per share.
| 2021 | 2022 | 2023 | 2024 | 2025 | |
|---|---|---|---|---|---|
| Revenue | 9.63B | 12.73B | 14.37B | 16.29B | 18.83B |
| Cost of Revenue | 1.68B | 2.41B | 3.14B | 3.47B | 3.62B |
| Operating Expenses | 5.45B | 7.75B | 8.08B | 9.19B | 10.28B |
| Gross Profit | 7.95B | 10.32B | 11.23B | 12.82B | 15.21B |
| EBITDA | 2.95B | 3.37B | 4.04B | 4.58B | 5.89B |
| EBIT | 2.59B | 2.62B | 3.24B | 3.79B | 5.08B |
| Interest Expense | 29M | 81M | 248M | 242M | 247M |
| Net Income | 2.06B | 2.07B | 2.38B | 2.96B | 3.87B |
| EPS | 7.64 | 7.38 | 8.48 | 10.58 | 13.82 |
| Filing Date | 2021-09-08 | 2022-09-02 | 2023-09-01 | 2024-09-04 | 2025-09-03 |
Income Statement Evolution
Between 2021 and 2025, Intuit Inc. experienced strong revenue growth of 95.48%, rising from $9.6B to $18.8B. Net income also increased substantially by 87.63% over the period, reaching $3.87B in 2025. Margins remained largely favorable, with gross margin stable near 80.76% and net margin around 20.55%, although net margin growth over the period declined slightly by 4.02%.
Is the Income Statement Favorable?
The 2025 income statement reflects solid fundamentals with a 15.63% revenue increase and 33.99% growth in EBIT, indicating operational efficiency improvements. Net margin grew by 12.92% year-over-year, supported by a low interest expense ratio of 1.31%. EPS growth of 31.06% further underscores profitability gains. Overall, 92.86% of key income metrics are favorable, confirming a robust financial performance for the year.
Financial Ratios
The following table presents key financial ratios for Intuit Inc. over the fiscal years 2021 to 2025, offering insight into profitability, valuation, liquidity, leverage, efficiency, and dividend metrics:
| Ratios | 2021 | 2022 | 2023 | 2024 | 2025 |
|---|---|---|---|---|---|
| Net Margin | 21% | 16% | 17% | 18% | 21% |
| ROE | 21% | 13% | 14% | 16% | 20% |
| ROIC | 16% | 8% | 10% | 12% | 15% |
| P/E | 69.4 | 60.8 | 60.3 | 61.2 | 56.8 |
| P/B | 14.5 | 7.6 | 8.3 | 9.8 | 11.2 |
| Current Ratio | 1.94 | 1.39 | 1.47 | 1.29 | 1.36 |
| Quick Ratio | 1.94 | 1.39 | 1.47 | 1.29 | 1.36 |
| D/E | 0.25 | 0.46 | 0.39 | 0.36 | 0.34 |
| Debt-to-Assets | 16% | 27% | 24% | 20% | 18% |
| Interest Coverage | 86.2 | 31.7 | 12.7 | 15.0 | 19.9 |
| Asset Turnover | 0.62 | 0.46 | 0.52 | 0.51 | 0.51 |
| Fixed Asset Turnover | 8.30 | 8.86 | 9.99 | 11.47 | 12.54 |
| Dividend Yield | 0.45% | 0.62% | 0.62% | 0.57% | 0.54% |
Evolution of Financial Ratios
Over the analyzed period, Intuit Inc.’s Return on Equity (ROE) showed a general improvement, reaching 19.63% in 2025, indicating enhanced profitability. The Current Ratio displayed minor fluctuations but remained stable around 1.3 to 1.9, reflecting consistent liquidity. The Debt-to-Equity ratio decreased from 0.46 in 2022 to 0.34 in 2025, signaling prudent leverage management and reduced financial risk.
Are the Financial Ratios Favorable?
In 2025, Intuit’s profitability ratios, including net margin at 20.55% and ROE at 19.63%, are favorable, supporting strong earnings performance. Liquidity ratios present a mixed picture: the quick ratio is favorable at 1.36, while the current ratio is neutral at 1.36. Leverage ratios, such as debt-to-equity at 0.34 and debt-to-assets at 17.96%, are favorable, indicating controlled debt levels. However, valuation metrics like price-to-earnings at 56.82 and price-to-book at 11.15 are unfavorable, suggesting a premium market valuation. Overall, 57% of ratios are favorable, with a neutral to positive financial profile.
Shareholder Return Policy
Intuit Inc. maintains a consistent dividend payout ratio around 31-37%, with dividend per share steadily increasing from $2.39 in 2021 to $4.25 in 2025, and a modest annual yield near 0.5-0.6%. The dividend coverage by free cash flow remains strong, supporting sustainable distributions.
The company also engages in share buybacks, complementing its dividend policy. This balanced approach of dividends and buybacks, backed by robust free cash flow and profit margins above 20%, indicates a shareholder return policy aligned with long-term value creation without excessive financial risk.
Score analysis
The following radar chart presents an overview of Intuit Inc.’s key financial scores for a comprehensive evaluation:
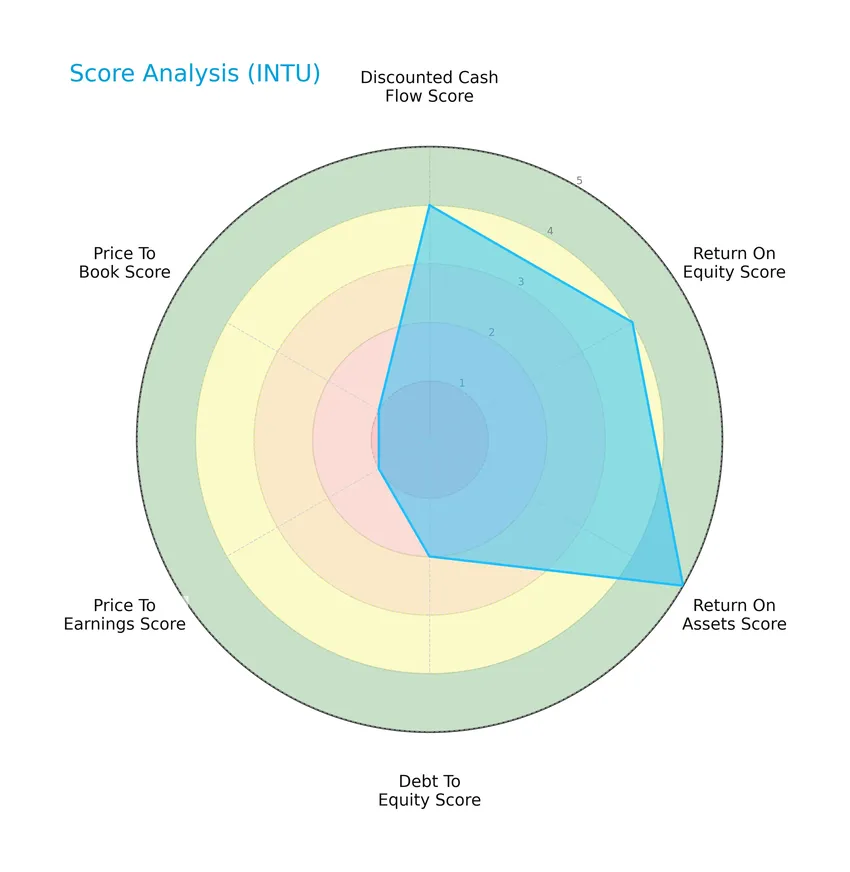
Intuit scores favorably on discounted cash flow (4), return on equity (4), and return on assets (5), indicating solid profitability. The moderate debt-to-equity score (2) suggests cautious leverage management, while very unfavorable price-to-earnings (1) and price-to-book (1) scores highlight valuation concerns.
Analysis of the company’s bankruptcy risk
Intuit’s Altman Z-Score places it comfortably in the safe zone, reflecting a low risk of bankruptcy and strong financial stability:

Is the company in good financial health?
The Piotroski Score diagram illustrates Intuit’s excellent financial strength based on profitability, leverage, liquidity, and efficiency measures:

With a top score of 9 and a “very strong” status, Intuit demonstrates exceptional financial health, signaling robust fundamentals from an accounting perspective.
Competitive Landscape & Sector Positioning
This sector analysis will examine Intuit Inc.’s strategic positioning, revenue breakdown, key products, and main competitors. I will assess whether Intuit holds a competitive advantage in its industry landscape.
Strategic Positioning
Intuit Inc. maintains a diversified product portfolio with four key segments: Small Business & Self-Employed, Consumer, Credit Karma, and ProConnect. Its geographic exposure includes the US, Canada, and international markets, supporting a broad customer base across consumers, small businesses, and professionals.
Revenue by Segment
The pie chart illustrates Intuit Inc.’s revenue distribution by segment for the fiscal year 2025, highlighting the company’s diverse business lines and their contribution to total revenue.
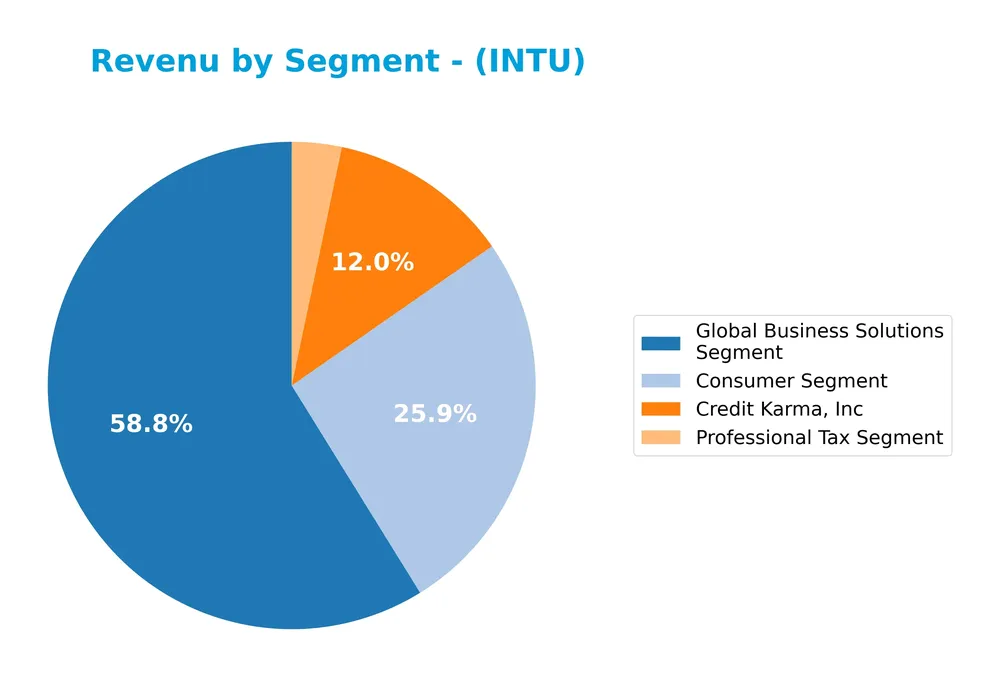
In 2025, Intuit’s Global Business Solutions Segment led revenue generation with 11.1B, followed by the Consumer Segment at 4.9B. Credit Karma contributed a significant 2.3B, showing steady growth. The Professional Tax Segment, though smaller at 621M, remains a consistent part of the portfolio. This distribution indicates strong business segment diversification with accelerating growth in Global Business Solutions and Credit Karma, signaling a balanced yet expanding revenue base.
Key Products & Brands
The table below presents Intuit Inc.’s main products and brands along with their descriptions:
| Product | Description |
|---|---|
| QuickBooks | Cloud-based and desktop financial management and payroll solutions for small businesses and self-employed users. |
| TurboTax | Income tax preparation products and services for consumers. |
| Credit Karma | Personal finance platform offering personalized loan, credit card, and insurance recommendations. |
| ProConnect | Desktop and online tax-preparation software products and electronic tax filing services for professionals. |
| QuickBooks Cash | Business bank account supporting payment-processing solutions including credit/debit cards, Apple Pay, and ACH. |
| QuickBooks Commerce | Inventory and order management solution for product-based businesses. |
| Payroll Solutions | Online payroll processing, direct deposit, tax reporting, and electronic filing services for small businesses. |
Intuit’s portfolio spans financial management software, tax preparation tools, and personal finance platforms, serving consumers, small businesses, and accounting professionals globally.
Main Competitors
There are 33 competitors in total, with the table below listing the top 10 leaders by market capitalization:
| Competitor | Market Cap. |
|---|---|
| Salesforce, Inc. | 242.5B |
| Shopify Inc. | 209.6B |
| AppLovin Corporation | 209.0B |
| Intuit Inc. | 175.2B |
| Uber Technologies, Inc. | 172.2B |
| ServiceNow, Inc. | 153.0B |
| Cadence Design Systems, Inc. | 84.5B |
| Snowflake Inc. | 73.4B |
| Autodesk, Inc. | 61.2B |
| Workday, Inc. | 54.9B |
Intuit Inc. ranks 4th among 33 competitors, holding about 64.8% of the market cap of the leading Salesforce, Inc. The company is positioned above both the average market cap of the top 10 (143.6B) and the median market cap of the sector (18.8B). Intuit maintains a significant 33.1% lead over its next closest competitor, Uber Technologies, reflecting a strong competitive buffer.
Comparisons with competitors
Check out how we compare the company to its competitors:
Does INTU have a competitive advantage?
Intuit Inc. presents a competitive advantage as it consistently creates value with a ROIC exceeding its WACC by 5.29%, supported by strong income statement metrics and favorable revenue and profit growth. However, its ROIC trend is declining, indicating some erosion in profitability over recent years.
Looking ahead, Intuit’s future outlook includes expanding its product offerings across multiple segments such as Small Business & Self-Employed, Consumer, Credit Karma, and ProConnect, serving diverse markets including the U.S., Canada, and internationally. These opportunities may support continued growth but require monitoring due to the observed decline in profitability trends.
SWOT Analysis
This SWOT analysis highlights Intuit Inc.’s key internal and external factors to inform strategic investment decisions.
Strengths
- strong revenue growth with 15.6% last year
- high net margin at 20.55%
- robust financial health indicated by Altman Z-Score of 8.65
Weaknesses
- high valuation multiples with PE of 56.82 and PB of 11.15
- declining ROIC trend despite value creation
- modest dividend yield at 0.54%
Opportunities
- expansion in cloud-based financial solutions
- growing demand in small business and self-employed segments
- innovation in personal finance platforms like Credit Karma
Threats
- intense competition in software application industry
- economic downturn impacting client spending
- regulatory changes in financial services sector
Intuit demonstrates strong profitability and financial stability but faces valuation concerns and declining returns on invested capital. Its growth opportunities in cloud and personal finance markets support continued expansion, while competitive and regulatory risks require cautious monitoring. This balanced profile suggests a strategy focused on innovation and operational efficiency to sustain value creation.
Stock Price Action Analysis
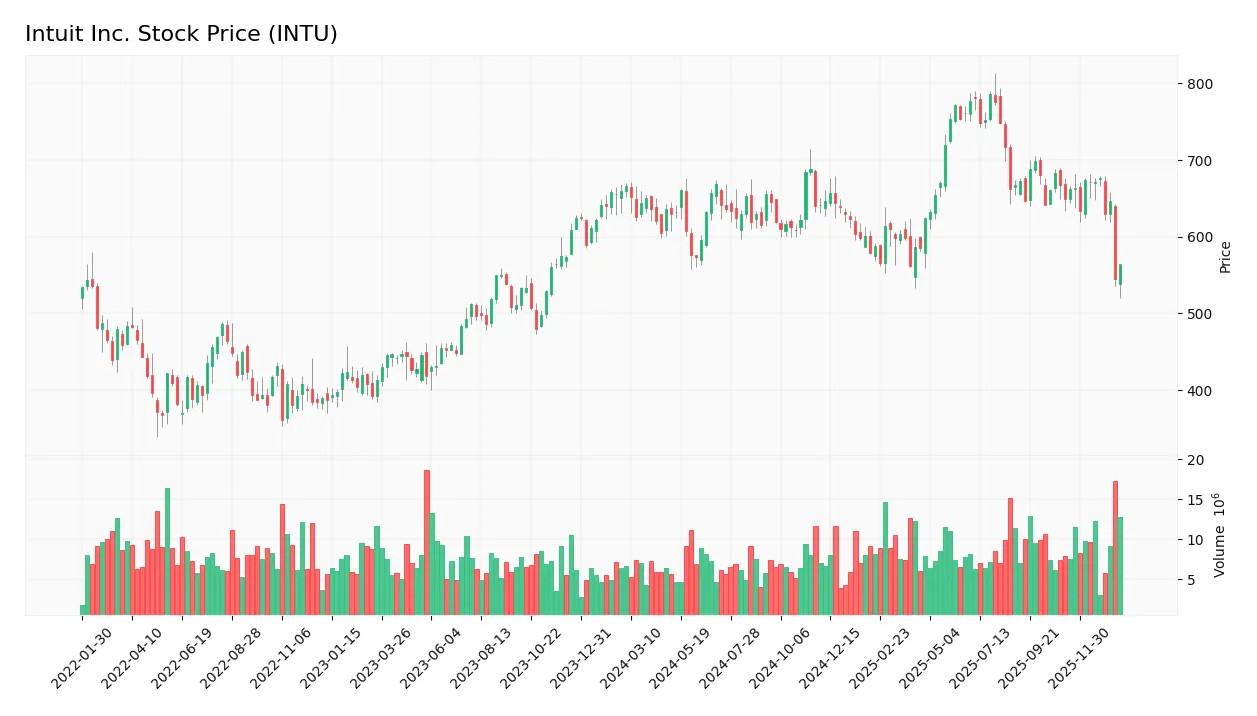
The following weekly chart displays Intuit Inc.’s stock price movements over the past 12 months, highlighting key fluctuations and trend developments:
Trend Analysis
Over the past 12 months, Intuit’s stock price declined by 15.39%, indicating a bearish trend. The price moved from a high of 785.95 to a low of 545.29, with volatility measured by a standard deviation of 52.2. The trend shows a deceleration in the downward momentum, suggesting the decline may be losing speed.
Volume Analysis
In the last three months, trading volume has been increasing, with a total volume near 92.5M shares. Buyer volume slightly dominates at 57.46%, indicating a moderately buyer-driven market. This suggests cautious investor interest and a potential buildup of buying pressure despite the overall bearish price trend.
Target Prices
The consensus target prices for Intuit Inc. indicate positive analyst expectations.
| Target High | Target Low | Consensus |
|---|---|---|
| 880 | 700 | 798.4 |
Analysts anticipate Intuit’s stock to trade between 700 and 880, with an average target near 798, reflecting moderate confidence in growth potential.

Don’t Let Luck Decide Your Entry Point
Optimize your entry points with our advanced ProRealTime indicators. You’ll get efficient buy signals with precise price targets for maximum performance. Start outperforming now!
Analyst & Consumer Opinions
This section reviews recent analyst ratings and consumer feedback regarding Intuit Inc.’s market performance and product reception.
Stock Grades
Here is the latest overview of Intuit Inc.’s stock ratings from recognized financial institutions and analysts:
| Grading Company | Action | New Grade | Date |
|---|---|---|---|
| Wells Fargo | Downgrade | Equal Weight | 2026-01-08 |
| BMO Capital | Maintain | Outperform | 2025-11-21 |
| RBC Capital | Maintain | Outperform | 2025-11-21 |
| Wells Fargo | Maintain | Overweight | 2025-11-21 |
| Evercore ISI Group | Maintain | Outperform | 2025-11-18 |
| RBC Capital | Maintain | Outperform | 2025-09-02 |
| Keybanc | Maintain | Overweight | 2025-08-22 |
| Morgan Stanley | Maintain | Overweight | 2025-08-22 |
| JP Morgan | Maintain | Overweight | 2025-08-22 |
| RBC Capital | Maintain | Outperform | 2025-08-22 |
The consensus remains positive with a “Buy” rating overall, though Wells Fargo’s recent downgrade to “Equal Weight” signals some caution. Most analysts maintain “Outperform” or “Overweight” grades, indicating steady confidence in the stock’s prospects.
Consumer Opinions
Consumer sentiment around Intuit Inc. reflects a mix of appreciation for its innovative financial software and some concerns about pricing and customer support.
| Positive Reviews | Negative Reviews |
|---|---|
| Intuit’s TurboTax makes tax filing straightforward and user-friendly. | Some users find the subscription fees higher than expected. |
| QuickBooks is praised for simplifying small business accounting. | Customer service can be slow and unresponsive at times. |
| The company regularly updates its software with helpful new features. | Occasional glitches in the mobile app disrupt workflow. |
Overall, consumers value Intuit’s ease of use and continuous innovation but express frustration with pricing and customer service responsiveness. These factors are crucial considerations for potential investors.
Risk Analysis
Below is a summary table outlining the primary risks associated with Intuit Inc. for potential investors to consider:
| Category | Description | Probability | Impact |
|---|---|---|---|
| Market Valuation | High P/E (56.82) and P/B (11.15) ratios suggest overvaluation risk in a volatile tech sector. | Medium | High |
| Competitive Pressure | Intense competition in financial software and fintech could affect market share and margins. | High | Medium |
| Regulatory Risks | Changes in tax laws or data privacy regulations could impact product offerings and compliance. | Medium | Medium |
| Economic Cycles | Economic downturns may reduce small business spending and consumer use of Intuit’s services. | Medium | Medium |
| Technology Risk | Dependence on cloud infrastructure and cybersecurity vulnerabilities pose operational risks. | Medium | High |
Intuit’s strongest risks stem from its high valuation, making it sensitive to market corrections, and technological vulnerabilities, which can disrupt service reliability. Despite a robust financial health profile and safe bankruptcy risk score, investors should monitor these risks closely.
Should You Buy Intuit Inc.?
Intuit appears to be a robustly profitable company with a slightly favorable competitive moat, suggesting value creation despite a declining ROIC trend. Its leverage profile is manageable, supporting operational efficiency, while an overall B rating indicates a very favorable investment profile but with some valuation concerns.
Strength & Efficiency Pillars
Intuit Inc. exhibits robust profitability, with a net margin of 20.55% and a return on equity (ROE) of 19.63%, underscoring efficient capital use. Its return on invested capital (ROIC) stands at 14.78%, exceeding the weighted average cost of capital (WACC) of 9.49%, confirming that the company is a clear value creator. Financial health is solid, reflected by a strong Altman Z-Score of 8.65, placing Intuit well within the safe zone, and a perfect Piotroski score of 9, indicating very strong fundamentals. These metrics collectively highlight Intuit’s operational efficiency and resilient balance sheet.
Weaknesses and Drawbacks
Despite solid fundamentals, Intuit faces valuation challenges with a high price-to-earnings (P/E) ratio of 56.82 and price-to-book (P/B) ratio of 11.15, signaling a premium market valuation that may limit upside potential. Leverage metrics are moderate; the debt-to-equity ratio of 0.34 and current ratio of 1.36 suggest manageable debt and liquidity, yet the high valuation ratios elevate risk in volatile markets. Additionally, the stock has experienced downward pressure with a bearish overall trend and a recent price decline of 13.08%, which could reflect market skepticism or profit-taking among investors.
Our Verdict about Intuit Inc.
Intuit presents a fundamentally favorable long-term profile, supported by strong profitability and financial stability. However, the current bearish trend and premium valuation might suggest caution. Despite the company’s value-creating status and solid financial footing, recent market pressures and elevated multiples could warrant a wait-and-see approach for a more attractive entry point. This profile may appear suitable for investors with a tolerance for short-term volatility and a long-term horizon.
Disclaimer: This content is for informational purposes only and does not constitute financial, investment, or other professional advice. Investing in financial markets involves a significant risk of loss, and past performance is not indicative of future results.
Additional Resources
- Mn Services Vermogensbeheer B.V. Acquires 1,800 Shares of Intuit Inc. $INTU – MarketBeat (Jan 24, 2026)
- Here’s what to expect from Intuit’s next earnings report – MSN (Jan 24, 2026)
- 13,396 Shares in Intuit Inc. $INTU Purchased by Y Intercept Hong Kong Ltd – MarketBeat (Jan 24, 2026)
- Intuit Inc. (INTU) Stock Analysis: Exploring A 51% Potential Upside For Tech Investors – DirectorsTalk Interviews (Jan 22, 2026)
- Intuit Reports Strong First-Quarter Results and Reiterates Full-Year Guidance – Intuit (Nov 20, 2025)
For more information about Intuit Inc., please visit the official website: intuit.com