Home > Analyses > Technology > International Business Machines Corporation
International Business Machines Corporation (IBM) powers the backbone of enterprise technology worldwide. Its hybrid cloud platforms, AI-driven software, and consulting services redefine how industries innovate and operate. With a century-long legacy, IBM blends robust infrastructure with cutting-edge solutions like Red Hat to stay relevant in a shifting tech landscape. As markets evolve rapidly, I ask: does IBM’s deep expertise and diversified portfolio still justify its premium valuation and future growth prospects?
Table of contents
Business Model & Company Overview
International Business Machines Corporation, founded in 1911 and headquartered in Armonk, NY, dominates the Information Technology Services sector. It delivers an integrated ecosystem across Software, Consulting, Infrastructure, and Financing segments. This broad suite empowers enterprises to modernize operations, automate workflows, and secure mission-critical workloads worldwide.
IBM’s revenue engine balances hybrid cloud software, enterprise consulting, and on-premises infrastructure solutions. Its global footprint spans the Americas, Europe, and Asia, serving industries from banking to retail. This strategic diversification fuels steady cash flow and reinforces its competitive advantage as a pioneer shaping IT’s future.
Financial Performance & Fundamental Metrics
I analyze IBM’s income statement, key financial ratios, and dividend payout policy to assess its profitability, efficiency, and shareholder return strategy.
Income Statement
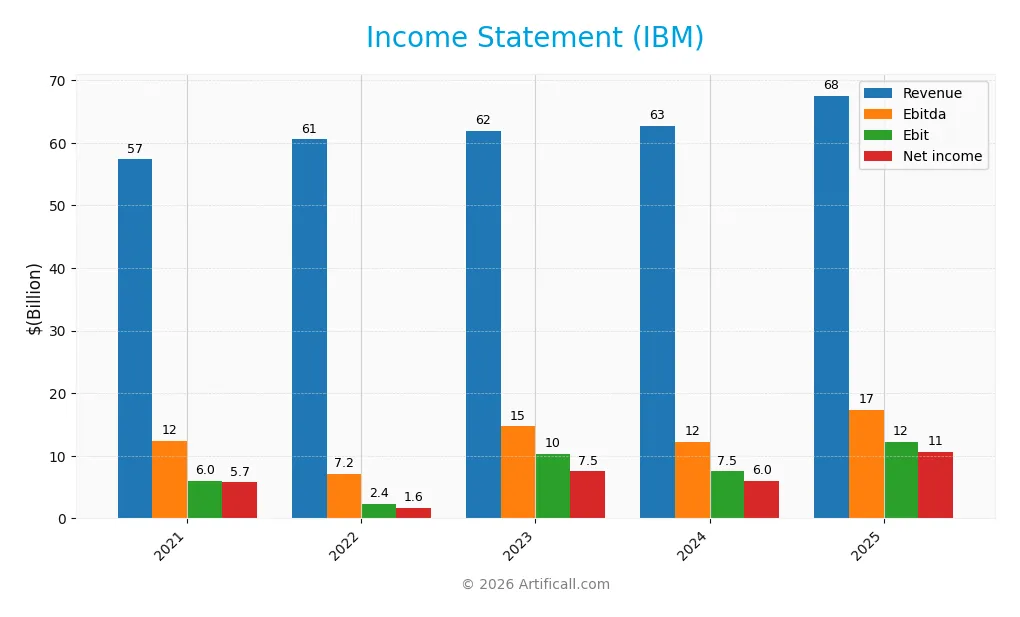
The table below presents International Business Machines Corporation’s key income statement figures for the fiscal years 2021 through 2025, all values are in USD.
| 2021 | 2022 | 2023 | 2024 | 2025 | |
|---|---|---|---|---|---|
| Revenue | 57.4B | 60.5B | 61.9B | 62.8B | 67.5B |
| Cost of Revenue | 25.9B | 27.8B | 27.6B | 27.2B | 27.4B |
| Operating Expenses | 24.6B | 24.5B | 24.5B | 25.5B | 29.9B |
| Gross Profit | 31.5B | 32.7B | 34.3B | 35.6B | 40.2B |
| EBITDA | 12.4B | 7.2B | 14.7B | 12.2B | 17.3B |
| EBIT | 6.0B | 2.4B | 10.3B | 7.5B | 12.3B |
| Interest Expense | 1.2B | 1.2B | 1.6B | 1.7B | 1.9B |
| Net Income | 5.7B | 1.6B | 7.5B | 6.0B | 10.6B |
| EPS | 6.41 | 1.82 | 8.23 | 6.53 | 11.36 |
| Filing Date | 2022-02-22 | 2023-02-28 | 2024-02-26 | 2025-02-25 | 2026-02-24 |
Income Statement Evolution
From 2021 to 2025, IBM’s revenue rose 17.8%, indicating steady top-line growth. Net income surged 84.5%, reflecting significant bottom-line improvement. Gross margin held favorably steady near 59.5%, while EBIT and net margins expanded markedly, signaling enhanced operational efficiency and profitability across the period.
Is the Income Statement Favorable?
In 2025, IBM reported $67.5B revenue, growing 7.6% year-over-year, with net income of $10.6B, up 63.4%. EBIT margin improved to 18.2%, and net margin reached 15.7%. Despite operating expenses growing alongside revenue, the company maintained strong margin expansion and earnings per share jumped 73.7%, confirming fundamentally favorable income statement dynamics.
Financial Ratios
The following table presents International Business Machines Corporation’s key financial ratios for the fiscal years 2021 through 2025, illustrating profitability, liquidity, leverage, and market valuation trends:
| Ratios | 2021 | 2022 | 2023 | 2024 | 2025 |
|---|---|---|---|---|---|
| Net Margin | 10.0% | 2.7% | 12.1% | 9.6% | 15.7% |
| ROE | 30.4% | 7.5% | 33.3% | 22.1% | 32.4% |
| ROIC | 6.3% | 8.1% | 7.8% | 9.2% | 8.6% |
| P/E | 20.9 | 77.5 | 19.9 | 34.2 | 26.1 |
| P/B | 6.3 | 5.8 | 6.6 | 7.5 | 8.5 |
| Current Ratio | 0.88 | 0.92 | 0.96 | 1.04 | 0.93 |
| Quick Ratio | 0.83 | 0.87 | 0.93 | 1.00 | 0.90 |
| D/E | 2.92 | 2.46 | 2.66 | 2.14 | 2.06 |
| Debt-to-Assets | 41.8% | 42.4% | 44.3% | 42.6% | 44.2% |
| Interest Coverage | 5.94 | 6.72 | 6.11 | 5.88 | 5.34 |
| Asset Turnover | 0.43 | 0.48 | 0.46 | 0.46 | 0.44 |
| Fixed Asset Turnover | 6.43 | 7.37 | 7.09 | 7.03 | 7.48 |
| Dividend Yield | 4.90% | 4.68% | 4.05% | 2.98% | 2.27% |
Evolution of Financial Ratios
From 2021 to 2025, IBM’s Return on Equity (ROE) showed notable improvement, peaking at 32.45% in 2025. The Current Ratio fluctuated below the ideal 1.0 threshold, ending at 0.93 in 2025, indicating weaker short-term liquidity. The Debt-to-Equity Ratio remained elevated, though it declined modestly to 2.06 by 2025, signaling persistent leverage but slight deleveraging.
Are the Financial Ratios Fovorable?
In 2025, profitability metrics like net margin (15.69%) and ROE (32.45%) were favorable, reflecting strong earnings efficiency. Liquidity ratios raised caution, with a below-par current ratio (0.93) and a neutral quick ratio (0.9). Leverage remained high, marked by an unfavorable debt-to-equity ratio (2.06). Market valuation ratios such as P/E (26.07) and P/B (8.46) were unfavorable, suggesting expensive stock pricing. Overall, the ratios are slightly favorable, balancing solid profitability against liquidity and valuation concerns.
Shareholder Return Policy
International Business Machines Corporation (IBM) maintains a consistent dividend policy with a payout ratio near 59% in 2025 and a dividend yield around 2.3%. Dividends per share have remained stable, supported by free cash flow coverage above 87%. The company also engages in share buybacks.
This balanced approach indicates prudent capital allocation, combining steady income distribution and buybacks. The payout ratio below 60% alongside robust cash flow backing suggests IBM’s policy supports sustainable long-term shareholder value creation while managing financial risk.
Score analysis
The following radar chart illustrates key financial scores that reflect IBM’s valuation and profitability metrics:
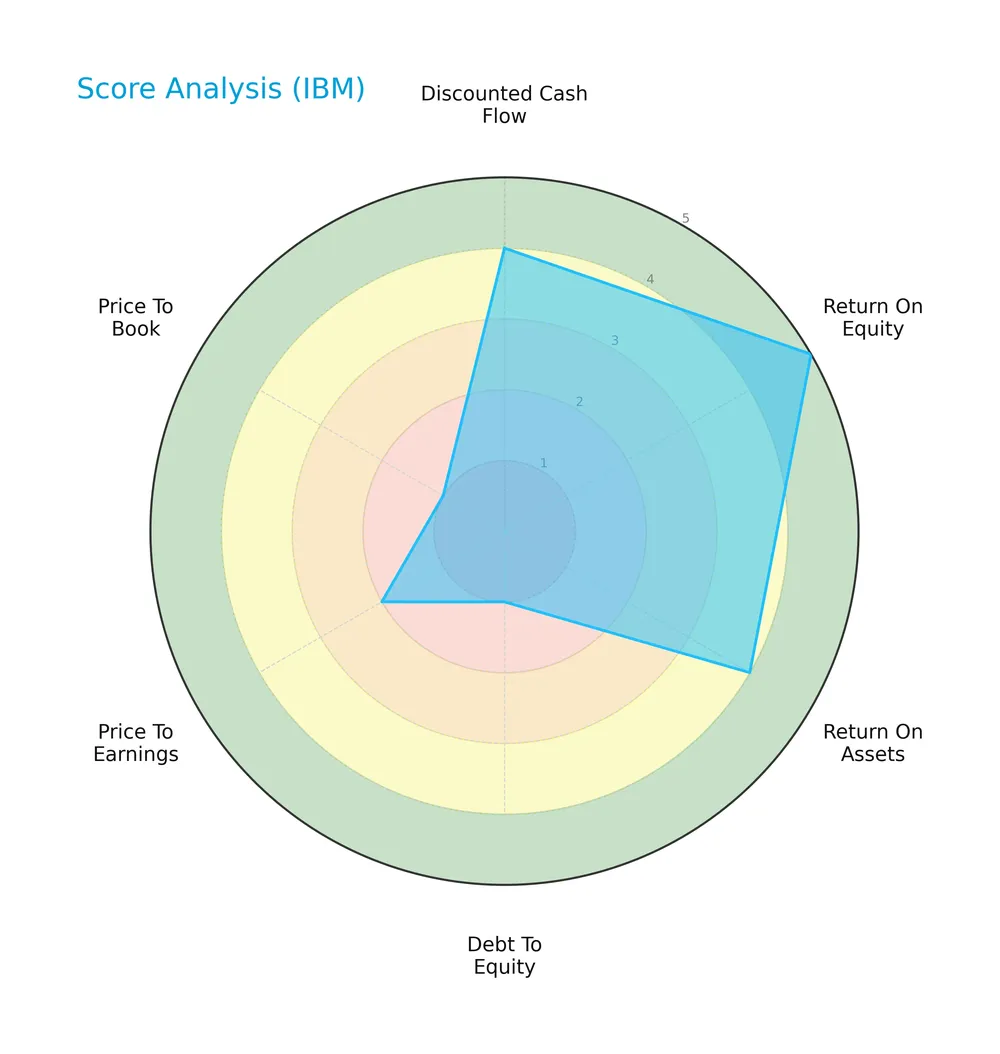
IBM shows strong discounted cash flow and return on equity scores at 5 each, indicating effective capital allocation. Return on assets is favorable at 4. However, debt-to-equity, price-to-earnings, and price-to-book scores are weak, signaling leverage concerns and valuation challenges.
Analysis of the company’s bankruptcy risk
IBM’s Altman Z-Score positions the company firmly in the safe zone, indicating low bankruptcy risk:

Is the company in good financial health?
The Piotroski Score diagram highlights IBM’s financial strength assessment based on nine criteria:

With a Piotroski score of 5, IBM displays average financial health. This middling score suggests moderate profitability and operational efficiency but leaves room for improvement in financial robustness.
Competitive Landscape & Sector Positioning
This analysis explores International Business Machines Corporation’s strategic positioning and revenue segments. I will assess whether IBM holds a competitive advantage against key industry players.
Strategic Positioning
IBM diversifies across four segments: Software (30B), Consulting (21B), Infrastructure Services (16B), and Financing (0.7B). Geographically, it balances revenue among Americas (33B), EMEA (22B), and Asia Pacific (12B), reflecting broad product and global market exposure.
Revenue by Segment
This pie chart illustrates IBM’s revenue distribution by segment for the fiscal year 2025, highlighting the relative contributions of Consulting, Infrastructure Services, Financing, and Software.
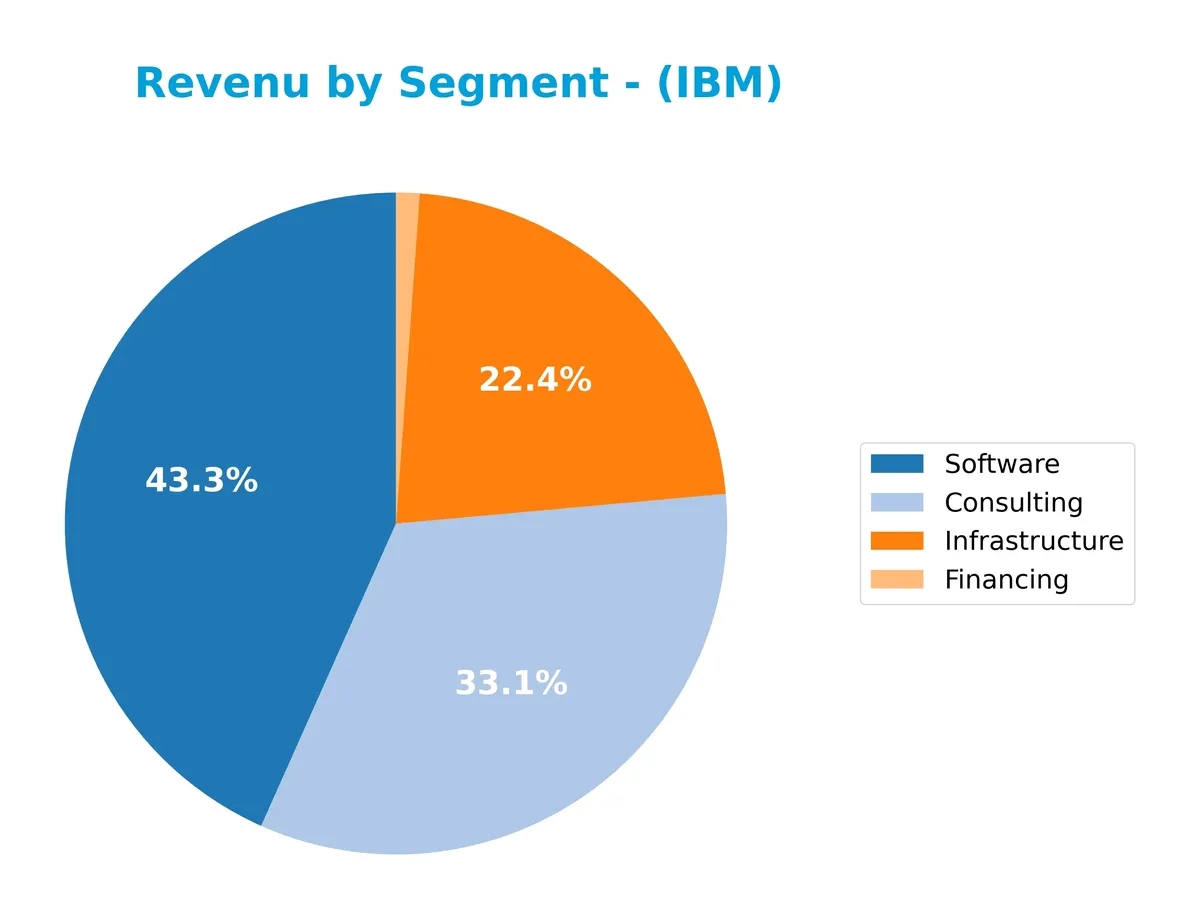
In 2025, Software leads IBM’s revenue with $29.96B, followed by Consulting at $21.06B and Infrastructure Services at $15.72B. Financing remains a minor contributor at $737M. Compared to 2024, Software and Consulting revenues accelerated, reflecting a strategic focus on high-margin, scalable offerings. Infrastructure Services shows steady growth, but the concentration in Software signals potential concentration risk if market dynamics shift.
Key Products & Brands
The table below outlines IBM’s main products and brands with their business segment descriptions:
| Product | Description |
|---|---|
| Software | Hybrid cloud platforms, AI, data solutions, security software, transaction processing, including Red Hat. |
| Consulting | Business transformation, strategy, operations, analytics, technology consulting, cloud platform services. |
| Infrastructure | On-premises and cloud servers, storage solutions, hybrid cloud support, equipment remanufacturing and remarketing. |
| Financing | Lease, installment payments, loans, and short-term working capital financing services. |
IBM’s revenue stream is diversified across software innovation, consulting expertise, infrastructure solutions, and financing services. Software and consulting segments dominate, reflecting IBM’s pivot toward high-value technology and services.
Main Competitors
The sector includes 16 competitors, with the table below listing the top 10 leaders by market capitalization:
| Competitor | Market Cap. |
|---|---|
| International Business Machines Corporation | 272B |
| Accenture plc | 162B |
| Cognizant Technology Solutions Corporation | 40B |
| Fiserv, Inc. | 36B |
| Fidelity National Information Services, Inc. | 34B |
| Wipro Limited | 30B |
| Leidos Holdings, Inc. | 23B |
| Gartner, Inc. | 18B |
| CDW Corporation | 17B |
| Jack Henry & Associates, Inc. | 13B |
International Business Machines Corporation ranks first among 16 competitors. Its market cap stands at 78.7% of the top sector leader’s scale, reflecting strong market dominance. The company is above both the average market cap of the top 10 (64.6B) and the median market cap in the sector (17.8B). The gap to its nearest competitor below is significant, at -32.3%, underscoring IBM’s leading position.
Comparisons with competitors
Check out how we compare the company to its competitors:
Does IBM have a competitive advantage?
IBM demonstrates a sustainable competitive advantage, consistently creating value with a ROIC exceeding WACC by 2.5%, and showing a strong upward ROIC trend of 36% from 2021 to 2025. Its diversified segments—software, consulting, infrastructure, and financing—support stable profitability, evidenced by a favorable gross margin of 59.5% and net margin growth of 56.7% over the period.
Looking ahead, IBM’s hybrid cloud platform, AI-driven software, and global consulting services position it well to capture growth in enterprise digital transformation. Expansion in Americas and EMEA markets underpins revenue growth, while new product innovation and integration of open-source technologies offer promising opportunities.
SWOT Analysis
This SWOT analysis highlights IBM’s core strengths and challenges to guide strategic investment decisions.
Strengths
- strong market position in hybrid cloud and AI
- robust revenue growth of 17.8% over 5 years
- very favorable moat with ROIC exceeding WACC
Weaknesses
- high debt-to-equity ratio at 2.06 signals leverage risk
- unfavorable valuation metrics (PE 26.07, PB 8.46)
- liquidity concerns with current ratio below 1
Opportunities
- expanding consulting and cloud services market
- growth potential in Asia Pacific and EMEA regions
- increasing demand for AI and automation solutions
Threats
- intense competition from hyperscalers and software vendors
- technological disruption in IT services
- macroeconomic risks impacting global IT spending
IBM’s strengths in hybrid cloud and AI underpin sustainable value creation despite leverage and valuation risks. Capitalizing on global growth and innovation is critical to offset competitive pressures.
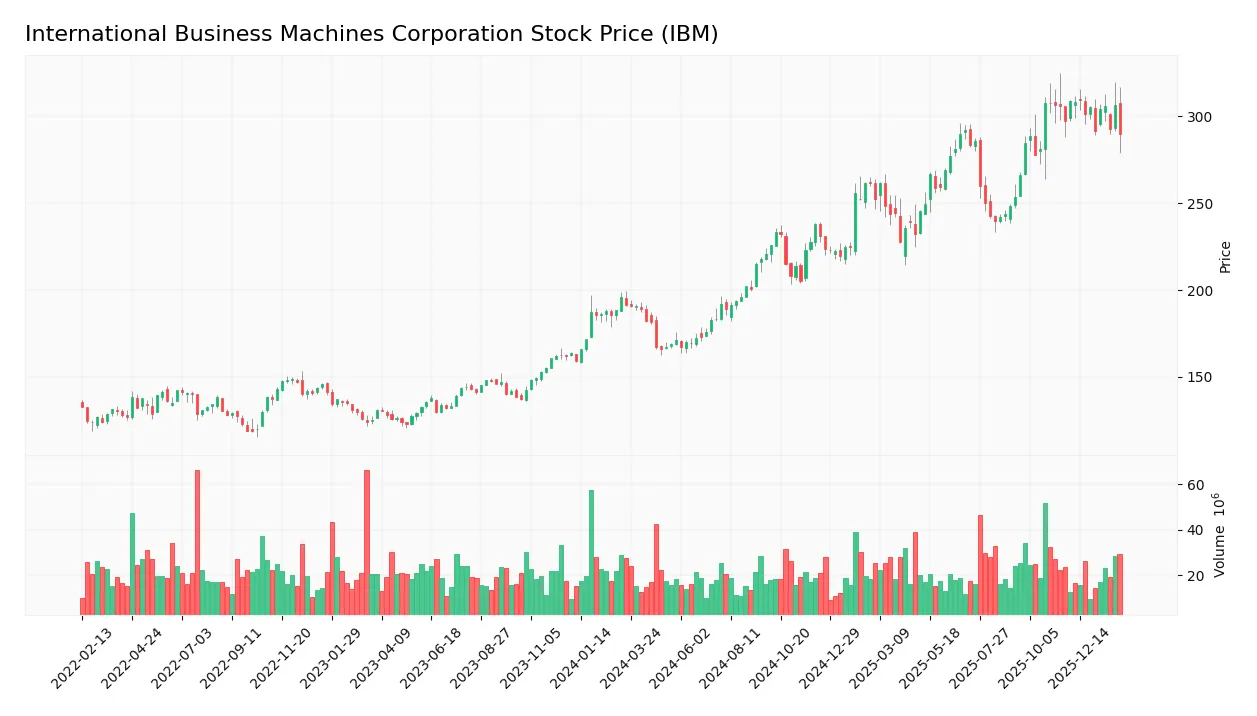
Stock Price Action Analysis
The weekly stock chart for International Business Machines Corporation (IBM) reveals key price movements and trend dynamics over the latest 12-month period:
Trend Analysis
Over the past 12 months, IBM’s stock price rose 21.24%, indicating a bullish trend. The standard deviation at 42.87 signals high volatility. The price peaked at 309.24 and bottomed at 165.71. However, recent months show a deceleration in momentum despite the overall gains.
Volume Analysis
Trading volume trends upward with a total of 2.6B shares traded, driven by 54.72% buyer participation overall. Yet, in the recent three months, seller volume dominates at 65.81%, signaling increased selling pressure and potential caution among investors.
Target Prices
Analysts set a solid target price consensus for IBM, reflecting confidence in its strategic direction.
| Target Low | Target High | Consensus |
|---|---|---|
| 304 | 380 | 349.5 |
The target range suggests upside potential of roughly 10-15% from current levels, indicating generally bullish expectations.

Don’t Let Luck Decide Your Entry Point
Optimize your entry points with our advanced ProRealTime indicators. You’ll get efficient buy signals with precise price targets for maximum performance. Start outperforming now!
Analyst & Consumer Opinions
This section examines analyst ratings and consumer feedback to provide a comprehensive view of IBM’s market perception.
Stock Grades
Here are the latest verified stock grades for International Business Machines Corporation from leading financial firms:
| Grading Company | Action | New Grade | Date |
|---|---|---|---|
| Jefferies | Maintain | Buy | 2026-01-29 |
| Stifel | Maintain | Buy | 2026-01-29 |
| RBC Capital | Maintain | Outperform | 2026-01-29 |
| JP Morgan | Maintain | Neutral | 2026-01-29 |
| Evercore ISI Group | Maintain | Outperform | 2026-01-29 |
| Wedbush | Maintain | Outperform | 2026-01-29 |
| UBS | Maintain | Sell | 2026-01-29 |
| JP Morgan | Maintain | Neutral | 2026-01-21 |
| Evercore ISI Group | Maintain | Outperform | 2026-01-20 |
| B of A Securities | Maintain | Buy | 2026-01-13 |
The consensus shows a balanced stance with a tilt toward buy and outperform ratings, offset by neutral and a few sell opinions. This range suggests mixed but generally cautious confidence among analysts.
Consumer Opinions
Consumer sentiment around IBM remains mixed but leans toward appreciation for its innovation and reliability.
| Positive Reviews | Negative Reviews |
|---|---|
| “IBM’s enterprise solutions are robust and scalable.” | “Customer service can be slow and unresponsive.” |
| “Strong commitment to AI and cloud technologies.” | “Pricing feels outdated compared to competitors.” |
| “Reliable security features that protect sensitive data.” | “Complex product offerings make onboarding difficult.” |
Overall, consumers praise IBM’s technological expertise and security. However, they frequently cite customer support delays and pricing concerns as areas needing improvement.
Risk Analysis
Below is a summary table of key risks facing International Business Machines Corporation (IBM) in 2026:
| Category | Description | Probability | Impact |
|---|---|---|---|
| Liquidity Risk | Current ratio below 1.0 signals tight short-term liquidity | Medium | Medium |
| Leverage Risk | Debt-to-equity ratio above 2.0 indicates high financial leverage | High | High |
| Valuation Risk | Elevated P/E and P/B ratios suggest overvaluation | High | Medium |
| Operational Risk | Moderate ROIC compared to WACC may limit capital efficiency | Medium | Medium |
| Market Risk | Beta under 1.0 shows lower volatility but potential sector shifts | Medium | Low |
| Dividend Risk | Dividend yield stable but depends on future earnings | Low | Low |
The most concerning risks are IBM’s high financial leverage and stretched valuation multiples. A debt-to-equity ratio above 2.0 raises red flags about debt servicing under economic stress. Meanwhile, P/E at 26 and P/B near 8.5 far exceed tech sector averages, increasing downside if growth slows. The current ratio below 1.0 hints at liquidity pressures, though interest coverage remains healthy. I advise close monitoring of leverage and valuation given macro uncertainties.
Should You Buy International Business Machines Corporation?
International Business Machines Corporation appears to be generating robust value creation with a durable competitive moat supported by growing ROIC. Despite a substantial leverage profile, its overall rating of B+ suggests a very favorable financial health profile, balanced by moderate operational efficiency.
Strength & Efficiency Pillars
International Business Machines Corporation demonstrates solid profitability with a net margin of 15.69% and a return on equity of 32.45%. Its return on invested capital (ROIC) stands at 8.57%, exceeding the weighted average cost of capital (WACC) of 6.08%, confirming the company as a value creator. The growing ROIC trend by 36.03% signals improving operational efficiency. Favorable gross margin (59.5%) and EBIT margin (18.16%) further underline IBM’s strong operational control.
Weaknesses and Drawbacks
IBM shows vulnerabilities in valuation and leverage metrics. Its price-to-earnings ratio at 26.07 and price-to-book ratio at 8.46 suggest stretched valuation levels relative to peers. The debt-to-equity ratio of 2.06 flags significant leverage risk, while a current ratio of 0.93 points to liquidity concerns, indicating potential short-term financial strain. Recent market behavior also reveals seller dominance with only 34.19% buyer volume since December 2025, creating headwinds in the near term.
Our Final Verdict about International Business Machines Corporation
IBM’s fundamental profile appears attractive for long-term exposure given its value creation and operational strength. However, recent seller dominance advises caution and a potential wait for a more favorable entry point. The company’s safe Altman Z-Score of 3.20 supports its solvency, but valuation and liquidity risks suggest investors maintain vigilance and prioritize risk management.
Disclaimer: This content is for informational purposes only and does not constitute financial, investment, or other professional advice. Investing in financial markets involves a significant risk of loss, and past performance is not indicative of future results.
Additional Resources
- International Business Machines Corporation (IBM) Drops 9.4% — Developing Story – AlphaStreet News (Feb 24, 2026)
- International Business Machines (NYSE:IBM) Shares Up 2.7% – Still a Buy? – MarketBeat (Feb 24, 2026)
- Decoding International Business Machines Corp (IBM): A Strategic SWOT Insight – GuruFocus (Feb 25, 2026)
- International Business Machines Corporation (IBM) is Attracting Investor Attention: Here is What You Should Know – Yahoo Finance Singapore (Feb 24, 2026)
- IBM Stock Drops 13% in February After AI Modernization Claims. Analysts See $325 Fair Value – TIKR.com (Feb 24, 2026)
For more information about International Business Machines Corporation, please visit the official website: ibm.com