Home > Analyses > Financial Services > Intercontinental Exchange, Inc.
Intercontinental Exchange, Inc. powers the global financial ecosystem by operating vital exchanges and clearinghouses that facilitate trillions in daily transactions. Its influence spans commodities, equities, fixed income, and mortgage technology markets, making it a cornerstone of modern finance. Renowned for innovation and robust data services, ICE shapes how markets evolve and manage risk. The key question now: do ICE’s fundamentals and growth prospects fully justify its current valuation in a dynamic financial landscape?

Table of contents
Business Model & Company Overview
Intercontinental Exchange, Inc. (ICE) operates as a powerhouse in financial markets since its 2000 founding and Atlanta headquarters. It dominates the Financial – Data & Stock Exchanges sector with a cohesive ecosystem of regulated exchanges, clearing houses, and listing venues across commodities, equities, and fixed income markets. ICE’s integrated platforms unify trading, clearing, and data services, connecting global financial activity seamlessly.
ICE generates value through a balanced mix of trading venues, data analytics, and mortgage technology. Its revenue engine spans 13 regulated exchanges and 6 clearing houses across the Americas, Europe, and Asia. Recurring data services complement futures, options, and mortgage origination solutions. This multi-layered footprint builds a robust economic moat, positioning ICE as a critical infrastructure in shaping global financial markets.
Financial Performance & Fundamental Metrics
I will analyze Intercontinental Exchange, Inc.’s income statement, key financial ratios, and dividend payout policy to assess its core financial health and shareholder returns.
Income Statement
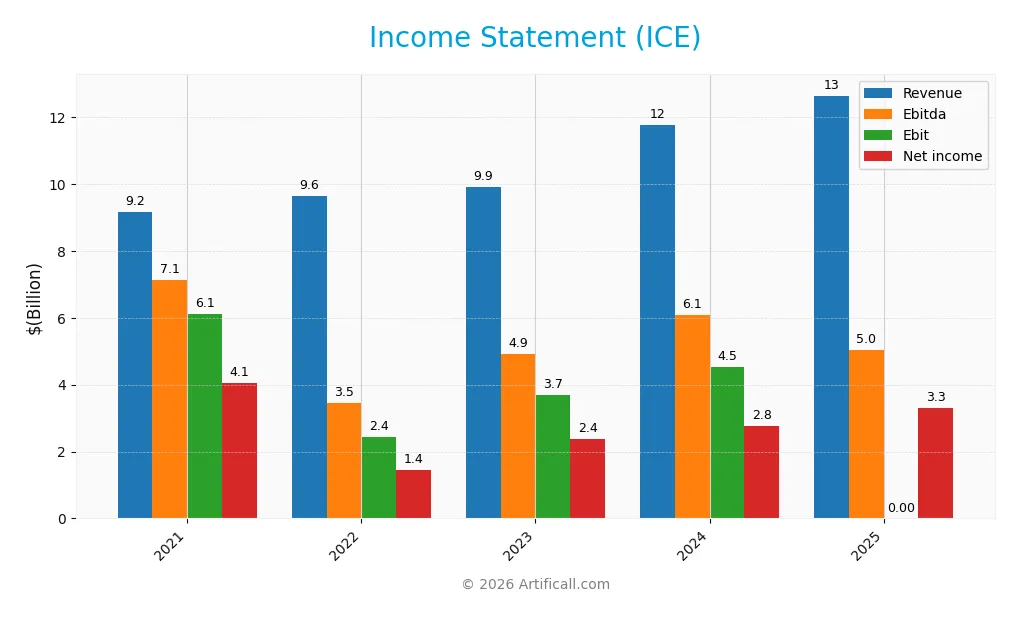
Below is Intercontinental Exchange, Inc.’s income statement for fiscal years 2021 through 2025, showing key profitability and expense metrics in USD.
| 2021 | 2022 | 2023 | 2024 | 2025 | |
|---|---|---|---|---|---|
| Revenue | 9.17B | 9.64B | 9.90B | 11.76B | 12.64B |
| Cost of Revenue | 4.15B | 4.43B | 4.24B | 5.24B | 2.99B |
| Operating Expenses | 1.57B | 1.56B | 1.96B | 2.21B | 2.01B |
| Gross Profit | 5.02B | 5.20B | 5.66B | 6.52B | 9.65B |
| EBITDA | 7.13B | 3.46B | 4.92B | 6.08B | 5.05B |
| EBIT | 6.12B | 2.42B | 3.70B | 4.54B | 0.00 |
| Interest Expense | 423M | 616M | 808M | 910M | 803M |
| Net Income | 4.06B | 1.45B | 2.37B | 2.75B | 3.32B |
| EPS | 7.22 | 2.59 | 4.20 | 4.80 | 5.79 |
| Filing Date | 2022-02-03 | 2023-02-02 | 2024-02-08 | 2025-02-06 | 2026-02-05 |
Income Statement Evolution
From 2021 to 2025, ICE’s revenue increased by 38% to 12.64B, reflecting steady top-line growth. However, net income declined 18%, signaling margin pressure. Gross margin improved to a strong 76.3%, while net margin contracted by 41%, showing mixed profitability trends. EBITDA and EBIT margins diverged sharply, with EBIT collapsing in the latest year.
Is the Income Statement Favorable?
In 2025, ICE reported a solid gross margin of 76.3% and a favorable net margin of 26.2%, underscoring efficient cost control. Yet, EBIT margin fell to zero, indicating operational challenges. Interest expense remained favorably low at 6.35% of revenue. Overall, fundamentals appear generally favorable but warrant caution due to volatile EBIT performance.
Financial Ratios
The table below summarizes key financial ratios for Intercontinental Exchange, Inc. (ICE) over the last five fiscal years:
| Ratios | 2021 | 2022 | 2023 | 2024 | 2025 |
|---|---|---|---|---|---|
| Net Margin | 44% | 15% | 24% | 23% | 26% |
| ROE | 18% | 6% | 9% | 10% | 11% |
| ROIC | 6% | 7% | 6% | 6% | 7% |
| P/E | 19 | 40 | 31 | 31 | 28 |
| P/B | 3.38 | 2.53 | 2.82 | 3.09 | 3.20 |
| Current Ratio | 1.01 | 1.05 | 1.00 | 0.99 | 1.02 |
| Quick Ratio | 1.01 | 1.05 | 1.00 | 0.99 | 1.02 |
| D/E | 0.62 | 0.81 | 0.89 | 0.75 | 0.70 |
| Debt-to-Assets | 7% | 9% | 17% | 15% | 15% |
| Interest Coverage | 8.15 | 5.91 | 4.57 | 4.74 | -6.14 |
| Asset Turnover | 0.05 | 0.05 | 0.07 | 0.08 | 0.09 |
| Fixed Asset Turnover | 5.40 | 5.45 | 5.15 | 5.46 | 4.70 |
| Dividend Yield | 0.97% | 1.49% | 1.32% | 1.22% | 1.19% |
Evolution of Financial Ratios
From 2021 to 2025, ICE’s Return on Equity (ROE) showed a general decline from 17.9% to 11.4%, indicating reduced profitability. The Current Ratio remained stable around 1.0, signaling consistent short-term liquidity. Debt-to-Equity ratio fluctuated but stayed near 0.7, reflecting moderate leverage without significant shifts in financial structure.
Are the Financial Ratios Fovorable?
In 2025, profitability was solid with a favorable net margin of 26.2% but a neutral ROE of 11.4%, slightly below ideal benchmarks. Liquidity ratios were neutral to favorable, with a Current Ratio of 1.02 and Quick Ratio also favorable at 1.02. Leverage ratios were neutral; debt-to-assets at 14.8% was favorable, but interest coverage was unfavorable. Market valuation ratios like P/E and P/B were unfavorable, contributing to a slightly favorable overall ratio assessment.
Shareholder Return Policy
Intercontinental Exchange, Inc. maintains a dividend payout ratio around 33%, with dividends per share steadily increasing to $1.93 in 2025. The annual dividend yield stands near 1.2%, supported by robust free cash flow coverage of dividends and capital expenditures.
The company also engages in share buybacks, complementing its dividend policy. This balanced approach reflects prudent capital allocation, suggesting sustainable shareholder returns without compromising long-term financial stability.
Score analysis
The following radar chart displays key financial metric scores for Intercontinental Exchange, Inc.:
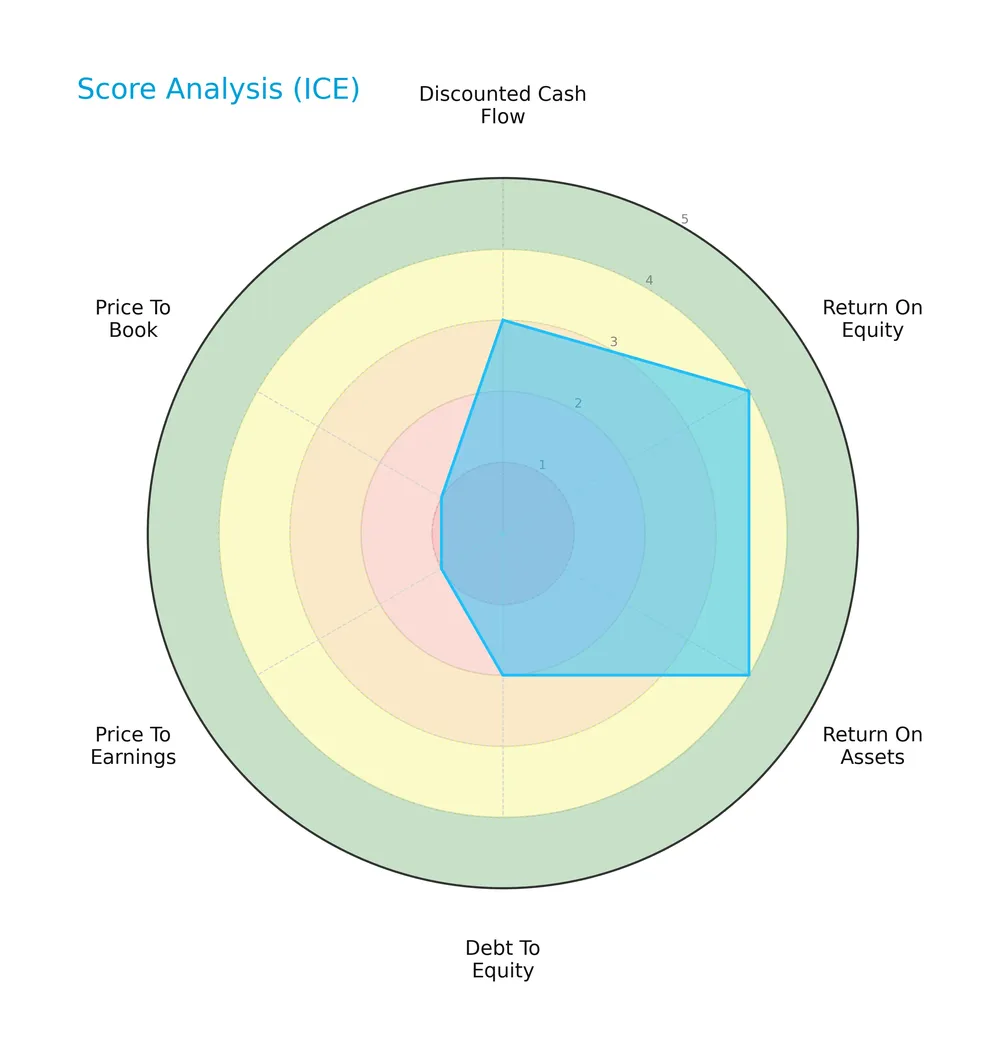
Intercontinental Exchange scores moderately on discounted cash flow and debt to equity. Profitability metrics like return on equity and assets rate favorably. Valuation measures, price-to-earnings and price-to-book, remain very unfavorable.
Analysis of the company’s bankruptcy risk
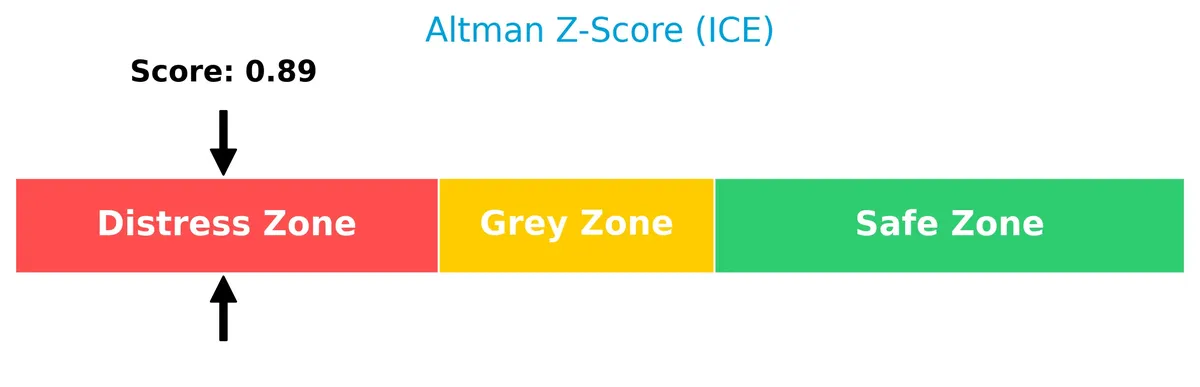
The Altman Z-Score places the company in the distress zone, signaling a high risk of financial distress and potential bankruptcy:
Is the company in good financial health?
The Piotroski Score diagram illustrates the company’s financial strength based on nine key criteria:

With a strong Piotroski Score of 7, the company demonstrates solid financial health, indicating good profitability, efficiency, and moderate leverage.
Competitive Landscape & Sector Positioning
This sector analysis examines Intercontinental Exchange, Inc.’s strategic positioning, revenue segments, and key products. I will assess whether the company holds a competitive advantage over its main rivals in financial data and stock exchanges.
Strategic Positioning
Intercontinental Exchange, Inc. maintains a diversified product portfolio across Exchanges, Fixed Income and Data Services, and Mortgage Technology segments. Geographically, it generates significant revenue from the United States and the UK, Continental Europe, and Canada, reflecting broad market exposure.
Revenue by Segment
The pie chart displays Intercontinental Exchange, Inc.’s revenue distribution by segment for the fiscal year 2025.
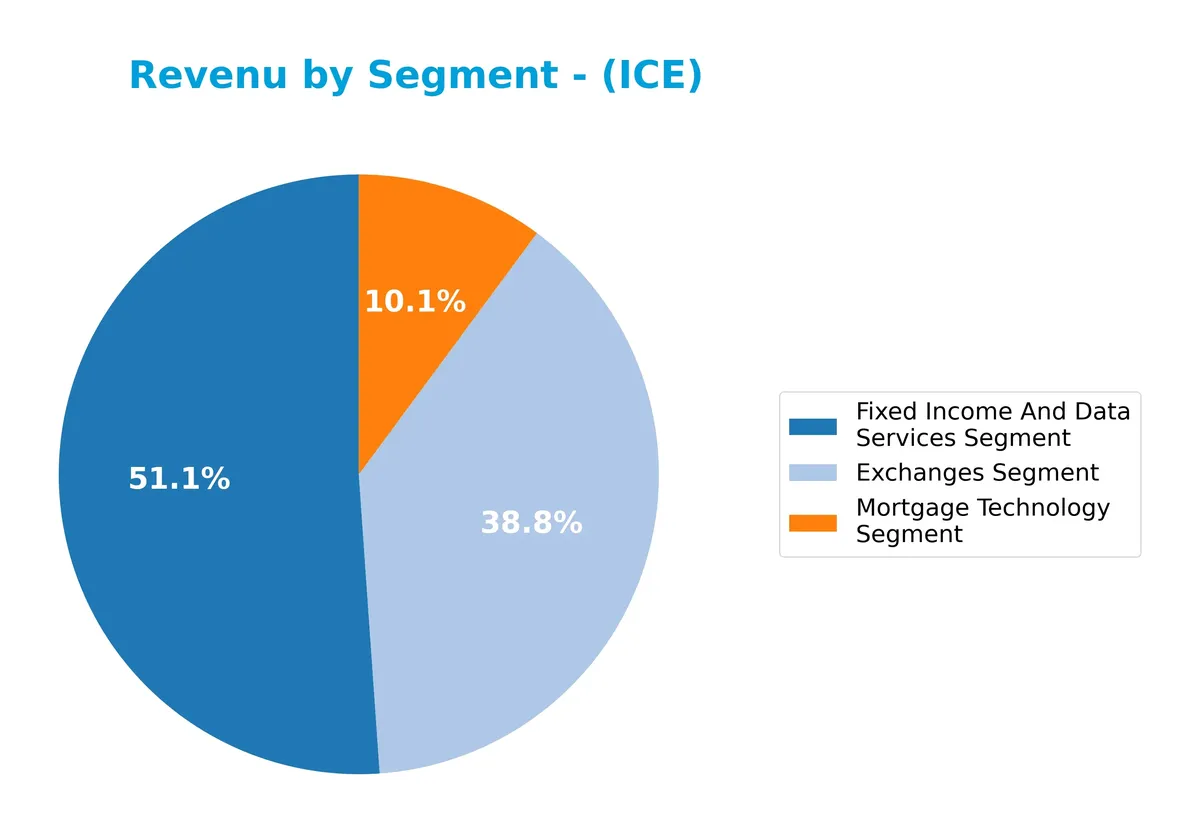
In 2025, Fixed Income And Data Services leads with $1.36B, followed by Exchanges at $1.03B, and Mortgage Technology at $269M. The data shows steady growth in Fixed Income and Exchanges segments since 2024, signaling a strong push in core trading and data services. Mortgage Technology remains a smaller but consistent contributor, indicating moderate diversification without concentration risk.
Key Products & Brands
The table below outlines Intercontinental Exchange, Inc.’s main products and brands across its business segments:
| Product | Description |
|---|---|
| Exchanges Segment | Operates 13 regulated exchanges and 6 clearing houses for commodities, financial, fixed income, equity markets. |
| Fixed Income and Data Services Segment | Provides fixed income data, analytics, execution, CDS clearing, and multi-asset class data and network services. |
| Mortgage Technology Segment | Offers a proprietary mortgage origination platform, closing solutions, and data and analytics for lenders. |
Intercontinental Exchange generates revenue through diversified financial marketplaces, data services, and mortgage technology. Its business model blends regulated trading venues with advanced technology platforms, serving multiple asset classes worldwide.
Main Competitors
There are 9 competitors in total; below is a table of the top 10 leaders by market capitalization:
| Competitor | Market Cap. |
|---|---|
| S&P Global Inc. | 155.2B |
| CME Group Inc. | 97.2B |
| Intercontinental Exchange, Inc. | 91.7B |
| Moody’s Corporation | 89.7B |
| Coinbase Global, Inc. | 60.5B |
| Nasdaq, Inc. | 55.5B |
| MSCI Inc. | 43.7B |
| Cboe Global Markets, Inc. | 25.9B |
| FactSet Research Systems Inc. | 10.8B |
Intercontinental Exchange, Inc. ranks 3rd among nine competitors, holding 62% of the top player’s market cap. It stands above both the average market cap of 70B and median sector cap of 60.5B. The company is narrowly ahead of its closest rival by 0.95%, reflecting a tight race for second place.
Comparisons with competitors
Check out how we compare the company to its competitors:
Does ICE have a competitive advantage?
Intercontinental Exchange, Inc. shows a slightly unfavorable competitive advantage as it currently destroys value with ROIC below WACC. However, its profitability is improving, signaling potential operational efficiency gains.
Looking ahead, ICE’s diversified global exchanges and technology platforms provide opportunities in expanding fixed income data services and mortgage technology. Growth in international markets and new product offerings could support future competitive positioning.
SWOT Analysis
This analysis highlights Intercontinental Exchange, Inc.’s key internal and external factors shaping its strategic landscape.
Strengths
- strong gross margin at 76%
- diversified global market presence
- robust data and technology offerings
Weaknesses
- unfavorable EBIT margin at 0%
- value destruction indicated by ROIC below WACC
- high P/E and P/B ratios suggest overvaluation
Opportunities
- growing fixed income and data services demand
- expansion in mortgage technology sector
- increasing cross-border market integration
Threats
- intense competition in financial exchanges
- regulatory changes in multiple jurisdictions
- vulnerability to economic cycles impacting trading volumes
ICE’s strengths in margin and market reach contrast with profitability challenges and valuation concerns. Capitalizing on data services growth while managing regulatory risks is critical for value creation.
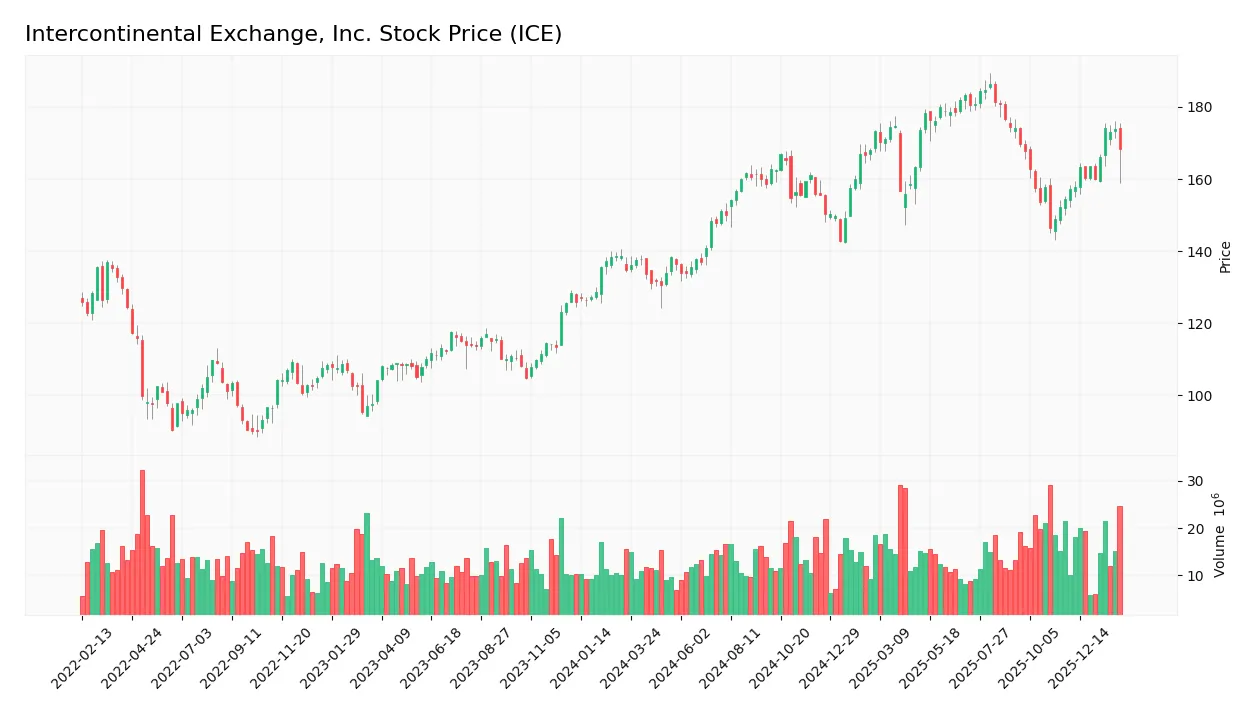
Stock Price Action Analysis
The weekly stock chart of Intercontinental Exchange, Inc. (ICE) illustrates price movements over the past 12 months, highlighting key support and resistance levels:
Trend Analysis
Over the past 12 months, ICE’s stock price increased by 25%, indicating a bullish trend with acceleration. The price range extended from a low of 130.5 to a high of 186.4. Volatility remains significant, with a standard deviation of 14.82%.
Volume Analysis
Trading volume over the last three months shows buyer dominance at 67%, with buyer volume rising to 127M versus seller volume at 62M. Volume trends upward, signaling growing investor interest and positive market participation.
Target Prices
Analysts project a target consensus of $190.5 for Intercontinental Exchange, Inc. (ICE).
| Target Low | Target High | Consensus |
|---|---|---|
| 180 | 211 | 190.5 |
The price targets reflect confidence in ICE’s growth, with a moderate upside potential from current levels.

Don’t Let Luck Decide Your Entry Point
Optimize your entry points with our advanced ProRealTime indicators. You’ll get efficient buy signals with precise price targets for maximum performance. Start outperforming now!
Analyst & Consumer Opinions
I present an overview of grades and consumer feedback regarding Intercontinental Exchange, Inc. (ICE) for balanced insight.
Stock Grades
Here are the latest verified grades for Intercontinental Exchange, Inc. from well-known financial institutions:
| Grading Company | Action | New Grade | Date |
|---|---|---|---|
| Morgan Stanley | Maintain | Equal Weight | 2026-01-15 |
| TD Cowen | Maintain | Buy | 2026-01-14 |
| Piper Sandler | Maintain | Overweight | 2026-01-14 |
| Barclays | Maintain | Overweight | 2026-01-08 |
| UBS | Maintain | Buy | 2026-01-07 |
| Morgan Stanley | Maintain | Equal Weight | 2025-12-22 |
| Barclays | Maintain | Overweight | 2025-10-31 |
| UBS | Maintain | Buy | 2025-10-31 |
| JP Morgan | Maintain | Overweight | 2025-10-31 |
| TD Cowen | Maintain | Buy | 2025-10-31 |
The grades consistently favor a positive stance, with multiple firms maintaining Buy or Overweight ratings. Morgan Stanley remains more cautious, holding an Equal Weight rating, reflecting a balanced outlook among analysts.
Consumer Opinions
Consumer sentiment around Intercontinental Exchange, Inc. (ICE) reflects mixed experiences, revealing key strengths and areas needing improvement.
| Positive Reviews | Negative Reviews |
|---|---|
| Reliable platform with fast trade execution. | Customer service response times can lag. |
| Robust data analytics supporting trading. | Interface complexity challenges new users. |
| Strong market presence and liquidity. | Occasional technical glitches reported. |
Overall, users praise ICE’s execution speed and market reach, core advantages in financial trading. However, customer support delays and a steep learning curve pose recurring concerns for newcomers.
Risk Analysis
Below is a table summarizing key risks for Intercontinental Exchange, Inc. and their likelihood and potential impact:
| Category | Description | Probability | Impact |
|---|---|---|---|
| Financial Distress | Altman Z-Score of 0.89 indicates high bankruptcy risk, flagged as distress. | High | Severe |
| Valuation | Elevated P/E of 27.95 and P/B of 3.2 suggest overvaluation risk. | Moderate | Moderate |
| Profitability | ROIC of 7.1% slightly below WACC of 7.62%, indicating limited value creation. | Moderate | Moderate |
| Liquidity | Current ratio of 1.02 is barely adequate, posing liquidity risks. | Moderate | Moderate |
| Interest Coverage | Negative interest coverage ratio signals potential difficulty servicing debt. | Low | Severe |
| Market Volatility | Beta near 1.03 implies stock price moves roughly with the market. | Moderate | Moderate |
The most alarming risk is the distress-zone Altman Z-Score, signaling financial instability despite a strong Piotroski score of 7. Overvaluation risks persist given lofty multiples, while liquidity and interest coverage weaknesses warrant caution. Investors should weigh these risks carefully against ICE’s solid market position and moderate profitability.
Should You Buy Intercontinental Exchange, Inc.?
Intercontinental Exchange, Inc. appears to be in a moderate financial position with improving profitability but a slightly unfavorable moat, as it currently destroys value despite rising returns. Its leverage profile is substantial, and the overall B- rating suggests cautious value creation potential.
Strength & Efficiency Pillars
Intercontinental Exchange, Inc. shows solid profitability with a net margin of 26.23% and a return on equity of 11.43%. Its weighted average cost of capital (WACC) stands at 7.62%, slightly above its ROIC of 7.1%, indicating the company is currently shedding value. However, the Piotroski score of 7 signals strong financial health, and the quick ratio of 1.02 reflects good short-term liquidity. The firm’s gross margin of 76.34% and fixed asset turnover of 4.7 further highlight operational efficiency.
Weaknesses and Drawbacks
Valuation metrics pose concerns, as the P/E ratio at 27.95 and P/B ratio at 3.2 are unfavorable, suggesting a premium valuation that may limit upside. The Altman Z-score of 0.89 places ICE in the distress zone, signaling elevated bankruptcy risk. Interest coverage is negative, reflecting potential struggles to service debt costs. Asset turnover is low at 0.09, indicating inefficiency in using assets to generate revenue. These factors increase financial vulnerability amid market fluctuations.
Our Verdict about Intercontinental Exchange, Inc.
Intercontinental Exchange has a mixed fundamental profile with favorable profitability but notable valuation and solvency risks. The long-term bullish stock trend combined with recent buyer dominance (67.13%) suggests positive market sentiment. Despite these strengths, the distress zone Altman Z-score and elevated valuation metrics recommend caution. The profile may appear attractive for long-term exposure but suggests a prudent, wait-and-see approach for timing entry.
Disclaimer: This content is for informational purposes only and does not constitute financial, investment, or other professional advice. Investing in financial markets involves a significant risk of loss, and past performance is not indicative of future results.
Additional Resources
- Intercontinental Exchange (NYSE:ICE) Reports Upbeat Q4 CY2025 – Finviz (Feb 05, 2026)
- Intercontinental Exchange Announces 8% Increase to its Quarterly Dividend – Yahoo Finance (Feb 05, 2026)
- Intercontinental Exchange tops Q4 earnings consensus, delivers expense guide (ICE:NYSE) – Seeking Alpha (Feb 05, 2026)
- NYSE Owner Gets SEC Approval for Treasury Clearinghouse – Bloomberg (Feb 02, 2026)
- Intercontinental Exchange Q4 Earnings Assessment – Benzinga (Feb 05, 2026)
For more information about Intercontinental Exchange, Inc., please visit the official website: ice.com