Home > Analyses > Financial Services > Interactive Brokers Group, Inc.
Interactive Brokers Group, Inc. revolutionizes how investors access global markets, executing millions of trades seamlessly every day. As a pioneer in electronic brokerage, it dominates investment banking services with a vast product range from stocks to cryptocurrencies. Renowned for innovation and cost efficiency, Interactive Brokers shapes the trading landscape for institutions and individuals alike. The key question now: does its robust platform and market presence still justify its lofty valuation and growth expectations?

Table of contents
Business Model & Company Overview
Interactive Brokers Group, Inc., founded in 1977 and headquartered in Greenwich, Connecticut, stands as a dominant electronic broker in investment banking and services. It operates a seamless ecosystem facilitating the execution, clearance, and settlement of diverse financial instruments such as stocks, options, futures, and cryptocurrencies. This comprehensive platform supports a broad client base from individual investors to hedge funds, integrating custody, prime brokerage, and margin lending into its core mission.
The company’s revenue engine balances transaction-based fees with recurring custody and lending services, creating a resilient income stream. Operating globally across the Americas, Europe, and Asia, it leverages electronic exchanges and market centers to deliver efficient access worldwide. Interactive Brokers’ competitive advantage lies in its sophisticated technology and scale, cementing its role as a shaping force in automated brokerage and financial market infrastructure.
Financial Performance & Fundamental Metrics
I analyze Interactive Brokers Group, Inc.’s income statement, key financial ratios, and dividend payout policy to reveal its profitability and capital allocation strength.
Income Statement
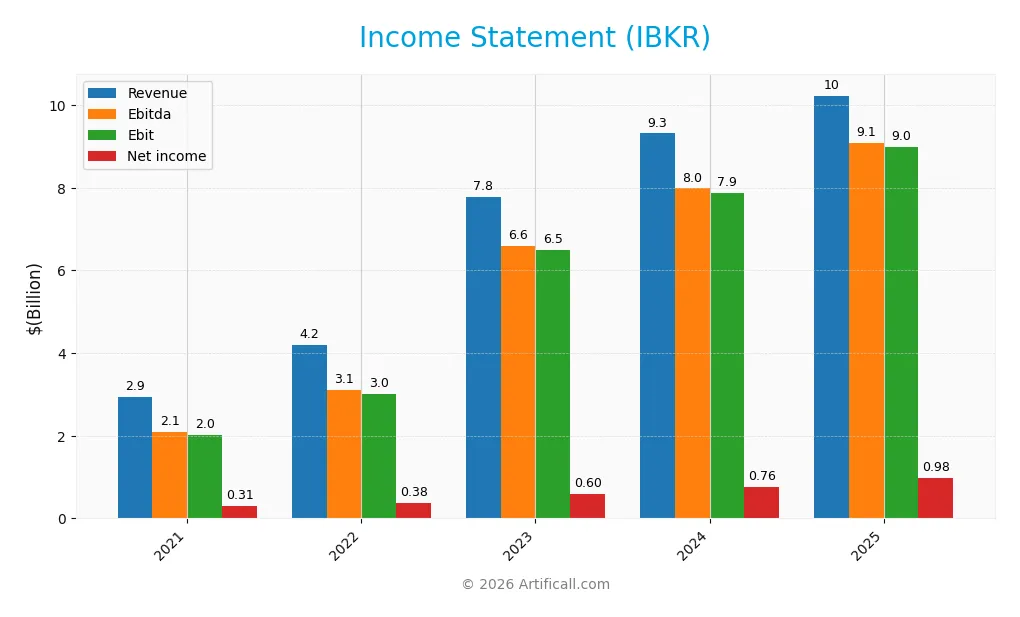
The table below summarizes Interactive Brokers Group, Inc.’s income statement data for fiscal years 2021 through 2025, showing key profitability metrics and earnings per share.
| 2021 | 2022 | 2023 | 2024 | 2025 | |
|---|---|---|---|---|---|
| Revenue | 2.94B | 4.19B | 7.79B | 9.32B | 10.23B |
| Cost of Revenue | 635M | 778M | 913M | 1.02B | 1.05B |
| Operating Expenses | 289M | 288M | 351M | 454M | 388M |
| Gross Profit | 2.31B | 3.41B | 6.87B | 8.30B | 9.19B |
| EBITDA | 2.09B | 3.11B | 6.60B | 7.99B | 9.09B |
| EBIT | 2.01B | 3.02B | 6.51B | 7.89B | 8.99B |
| Interest Expense | 224M | 1.02B | 3.44B | 4.19B | 4.22B |
| Net Income | 308M | 380M | 600M | 755M | 984M |
| EPS | 0.82 | 0.95 | 1.43 | 1.75 | 2.23 |
| Filing Date | 2022-02-25 | 2023-02-24 | 2023-12-31 | 2025-02-27 | 2026-02-27 |
Income Statement Evolution
Interactive Brokers Group’s revenue grew steadily from 3B in 2021 to 10.2B in 2025, marking a 248% increase overall. Net income rose from 308M to 984M over the same period, with net margin slightly declining by 8.2%. Gross and EBIT margins remained robust above 87%, signaling strong operational efficiency despite margin pressure.
Is the Income Statement Favorable?
In 2025, fundamentals appear favorable with revenue growth near 10% year-on-year and a 14% rise in EBIT. Gross margin stands at a healthy 89.8%, supporting an EBIT margin of 87.9%. However, interest expenses consume over 41% of revenue, posing a notable risk. Net margin at 9.6% and EPS growth of 28% reflect solid profitability despite this headwind.
Financial Ratios
The following table presents key financial ratios for Interactive Brokers Group, Inc. (IBKR) over the fiscal years 2021 to 2025:
| Ratios | 2021 | 2022 | 2023 | 2024 | 2025 |
|---|---|---|---|---|---|
| Net Margin | 10% | 9.1% | 7.7% | 8.1% | 9.6% |
| ROE | 12.9% | 13.3% | 16.7% | 17.6% | 18.3% |
| ROIC | 8.3% | 13.9% | 23.3% | 21.8% | -13.0% |
| P/E | 24.3 | 19.1 | 14.5 | 25.3 | 29.1 |
| P/B | 3.12 | 2.55 | 2.43 | 4.46 | 5.34 |
| Current Ratio | 1.14 | 1.09 | 1.12 | 1.16 | 0.61 |
| Quick Ratio | 1.14 | 1.09 | 1.12 | 1.16 | 0.61 |
| D/E | 4.93 | 3.15 | 3.17 | 3.80 | 0.00 |
| Debt-to-Assets | 11% | 7.8% | 8.9% | 11% | 0.01% |
| Interest Coverage | 9.0 | 3.07 | 1.90 | 1.87 | 2.09 |
| Asset Turnover | 0.027 | 0.036 | 0.061 | 0.062 | 0.050 |
| Fixed Asset Turnover | 0 | 0 | 0 | 0 | 0 |
| Dividend Yield | 0.51% | 0.55% | 0.48% | 0.48% | 0.47% |
Evolution of Financial Ratios
Interactive Brokers’ Return on Equity (ROE) improved steadily, reaching 18.35% in 2025, indicating stronger profitability. The Current Ratio declined from above 1.1 in earlier years to 0.61 in 2025, signaling reduced liquidity. Debt-to-Equity Ratio fell sharply to near zero, reflecting significant deleveraging. Profit margins remained relatively stable with a slight net margin increase.
Are the Financial Ratios Favorable?
In 2025, ROE stands favorable, but Return on Invested Capital (ROIC) is negative, signaling inefficiency versus its 11.84% WACC. Liquidity ratios, including Current and Quick Ratios at 0.61, are unfavorable, posing risk in short-term obligations. Leverage is minimal, with debt-to-equity near zero, a positive sign. Market valuation ratios like P/E at 29.11 and P/B at 5.34 are high, contributing to an overall unfavorable financial ratio assessment.
Shareholder Return Policy
Interactive Brokers Group, Inc. maintains a moderate dividend payout ratio around 12-14%, with dividends per share steadily rising from $0.10 in 2021 to $0.30 in 2025. The annual dividend yield remains below 0.6%, supported by consistent free cash flow coverage and periodic share buybacks.
This disciplined approach balances shareholder returns with reinvestment, indicating sustainable distribution. However, the modest yield and payout ratio suggest cautious capital allocation to preserve long-term value amid market cycles.
Score analysis
Here is a comprehensive view of Interactive Brokers Group, Inc.’s fundamental scores across key valuation and profitability metrics:
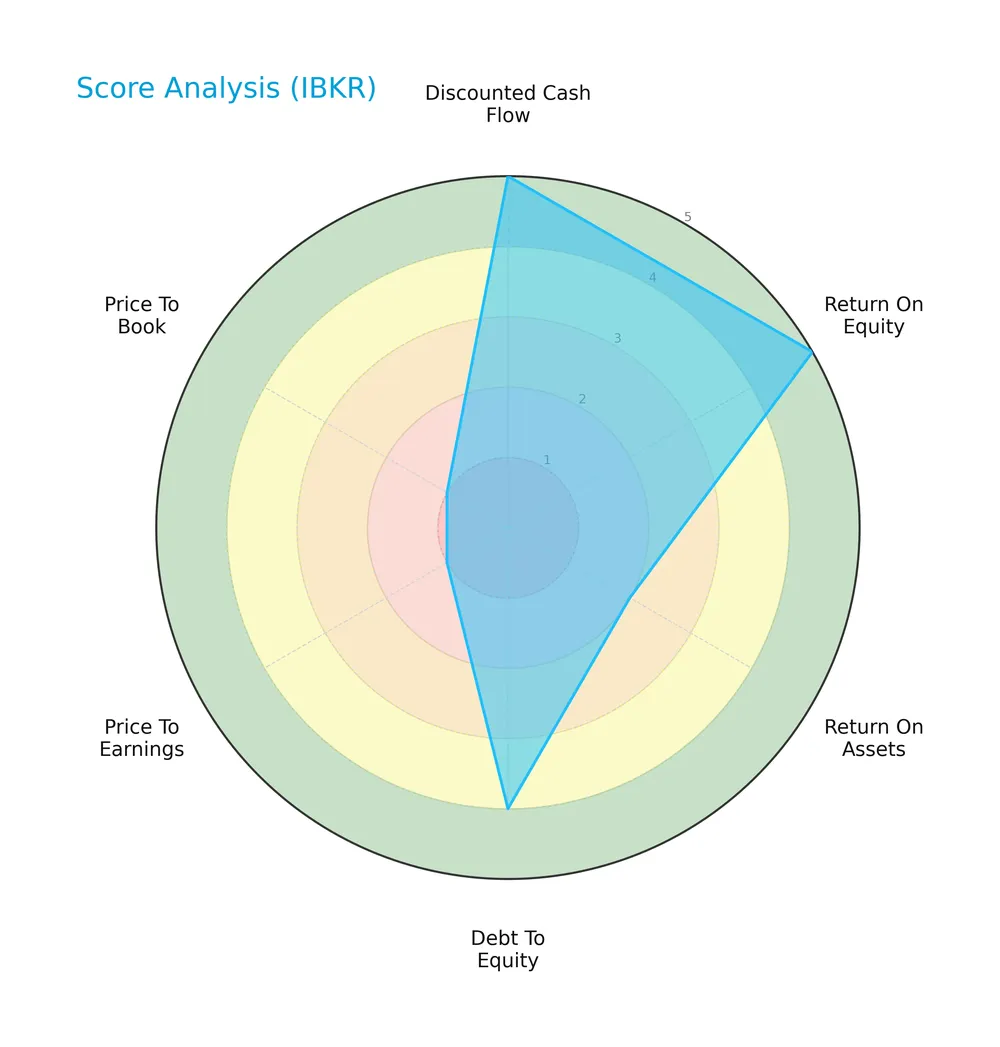
The company scores very favorably on discounted cash flow and return on equity, indicating strong intrinsic value and effective capital use. Debt-to-equity is favorable, suggesting manageable leverage. However, return on assets is weak, and valuation multiples (PE and PB) are very unfavorable, reflecting market skepticism or valuation concerns. Overall, the score mix is moderate.
Analysis of the company’s bankruptcy risk
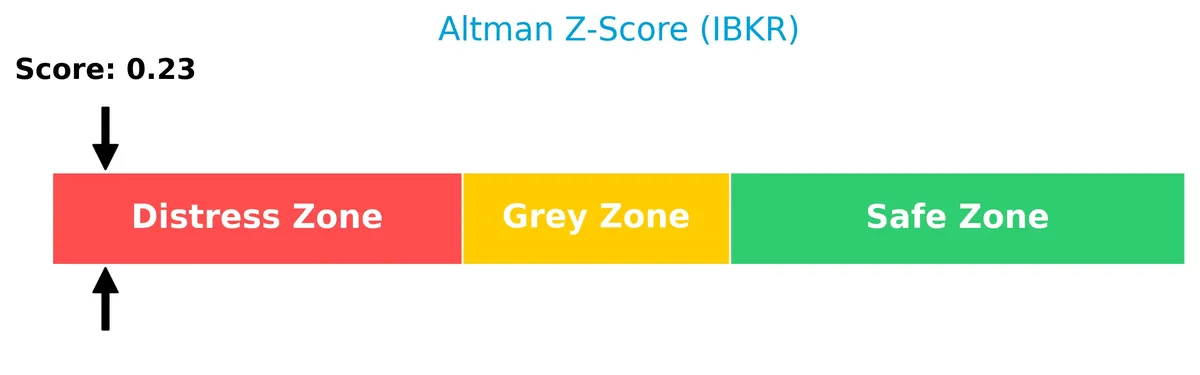
Interactive Brokers currently sits deep in the distress zone based on its Altman Z-Score, highlighting a very high risk of financial distress and potential bankruptcy:
Is the company in good financial health?
The Piotroski Score diagram illustrates the company’s financial strength based on nine criteria that assess profitability, leverage, and efficiency:

With a score of 6, Interactive Brokers demonstrates average financial health. This suggests some strengths in operational performance, though it is not among the strongest candidates in its sector.
Competitive Landscape & Sector Positioning
This sector analysis explores Interactive Brokers Group, Inc.’s strategic positioning, revenue segments, and key products. I will evaluate whether the company holds a competitive advantage over its main rivals in financial services.
Strategic Positioning
Interactive Brokers Group, Inc. concentrates on electronic brokerage with a strong U.S. presence generating $4.3B in 2025 revenue. It diversifies across multiple asset classes and global markets, with non-U.S. revenue reaching $1.9B, reflecting balanced geographic expansion within investment services.
Revenue by Segment
The pie chart illustrates Interactive Brokers Group, Inc.’s revenue breakdown by segment for the fiscal year 2025, highlighting key income sources that drive the business.
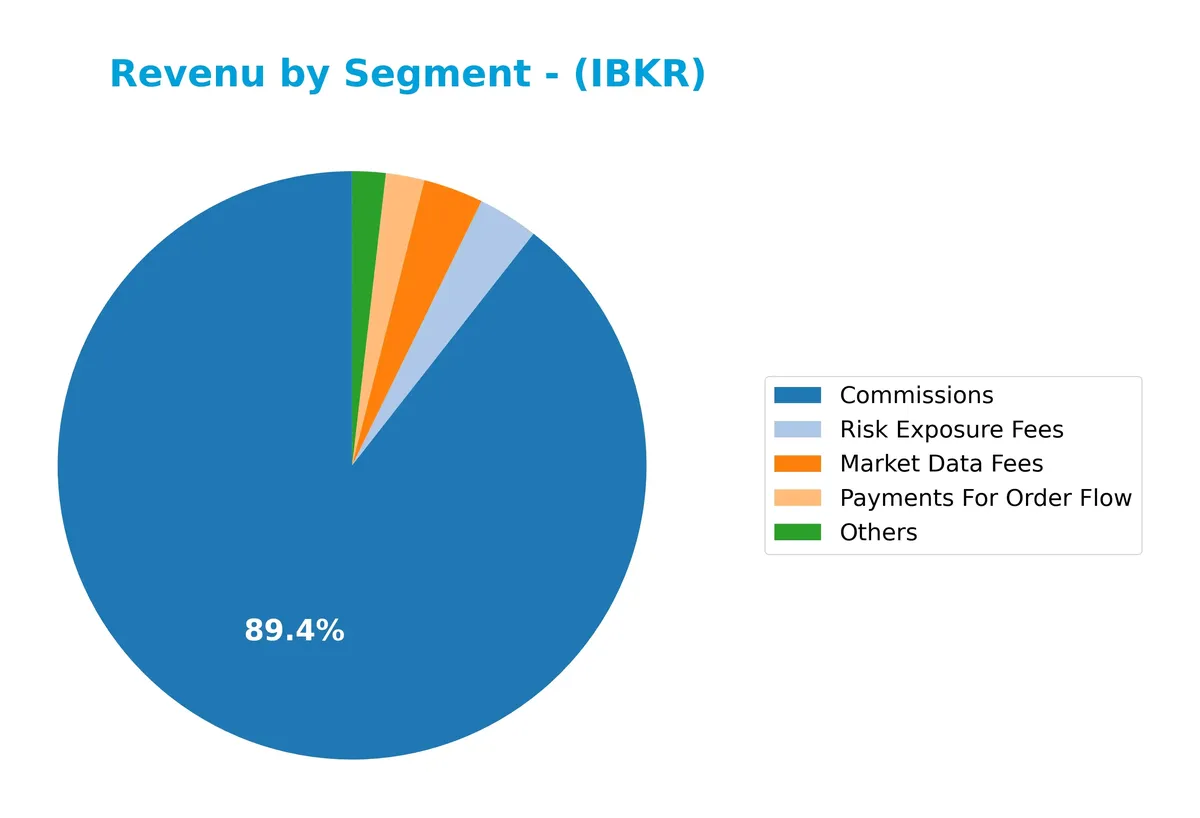
Commissions dominate with $2.15B in 2025, showing a strong growth trend from prior years. Market Data Fees and Risk Exposure Fees contribute modestly at $79M and $80M, respectively. Payments For Order Flow and Others remain smaller but stable components. The recent acceleration in commissions underscores Interactive Brokers’ core brokerage strength, though reliance on this single segment poses concentration risk.
Key Products & Brands
The table below outlines Interactive Brokers Group’s main revenue-generating products and services:
| Product | Description |
|---|---|
| Commissions | Fees from executing trades in stocks, options, futures, forex, bonds, ETFs, and cryptocurrencies. |
| Market Data Fees | Charges for providing real-time and historical market data to clients. |
| Payments For Order Flow | Revenue earned by routing client orders to market makers or exchanges. |
| Risk Exposure Fees | Fees related to managing credit and market risk on client positions. |
| Account Activity Fees | Charges for account maintenance and related services. |
| Others | Miscellaneous income sources, including ancillary services. |
Interactive Brokers generates most of its revenue from commissions on diverse asset trades, supported by market data and risk management fees. The mix reflects its broad electronic brokerage model serving both institutional and retail clients.
Main Competitors
Interactive Brokers Group, Inc. faces competition from 71 firms in its sector. The table below lists the top 10 leaders by market capitalization:
| Competitor | Market Cap. |
|---|---|
| Berkshire Hathaway Inc. | 1.07T |
| JPMorgan Chase & Co. | 886B |
| Visa Inc. | 672B |
| Mastercard Incorporated | 506B |
| Bank of America Corporation | 409B |
| Wells Fargo & Company | 310B |
| Morgan Stanley | 289B |
| The Goldman Sachs Group, Inc. | 287B |
| American Express Company | 260B |
| Citigroup Inc. | 221B |
Interactive Brokers ranks 18th among 71 competitors. Its market cap is roughly 11.5% of Berkshire Hathaway’s, the sector leader. The company sits below the average market cap of the top 10 (491B) but above the sector median (55B). It holds a slim 0.88% lead over its nearest competitor above, indicating tight competition in its immediate peer group.
Comparisons with competitors
Check out how we compare the company to its competitors:
Aucun article trouvé pour ces critères.
Does IBKR have a competitive advantage?
Interactive Brokers Group, Inc. currently lacks a competitive advantage, as its ROIC falls well below its WACC, indicating value destruction and declining profitability. Despite strong revenue and profit growth, the company struggles to generate returns above its cost of capital.
Looking ahead, IBKR continues to expand its presence in U.S. and international markets, with growth in diversified trading products and custody services. These opportunities may support future scale, but the deteriorating return on invested capital remains a significant challenge.
SWOT Analysis
This analysis identifies Interactive Brokers Group, Inc.’s core strengths, weaknesses, opportunities, and threats to guide strategic decisions.
Strengths
- strong market position
- diversified product offerings
- robust revenue growth
Weaknesses
- negative ROIC vs. WACC
- low liquidity ratios
- high valuation multiples
Opportunities
- expanding international revenues
- growing demand for electronic brokerage
- innovation in crypto and fintech
Threats
- intense industry competition
- regulatory risks
- margin pressure from rising interest costs
Interactive Brokers exhibits solid growth and market reach but faces value destruction and liquidity concerns. The company must leverage global expansion and innovation while managing competitive and regulatory headwinds.
Stock Price Action Analysis
The weekly stock chart for Interactive Brokers Group, Inc. (IBKR) highlights significant price movement and volatility over the past 12 months:
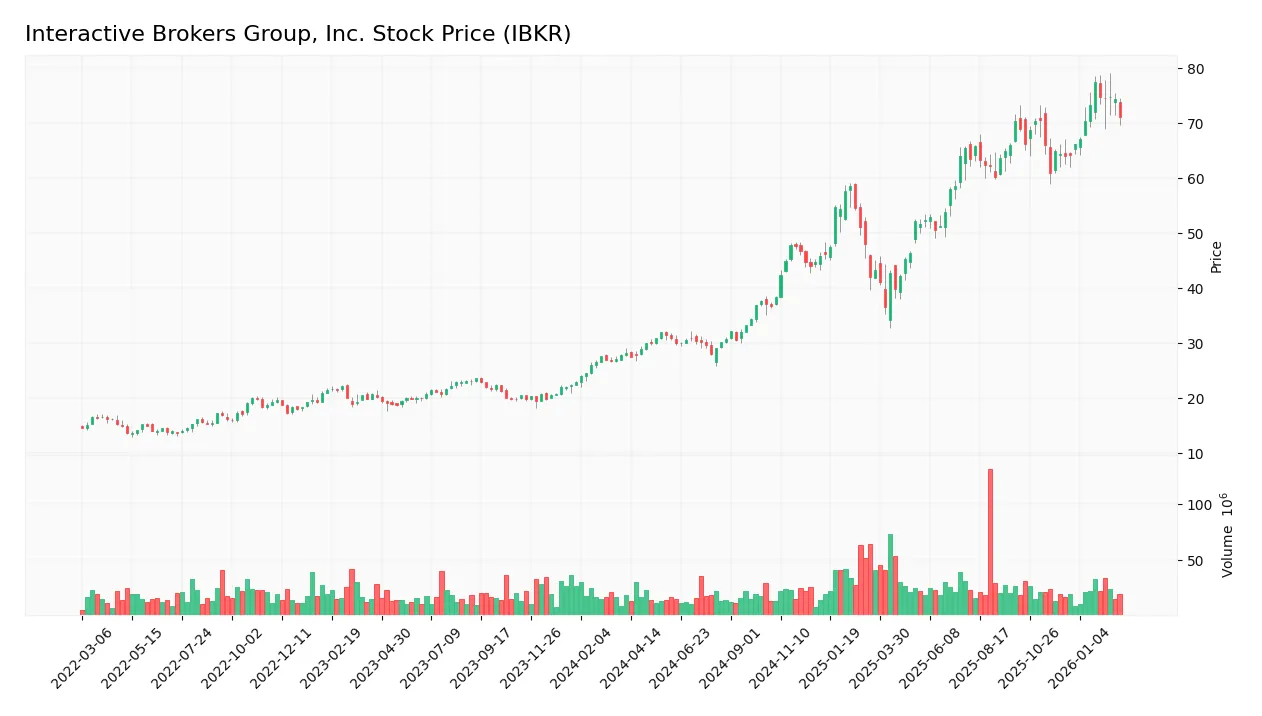
Trend Analysis
Over the past 12 months, IBKR’s stock price rose 153%, indicating a strong bullish trend with clear acceleration. The price ranged from a low of 27.6 to a high of 77.58, with volatility measured at a 15.09 standard deviation, confirming active market swings.
Volume Analysis
Trading volumes have increased, with buyers accounting for 56% of activity in the recent three-month period. This slight buyer dominance and rising volume suggest growing investor confidence and stronger market participation in IBKR shares.
Target Prices
Analysts set a clear target consensus for Interactive Brokers Group, Inc. based on current market data.
| Target Low | Target High | Consensus |
|---|---|---|
| 80 | 91 | 84 |
The target range suggests moderate upside potential, with analysts expecting the stock to trade around 84 in the near term. This reflects cautious optimism amid market volatility.

Don’t Let Luck Decide Your Entry Point
Optimize your entry points with our advanced ProRealTime indicators. You’ll get efficient buy signals with precise price targets for maximum performance. Start outperforming now!
Analyst & Consumer Opinions
This section examines Interactive Brokers Group, Inc. (IBKR) through analyst ratings and consumer feedback for comprehensive insight.
Stock Grades
Here are the latest verified analyst grades for Interactive Brokers Group, Inc., reflecting consistent views across major firms:
| Grading Company | Action | New Grade | Date |
|---|---|---|---|
| Barclays | Maintain | Overweight | 2026-01-21 |
| BMO Capital | Maintain | Outperform | 2026-01-21 |
| Barclays | Maintain | Overweight | 2026-01-08 |
| Barclays | Maintain | Overweight | 2025-12-12 |
| Barclays | Maintain | Overweight | 2025-10-17 |
| BMO Capital | Maintain | Outperform | 2025-10-17 |
| Barclays | Maintain | Overweight | 2025-10-08 |
| Barclays | Maintain | Overweight | 2025-07-18 |
| Piper Sandler | Maintain | Overweight | 2025-07-18 |
| Piper Sandler | Maintain | Overweight | 2025-07-15 |
The grades show a stable consensus favoring the stock, with Barclays and Piper Sandler consistently assigning “Overweight” and BMO Capital endorsing “Outperform.” The trend highlights steady confidence with no recent downgrades.
Consumer Opinions
Interactive Brokers Group, Inc. (IBKR) consistently earns praise for its advanced trading platform, though some users find its complexity challenging.
| Positive Reviews | Negative Reviews |
|---|---|
| Robust trading tools and fast execution | Steep learning curve for beginners |
| Low commissions and transparent fees | Customer service can be slow |
| Wide market access and product variety | Platform interface feels outdated |
Overall, consumers appreciate IBKR’s cost efficiency and market reach. However, complexity and support delays remain common hurdles. These insights reflect a platform built for experienced traders but less accessible for novices.
Risk Analysis
Below is a detailed table summarizing key risks Interactive Brokers Group, Inc. faces in 2026:
| Category | Description | Probability | Impact |
|---|---|---|---|
| Financial Health | Altman Z-Score signals high bankruptcy risk, currently in distress zone (0.23). | High | Severe |
| Profitability | ROIC is negative (-13%) vs. WACC (11.84%), indicating value destruction. | Medium | High |
| Liquidity | Current and quick ratios at 0.61, well below 1, pose short-term funding risks. | High | Moderate |
| Valuation | Elevated P/E (29.11) and P/B (5.34) ratios suggest overvaluation. | Medium | Moderate |
| Market Volatility | Beta at 1.224 implies higher sensitivity to market swings. | Medium | Moderate |
| Dividend Yield | Low yield at 0.47% reduces income appeal during uncertain markets. | Low | Low |
The most alarming risk is financial distress, reflected by the Altman Z-Score deep in the distress zone. Negative ROIC relative to WACC indicates the company struggles to generate returns above its cost of capital, a critical long-term red flag. Liquidity constraints add pressure amid volatile markets, underscoring the need for cautious position sizing. Valuation metrics remain stretched compared to S&P 500 averages, heightening downside risk if growth falters.
Should You Buy Interactive Brokers Group, Inc.?
Interactive Brokers appears to be navigating a challenging phase with declining operational efficiency and a deteriorating competitive moat, suggesting value erosion. Despite manageable leverage and a respectable B+ rating, its overall financial health could be seen as moderate, warranting cautious interpretation.
Strength & Efficiency Pillars
Interactive Brokers Group, Inc. showcases operational strength with a robust gross margin of 89.78% and an EBIT margin of 87.86%. The net margin stands at a moderate 9.62%, reflecting solid profitability. Return on equity is favorable at 18.35%, signaling effective equity use. However, the company’s return on invested capital is negative at -13.0%, falling short of its 11.84% WACC, indicating it is currently destroying value rather than creating it.
Weaknesses and Drawbacks
The company is in financial distress, with an Altman Z-Score of 0.23, signaling a high bankruptcy risk. This solvency concern outweighs other factors. Valuation metrics are unfavorable: a high P/E of 29.11 and a P/B of 5.34 suggest an expensive stock relative to earnings and book value. Liquidity is weak with a current ratio of 0.61, raising short-term solvency red flags. Despite a zero debt-to-equity ratio, interest expense remains high at 41.23%, pressuring financial flexibility.
Our Final Verdict about Interactive Brokers Group, Inc.
Despite operational profitability and a bullish stock trend, the company’s severe solvency risk makes its profile highly speculative. The Altman Z-Score firmly places it in the distress zone, overshadowing favorable income metrics. Investors should approach with caution, as the profile may appear too risky for conservative capital, regardless of recent buyer dominance and positive earnings growth.
Disclaimer: This content is for informational purposes only and does not constitute financial, investment, or other professional advice. Investing in financial markets involves a significant risk of loss, and past performance is not indicative of future results.
Additional Resources
- Has Interactive Brokers Group (IBKR) Run Too Far After Its 40% One Year Gain – Yahoo Finance (Feb 27, 2026)
- American Century Companies Inc. Buys 351,136 Shares of Interactive Brokers Group, Inc. $IBKR – MarketBeat (Feb 28, 2026)
- Interactive Brokers (NASDAQ: IBKR) details 2025 operations, capital and risks – Stock Titan (Feb 27, 2026)
- Decoding Interactive Brokers Group Inc (IBKR): A Strategic SWOT Insight – GuruFocus (Feb 28, 2026)
- Brokers Suggest Investing in Interactive Brokers (IBKR): Read This Before Placing a Bet – Finviz (Feb 25, 2026)
For more information about Interactive Brokers Group, Inc., please visit the official website: interactivebrokers.com