Home > Analyses > Technology > Intel Corporation
Intel Corporation powers the digital age by designing and manufacturing the essential chips that run countless devices worldwide. As a titan in the semiconductor industry, Intel is renowned for its flagship CPUs, innovative chipsets, and cutting-edge solutions in AI, autonomous driving, and cloud computing. With a strong reputation for technological leadership and quality, the key question for investors today is whether Intel’s fundamentals still support its growth potential and current market valuation.
Table of contents
Business Model & Company Overview
Intel Corporation, founded in 1968 and headquartered in Santa Clara, California, stands as a dominant player in the semiconductor industry. Its core mission revolves around designing, manufacturing, and selling a comprehensive ecosystem of computing products, including CPUs, chipsets, system-on-chip solutions, and advanced memory and storage technologies. Intel’s portfolio extends into emerging fields such as autonomous driving and AI-driven compute platforms, integrating innovation across consumer, industrial, and cloud sectors.
Intel’s revenue engine balances hardware sales with growing software and recurring service streams, serving original equipment manufacturers, cloud providers, and enterprise clients globally. With strategic operations spanning the Americas, Europe, and Asia, Intel leverages its scale and technological depth to maintain a resilient competitive advantage. This extensive reach and diversified offering sustain its economic moat, ensuring it shapes the future of computing infrastructure worldwide.
Financial Performance & Fundamental Metrics
In this section, I analyze Intel Corporation’s income statement, key financial ratios, and dividend payout policy to assess its overall financial health and investor appeal.
Income Statement
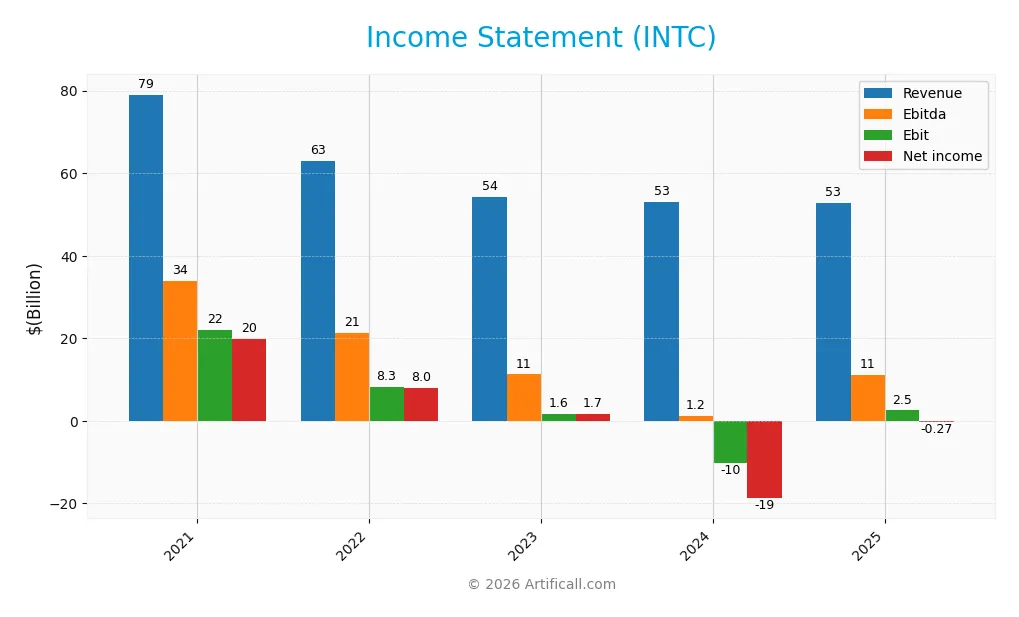
The table below summarizes Intel Corporation’s key income statement figures for the fiscal years 2021 through 2025, reflecting revenue, expenses, and profitability metrics in USD.
| 2021 | 2022 | 2023 | 2024 | 2025 | |
|---|---|---|---|---|---|
| Revenue | 79.0B | 63.1B | 54.2B | 53.1B | 52.9B |
| Cost of Revenue | 35.2B | 36.2B | 32.5B | 35.8B | 34.4B |
| Operating Expenses | 24.4B | 24.5B | 21.7B | 29.0B | 20.6B |
| Gross Profit | 43.8B | 26.9B | 21.7B | 17.3B | 18.5B |
| EBITDA | 33.9B | 21.3B | 11.2B | 1.2B | 11.2B |
| EBIT | 22.1B | 8.3B | 1.6B | -10.2B | 2.5B |
| Interest Expense | 597M | 496M | 878M | 824M | 953M |
| Net Income | 19.9B | 8.0B | 1.7B | -18.8B | -267M |
| EPS | 4.89 | 1.95 | 0.40 | -4.38 | -0.08 |
| Filing Date | 2022-01-27 | 2023-01-27 | 2024-01-26 | 2025-01-31 | 2026-01-23 |
Income Statement Evolution
From 2021 to 2025, Intel’s revenue declined by 33.12%, reaching $52.9B in 2025, indicating a contraction in sales. Despite this, gross profit increased by 6.51% year-over-year to $18.5B, reflecting improved gross margins at 34.96%, which is favorable. However, net income dropped significantly over the period, with a net margin turning negative to -0.51% in 2025, highlighting profitability challenges.
Is the Income Statement Favorable?
In 2025, Intel posted a slight revenue decline of 0.47% but showed a strong 124.67% rebound in EBIT, indicating operational improvements. The gross margin remained favorable at 34.96%, and interest expenses were controlled at 1.8% of revenue. Nevertheless, net income stayed negative at -$267M, resulting in an unfavorable net margin. Overall, the fundamentals in 2025 present a mixed but generally favorable operational performance.
Financial Ratios
The following table presents key financial ratios for Intel Corporation (INTC) over the fiscal years 2021 to 2025, providing insight into profitability, valuation, liquidity, leverage, and efficiency metrics:
| Ratios | 2021 | 2022 | 2023 | 2024 | 2025 |
|---|---|---|---|---|---|
| Net Margin | 25.1% | 12.7% | 3.1% | -35.3% | -0.5% |
| ROE | 20.8% | 7.9% | 1.6% | -18.9% | -0.2% |
| ROIC | 12.2% | 1.5% | 0.1% | -7.1% | 0.0% |
| P/E | 10.5 | 13.5 | 125 | -4.6 | -658.4 |
| P/B | 2.18 | 1.07 | 1.99 | 0.88 | 1.54 |
| Current Ratio | 2.13 | 1.57 | 1.54 | 1.33 | 2.02 |
| Quick Ratio | 1.74 | 1.16 | 1.15 | 0.98 | 1.65 |
| D/E | 0.40 | 0.41 | 0.47 | 0.50 | 0.41 |
| Debt-to-Assets | 22.6% | 23.1% | 25.7% | 25.5% | 22.0% |
| Interest Coverage | 32.6 | 4.7 | 0.1 | -14.2 | -2.2 |
| Asset Turnover | 0.47 | 0.35 | 0.28 | 0.27 | 0.25 |
| Fixed Asset Turnover | 1.25 | 0.78 | 0.56 | 0.49 | 0.50 |
| Dividend Yield | 2.71% | 5.52% | 1.47% | 1.84% | 0.00% |
Evolution of Financial Ratios
Intel’s Return on Equity (ROE) has declined sharply from positive territory in 2021 to a negative -0.23% in 2025, indicating deteriorating profitability. The Current Ratio improved notably, rising from about 1.33 in 2024 to 2.02 in 2025, reflecting enhanced short-term liquidity. Meanwhile, the Debt-to-Equity Ratio decreased from 0.50 in 2024 to 0.41 in 2025, showing a modest reduction in leverage.
Are the Financial Ratios Favorable?
In 2025, Intel’s profitability ratios including net margin (-0.51%) and ROE (-0.23%) are unfavorable, signaling ongoing profit challenges. Liquidity ratios are favorable, with a Current Ratio of 2.02 and Quick Ratio of 1.65, supporting short-term financial stability. Leverage indicators such as Debt-to-Equity (0.41) and Debt-to-Assets (22.03%) are also favorable. Efficiency ratios like Asset Turnover (0.25) and Fixed Asset Turnover (0.5) remain unfavorable. Overall, about 36% of ratios are favorable, 43% unfavorable, and 21% neutral, resulting in a slightly unfavorable global assessment.
Shareholder Return Policy
Intel Corporation does not currently pay dividends, reflecting its negative net profit margin and free cash flow in 2025. The company’s reinvestment strategy appears focused on funding operations and capital expenditures rather than distributing cash to shareholders. Intel also does not show evidence of share buyback programs in the latest fiscal year. This approach suggests a prioritization of internal resource allocation over immediate shareholder payouts, which may align with sustaining long-term value creation amid operational challenges.
Score analysis
Here is a radar chart summarizing key financial scores for Intel Corporation:
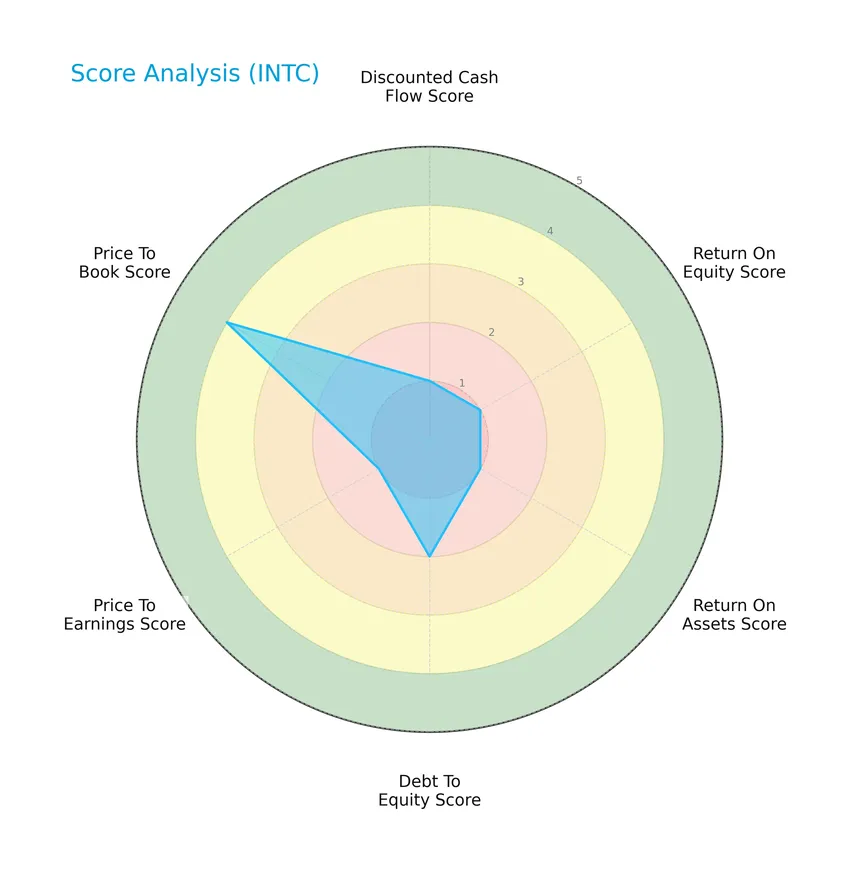
The scores reveal a mixed financial profile: low scores in discounted cash flow, return on equity, return on assets, and price-to-earnings indicate challenges, while debt-to-equity is moderate and price-to-book is favorable, suggesting some valuation strength.
Analysis of the company’s bankruptcy risk
The Altman Z-Score places Intel in the grey zone, indicating a moderate risk of bankruptcy and some financial uncertainty:

Is the company in good financial health?
The following diagram illustrates Intel’s Piotroski Score, assessing its financial strength:
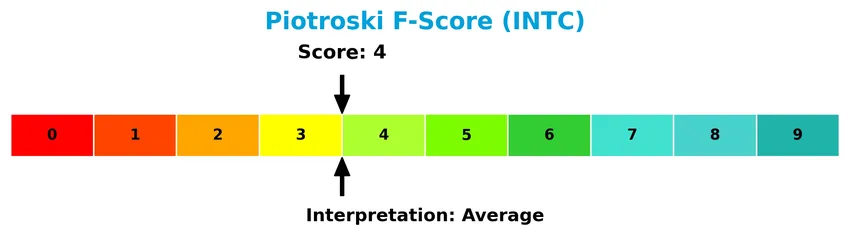
With a Piotroski Score of 4, Intel demonstrates average financial health, reflecting moderate profitability, leverage, and operational efficiency without strong indicators of financial robustness.
Competitive Landscape & Sector Positioning
This section examines Intel Corporation’s strategic positioning, revenue segmentation, and product portfolio within the semiconductor industry. I will assess Intel’s competitive advantages relative to its main competitors through a detailed SWOT analysis.
Strategic Positioning
Intel Corporation maintains a diversified product portfolio across segments such as Client Computing (32.2B in 2025), Data Center (16.9B), and Foundry Services (17.8B), alongside geographic exposure spanning the United States (15.8B), Singapore (9.5B), Taiwan (7.7B), and other countries (7.2B), reflecting a broad global footprint.
Revenue by Segment
The pie chart illustrates Intel Corporation’s revenue distribution by segment for the fiscal year 2025, highlighting the company’s diverse business areas.
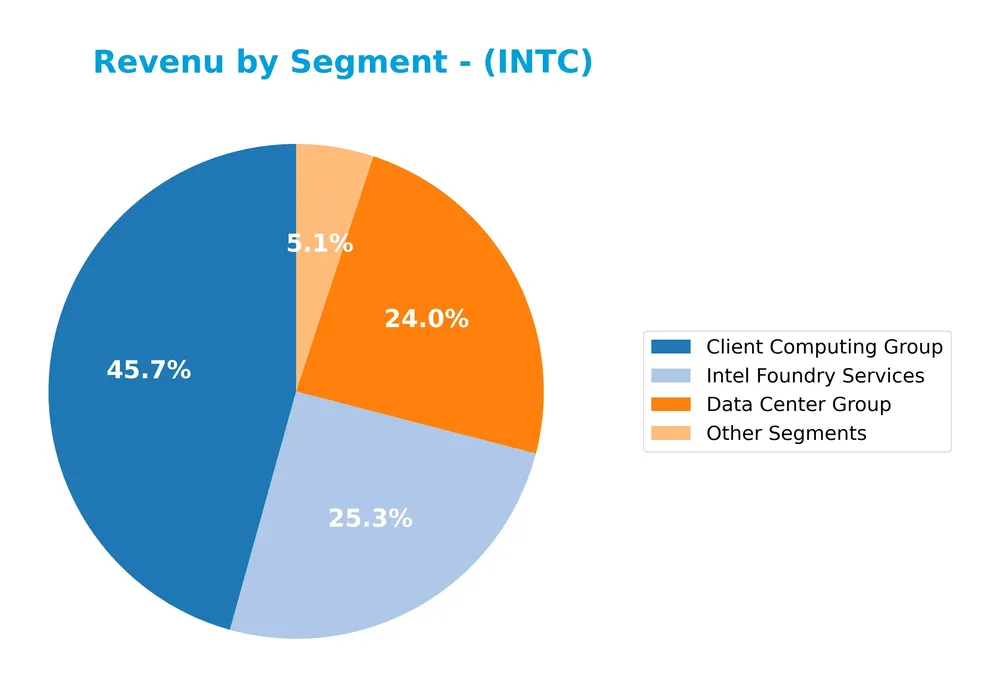
In 2025, the Client Computing Group remains the largest revenue driver at 32.2B, followed by Intel Foundry Services at 17.8B and Data Center Group at 16.9B. The notable growth of Intel Foundry Services compared to prior years indicates a strategic shift towards manufacturing services, while the Data Center Group shows solid performance. Other segments contribute less significantly, and intersegment eliminations reduce consolidated totals, underscoring segment interdependencies. The business is diversifying but still highly reliant on client computing revenues.
Key Products & Brands
The table below outlines Intel Corporation’s main product groups and their descriptions:
| Product | Description |
|---|---|
| Client Computing Group | Central processing units (CPUs), chipsets, and related platform products for personal computers and consumer devices. |
| Data Center Group | High-performance compute solutions including servers and data center platforms serving enterprise, cloud, and government sectors. |
| Intel Foundry Services | Semiconductor manufacturing services, including foundry capabilities for external customers. |
| Internet of Things Group | Embedded computing solutions targeting retail, industrial, and healthcare markets. |
| Mobileye | Solutions for assisted and autonomous driving, including compute platforms, computer vision, sensing, mapping, and driving policy. |
| Other Segments | Includes accelerators, boards, systems, connectivity, graphics, memory and storage products, and other smaller business units. |
Intel’s product portfolio is diversified across computing platforms, data centers, foundry services, IoT, and automotive technologies, addressing a broad range of market verticals and applications.
Main Competitors
There are 38 competitors in the semiconductors industry; below are the top 10 leaders by market capitalization:
| Competitor | Market Cap. |
|---|---|
| NVIDIA Corporation | 4.6T |
| Broadcom Inc. | 1.6T |
| Taiwan Semiconductor Manufacturing Company Limited | 1.6T |
| ASML Holding N.V. | 415B |
| Advanced Micro Devices, Inc. | 363B |
| Micron Technology, Inc. | 353B |
| Lam Research Corporation | 232B |
| Applied Materials, Inc. | 214B |
| QUALCOMM Incorporated | 185B |
| Intel Corporation | 173B |
Intel Corporation ranks 10th among 38 competitors in the semiconductor sector. With a market cap at 4.89% of the leader NVIDIA Corporation, Intel is positioned below the average market cap of the top 10 (974B) but remains above the sector median of 31B. It maintains a solid gap of approximately +17.54% above its closest competitor.
Comparisons with competitors
Check out how we compare the company to its competitors:
Does INTC have a competitive advantage?
Intel Corporation currently does not demonstrate a competitive advantage, as indicated by a negative ROIC compared to WACC and a declining ROIC trend, which signifies value destruction and decreasing profitability. Despite some favorable income statement metrics, the overall moat evaluation is very unfavorable, reflecting challenges in sustaining excess returns.
Looking ahead, Intel’s diverse product segments, including central processing units, autonomous driving solutions, and high-performance compute platforms, offer opportunities for growth in emerging markets such as AI-enhanced drug discovery and cloud services. However, these prospects remain to be fully realized amid ongoing profitability pressures.
SWOT Analysis
This SWOT analysis highlights Intel Corporation’s key internal and external factors to support informed investment decisions.
Strengths
- Strong market presence with $225B market cap
- Diverse product portfolio including CPUs, accelerators, and AI platforms
- Favorable gross margin near 35%
Weaknesses
- Negative net margin and declining profitability
- ROIC below WACC indicating value destruction
- Revenue contraction over the past five years
Opportunities
- Growing demand for AI and autonomous driving technologies
- Expansion in cloud and enterprise verticals
- Strategic partnerships in AI drug discovery
Threats
- Intense semiconductor industry competition
- Geopolitical risks affecting supply chain
- Rapid technological changes requiring heavy R&D investment
Intel’s solid market footprint and product diversity offer growth potential, but persistent profitability issues and industry risks require cautious position sizing. Investors should weigh opportunities in AI and cloud against competitive and geopolitical challenges.
Stock Price Action Analysis
The following weekly chart illustrates Intel Corporation’s stock price movements over the analyzed period, highlighting key fluctuations and trend dynamics:
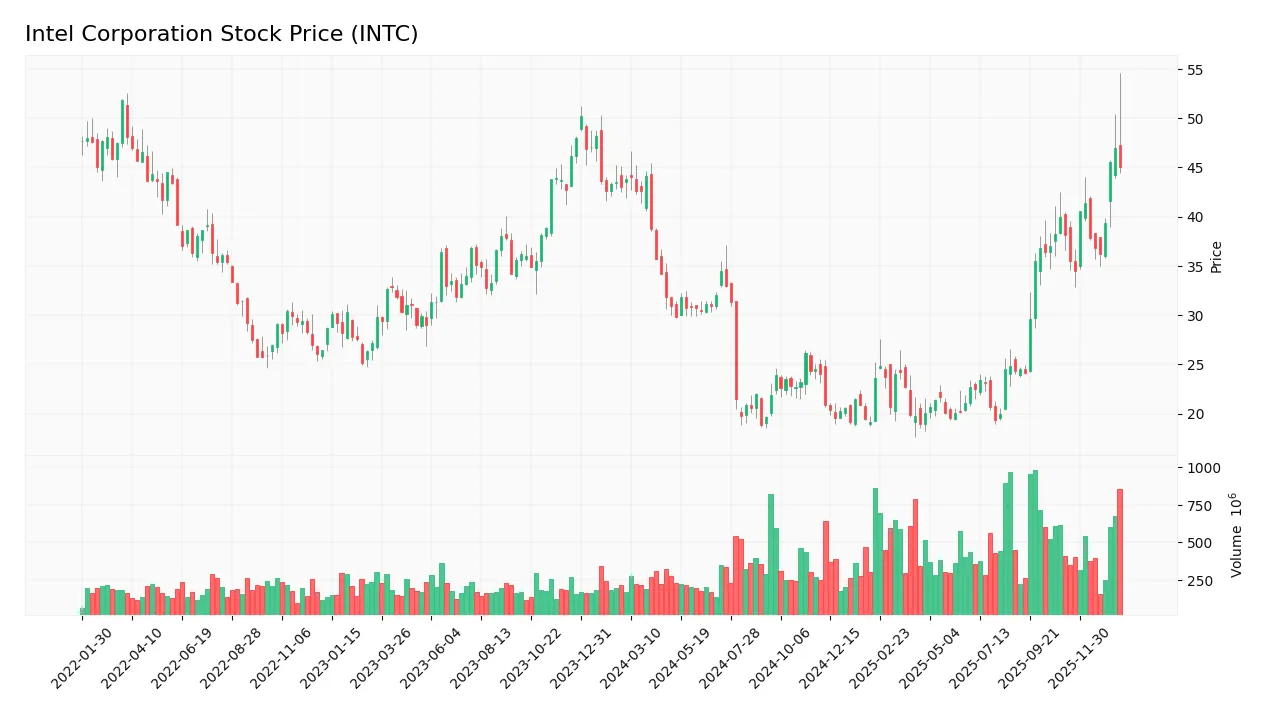
Trend Analysis
Over the past 12 months, Intel’s stock price increased by 2.85%, indicating a bullish trend with acceleration. The price ranged between a low of 18.89 and a high of 46.96, with a relatively high volatility reflected in an 8.06 standard deviation. Recent weeks show a stronger 18.2% rise since November 2025.
Volume Analysis
Trading volumes over the last three months reveal an increasing trend with total activity dominated slightly by sellers, who accounted for 55.27%. This seller dominance suggests cautious investor sentiment despite rising volumes, potentially indicating profit-taking or cautious positioning ahead of further price moves.
Target Prices
Intel Corporation’s target price consensus reflects moderate upside potential with a balanced range.
| Target High | Target Low | Consensus |
|---|---|---|
| 65 | 20 | 46.55 |
Analysts expect Intel’s stock to trade within a broad range, with a consensus price near 46.55, indicating cautious optimism amid market uncertainties.

Don’t Let Luck Decide Your Entry Point
Optimize your entry points with our advanced ProRealTime indicators. You’ll get efficient buy signals with precise price targets for maximum performance. Start outperforming now!
Analyst & Consumer Opinions
This section examines recent grades and consumer feedback concerning Intel Corporation to provide insight into market perceptions.
Stock Grades
The latest Intel Corporation grades from recognized firms reflect a consistent stance across the board:
| Grading Company | Action | New Grade | Date |
|---|---|---|---|
| Needham | Maintain | Hold | 2026-01-23 |
| UBS | Maintain | Neutral | 2026-01-23 |
| Evercore ISI Group | Maintain | In Line | 2026-01-23 |
| Roth Capital | Maintain | Neutral | 2026-01-23 |
| RBC Capital | Maintain | Sector Perform | 2026-01-23 |
| Morgan Stanley | Maintain | Equal Weight | 2026-01-23 |
| Rosenblatt | Maintain | Sell | 2026-01-23 |
| Keybanc | Maintain | Overweight | 2026-01-23 |
| Wedbush | Maintain | Neutral | 2026-01-23 |
| Stifel | Maintain | Hold | 2026-01-23 |
Overall, the grades show a prevailing hold or neutral sentiment with few deviations, indicating cautious optimism and a balanced risk view among analysts.
Consumer Opinions
Intel Corporation continues to attract a diverse range of consumer feedback, reflecting its strong market presence and areas for improvement.
| Positive Reviews | Negative Reviews |
|---|---|
| “Intel processors deliver reliable performance and excellent multitasking capabilities.” | “Some recent chipsets have faced overheating issues under heavy loads.” |
| “Great compatibility with various software and hardware setups.” | “Pricing is higher compared to competitors offering similar specs.” |
| “Consistent innovation keeps Intel products at the forefront of technology.” | “Customer service response times could be improved.” |
Overall, consumers praise Intel for its innovation and reliable performance, but recurring concerns include overheating in certain models and relatively high pricing, which investors should consider when evaluating product reception.
Risk Analysis
Below is a table summarizing the key risks associated with Intel Corporation’s current financial and market situation:
| Category | Description | Probability | Impact |
|---|---|---|---|
| Financial Health | Negative net margin (-0.51%) and ROE (-0.23%) indicate profitability challenges. | High | High |
| Market Volatility | High beta (1.354) suggests stock price is sensitive to market swings, increasing volatility. | High | Medium |
| Debt and Liquidity | Moderate debt-to-equity (0.41) and good current ratio (2.02) mitigate liquidity risks. | Medium | Low |
| Valuation Risk | Extremely negative P/E ratio (-658) reflects earnings instability and valuation uncertainty. | High | High |
| Operational Risk | Low asset turnover (0.25) and fixed asset turnover (0.5) indicate inefficiencies in asset use. | Medium | Medium |
| Dividend Policy | Zero dividend yield may reduce attractiveness to income-focused investors. | Low | Low |
| Bankruptcy Risk | Altman Z-Score in grey zone (2.62) suggests moderate risk of financial distress. | Medium | High |
The most significant risks for Intel stem from its profitability issues and valuation concerns, with a sizable recent price drop (-17%) reflecting investor wariness. The grey zone Altman Z-Score and average Piotroski Score reinforce caution, indicating moderate financial stress but not immediate distress. Market volatility remains elevated given the tech sector dynamics and Intel’s beta above 1.3. Overall, risk management should focus on monitoring operational improvements and market conditions closely.
Should You Buy Intel Corporation?
Intel Corporation appears to be navigating a challenging phase with declining profitability and a deteriorating competitive moat, suggesting value destruction. Despite a manageable debt profile, the overall rating stands at C, reflecting moderate financial health and operational risks.
Strength & Efficiency Pillars
Intel Corporation exhibits moderate financial resilience as reflected in its Altman Z-Score of 2.62, placing it in the grey zone, which indicates some risk but not immediate distress. The Piotroski Score of 4 suggests average financial strength. Liquidity is a notable positive, with a current ratio of 2.02 and a debt-to-equity ratio of 0.41, supporting stable operations. However, profitability metrics remain weak, with a negative net margin of -0.51% and a return on equity (ROE) of -0.23%. The return on invested capital (ROIC) stands at -0.02%, below the weighted average cost of capital (WACC) of 8.96%, marking Intel as a value destroyer rather than a creator.
Weaknesses and Drawbacks
Intel faces significant challenges, particularly in profitability and growth. The company’s negative net margin and ROE highlight operational inefficiencies and profitability pressures. The price-to-earnings (P/E) ratio is negative at -658.38, which, while technically favorable in score, reflects underlying earnings losses and investor uncertainty. Additionally, recent revenue trends are unfavorable, with a 0.47% decline in one-year revenue growth and a longer-term drop of 33.12%. Market dynamics show a slightly seller-dominant behavior in the recent period (buyer dominance at 44.73%), indicating short-term pressure on the stock despite an overall bullish trend. Asset turnover ratios also signal inefficiency, with values of 0.25 and 0.5 for total and fixed assets, respectively.
Our Verdict about Intel Corporation
Intel’s long-term fundamental profile appears unfavorable due to persistent profitability setbacks and value destruction as evidenced by its ROIC below WACC and weak earnings metrics. Despite an overall bullish stock trend and recent price acceleration, the slight seller dominance in recent volume dynamics suggests caution. Investors might consider a wait-and-see approach for a better entry point, as the company’s operational turnaround and growth sustainability remain uncertain in the near term.
Disclaimer: This content is for informational purposes only and does not constitute financial, investment, or other professional advice. Investing in financial markets involves a significant risk of loss, and past performance is not indicative of future results.
Additional Resources
- INTC stock is plunging today despite Intel earnings that beat Wall Street expectations. Here are 2 reasons why – Fast Company (Jan 23, 2026)
- Intel Has A New Problem (NASDAQ:INTC) – Seeking Alpha (Jan 21, 2026)
- Intel stock plunges as hopes for a ‘clean’ turnaround story meet reality – Yahoo Finance (Jan 24, 2026)
- Intel slumps as weak Q1 guidance weighs on shares (INTC:NASDAQ) – Seeking Alpha (Jan 22, 2026)
- Intel Corporation (NASDAQ:INTC) Q4 2025 Earnings Call Transcript – Insider Monkey (Jan 24, 2026)
For more information about Intel Corporation, please visit the official website: intel.com