Home > Analyses > Industrials > Ingersoll Rand Inc.
Ingersoll Rand shapes the backbone of industrial efficiency worldwide through its innovative air and fluid technologies. The company dominates critical markets with flagship products spanning air compressors, pumps, and precision fluid management systems. Renowned for engineering excellence and robust aftermarket services, it supports vital sectors from healthcare to manufacturing. As 2026 unfolds, investors must ask: does Ingersoll Rand’s solid industrial moat and technological prowess still warrant its premium valuation and growth expectations?
Table of contents
Business Model & Company Overview
Ingersoll Rand Inc., founded in 1859 and headquartered in Davidson, NC, stands as a dominant force in industrial machinery. It delivers a cohesive ecosystem of air, fluid, energy, specialty vehicle, and medical technologies. The company operates through two main segments—Industrial Technologies and Services, and Precision and Science Technologies—serving critical sectors from manufacturing to healthcare.
Its revenue engine balances durable hardware with specialized fluid management systems and aftermarket services. Ingersoll Rand leverages a global footprint spanning the Americas, Europe, the Middle East, Africa, and Asia Pacific. This diversified presence, combined with integrated sales channels and strong brand portfolio, fuels a robust economic moat in mission-critical industrial solutions.
Financial Performance & Fundamental Metrics
I analyze Ingersoll Rand Inc.’s income statement, key financial ratios, and dividend payout policy to assess its core financial health and shareholder value creation.
Income Statement
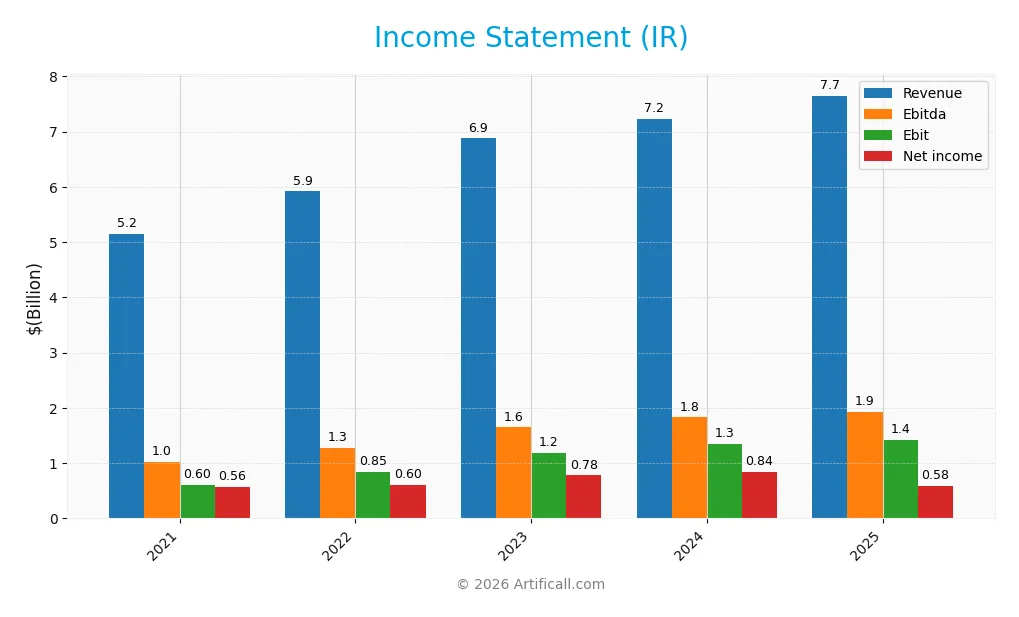
The table below summarizes Ingersoll Rand Inc.’s key income statement figures for fiscal years 2021 through 2025, reflecting revenue, expenses, profits, and earnings per share.
| 2021 | 2022 | 2023 | 2024 | 2025 | |
|---|---|---|---|---|---|
| Revenue | 5.15B | 5.92B | 6.88B | 7.24B | 7.65B |
| Cost of Revenue | 3.16B | 3.59B | 3.99B | 4.07B | 4.70B |
| Operating Expenses | 1.42B | 1.51B | 1.72B | 1.87B | 1.53B |
| Gross Profit | 1.99B | 2.33B | 2.88B | 3.17B | 2.95B |
| EBITDA | 1.02B | 1.28B | 1.65B | 1.83B | 1.92B |
| EBIT | 601M | 845M | 1.19B | 1.35B | 1.42B |
| Interest Expense | 88M | 103M | 157M | 213M | 254M |
| Net Income | 563M | 605M | 779M | 839M | 581M |
| EPS | 1.36 | 1.50 | 1.92 | 2.08 | 1.46 |
| Filing Date | 2022-02-25 | 2023-02-21 | 2024-02-23 | 2025-02-19 | 2026-02-17 |
Income Statement Evolution
From 2021 to 2025, Ingersoll Rand’s revenue increased by 48.5%, signaling robust top-line growth. However, net income rose only 3.4%, reflecting margin pressure. Gross profit contracted by 7% in the last year despite a 5.8% revenue increase. EBIT and net margins stood at 18.5% and 7.6%, respectively, though net margin declined notably over the period.
Is the Income Statement Favorable?
The 2025 income statement shows mixed signals. Revenue growth remained steady at 5.75%, and operating expenses grew proportionally, supporting an EBIT rise of 5.35%. Yet, net income and EPS fell sharply, driven by a 34% net margin drop. Interest expense remains manageable at 3.3% of revenue. Overall, fundamentals are broadly favorable but flagged by margin compression and declining bottom-line profitability.
Financial Ratios
The following table summarizes key financial ratios for Ingersoll Rand Inc. over the past five fiscal years, providing insight into profitability, valuation, liquidity, leverage, efficiency, and dividend metrics:
| Ratios | 2021 | 2022 | 2023 | 2024 | 2025 |
|---|---|---|---|---|---|
| Net Margin | 11.0% | 10.2% | 11.3% | 11.6% | 7.6% |
| ROE | 6.2% | 6.6% | 7.9% | 8.2% | 5.8% |
| ROIC | 4.1% | 5.0% | 6.5% | 6.1% | 6.4% |
| P/E | 45.6 | 35.0 | 40.2 | 43.5 | 54.2 |
| P/B | 2.85 | 2.30 | 3.20 | 3.58 | 3.13 |
| Current Ratio | 2.80 | 2.37 | 2.22 | 2.29 | 2.06 |
| Quick Ratio | 2.22 | 1.76 | 1.67 | 1.71 | 1.49 |
| D/E | 0.39 | 0.30 | 0.28 | 0.49 | 0.47 |
| Debt-to-Assets | 22.9% | 18.9% | 17.8% | 27.7% | 26.1% |
| Interest Coverage | 6.45 | 7.92 | 7.43 | 6.10 | 5.58 |
| Asset Turnover | 0.34 | 0.40 | 0.44 | 0.40 | 0.42 |
| Fixed Asset Turnover | 7.94 | 9.48 | 9.67 | 8.59 | 8.22 |
| Dividend Yield | 0.03% | 0.15% | 0.10% | 0.09% | 0.10% |
Evolution of Financial Ratios
From 2021 to 2025, Ingersoll Rand’s Return on Equity (ROE) showed a declining trend, slipping from 6.25% to 5.76%. The Current Ratio decreased steadily, indicating reduced liquidity but remained above 2. The Debt-to-Equity Ratio rose from 0.39 to 0.47, reflecting moderate leverage growth. Profitability margins fluctuated, with net margin falling to around 7.6% in 2025.
Are the Financial Ratios Fovorable?
In 2025, profitability ratios such as ROE and net margin were neutral to unfavorable, with ROE below sector benchmarks, signaling weaker returns for equity holders. Liquidity ratios, including Current and Quick Ratios, remained favorable above 1.4, ensuring short-term obligations coverage. Leverage measures like Debt-to-Equity and debt-to-assets were favorable, reflecting prudent capital structure. However, efficiency metrics like asset turnover were unfavorable, and valuation multiples (P/E and P/B) appeared stretched. Overall, the ratios present a slightly favorable financial profile tempered by some cautionary signals.
Shareholder Return Policy
Ingersoll Rand maintains a modest dividend payout ratio near 5.5%, with a stable dividend per share around $0.08 over recent years. The annual dividend yield hovers around 0.1%, supported comfortably by free cash flow, indicating prudent capital allocation without excessive distribution risks.
The company also engages in share buybacks, reinforcing shareholder returns alongside dividends. This balanced approach aligns with sustainable long-term value creation, preserving financial flexibility while providing steady income to investors.
Score analysis
The following radar chart displays the company’s key financial metric scores for a comprehensive overview:
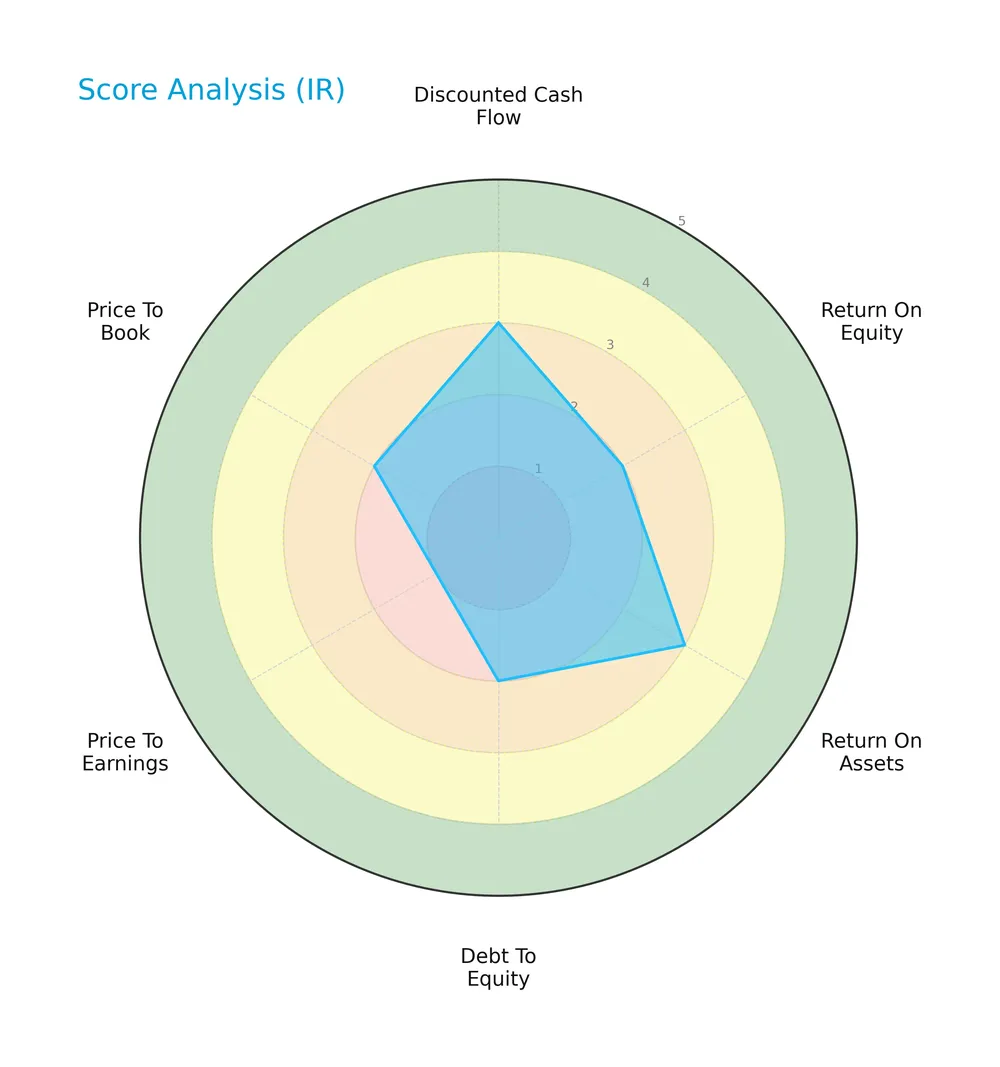
Ingersoll Rand shows moderate strength in discounted cash flow and return on assets. However, return on equity, debt to equity, and price to book ratios register unfavorable scores. The price to earnings score is very unfavorable, dragging the overall score down.
Analysis of the company’s bankruptcy risk
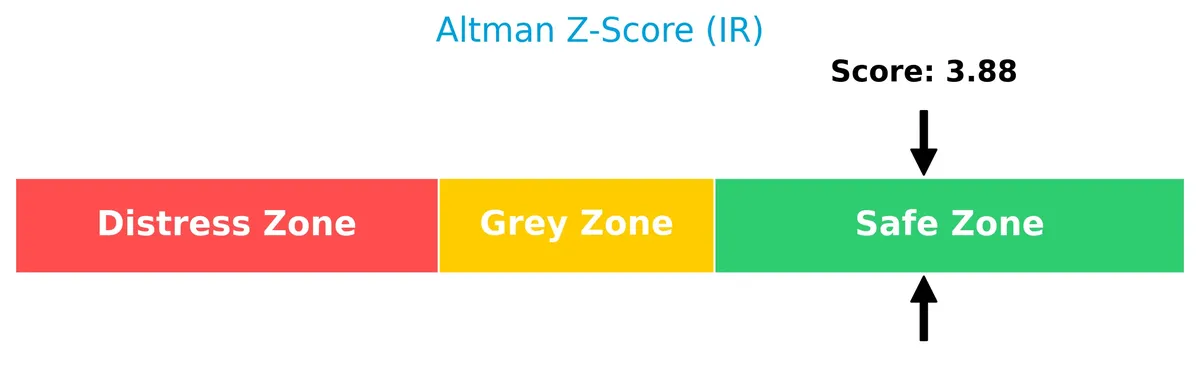
The Altman Z-Score places Ingersoll Rand well within the safe zone, indicating a low risk of bankruptcy:
Is the company in good financial health?
This Piotroski diagram illustrates the company’s financial strength based on nine specific criteria:
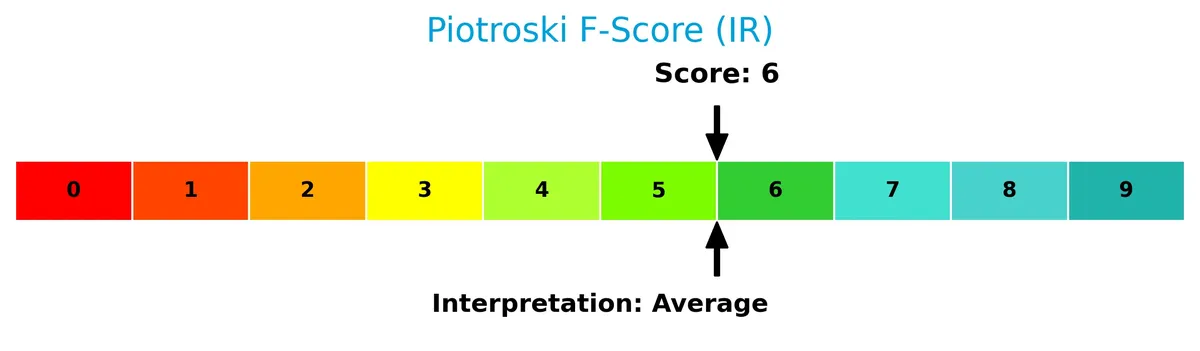
With a Piotroski Score of 6, Ingersoll Rand is in average financial health. The score suggests moderate financial robustness but leaves room for improvement in profitability and efficiency.
Competitive Landscape & Sector Positioning
This analysis explores Ingersoll Rand Inc.’s strategic positioning, revenue streams, and product offerings within the industrial machinery sector. We will examine its key competitors and assess the firm’s competitive advantages. I aim to determine whether Ingersoll Rand holds a sustainable edge over its industry rivals.
Strategic Positioning
Ingersoll Rand maintains a diversified product portfolio across Industrial Technologies and Precision Science segments, generating $7.65B in 2025. Geographically, it balances exposure with $3.8B in Americas, $2.6B in EMEA, and $1.25B in Asia Pacific, reflecting broad global reach.
Revenue by Segment
The pie chart illustrates Ingersoll Rand Inc.’s revenue breakdown by segment for the fiscal year 2025, highlighting the contributions of its main business units.
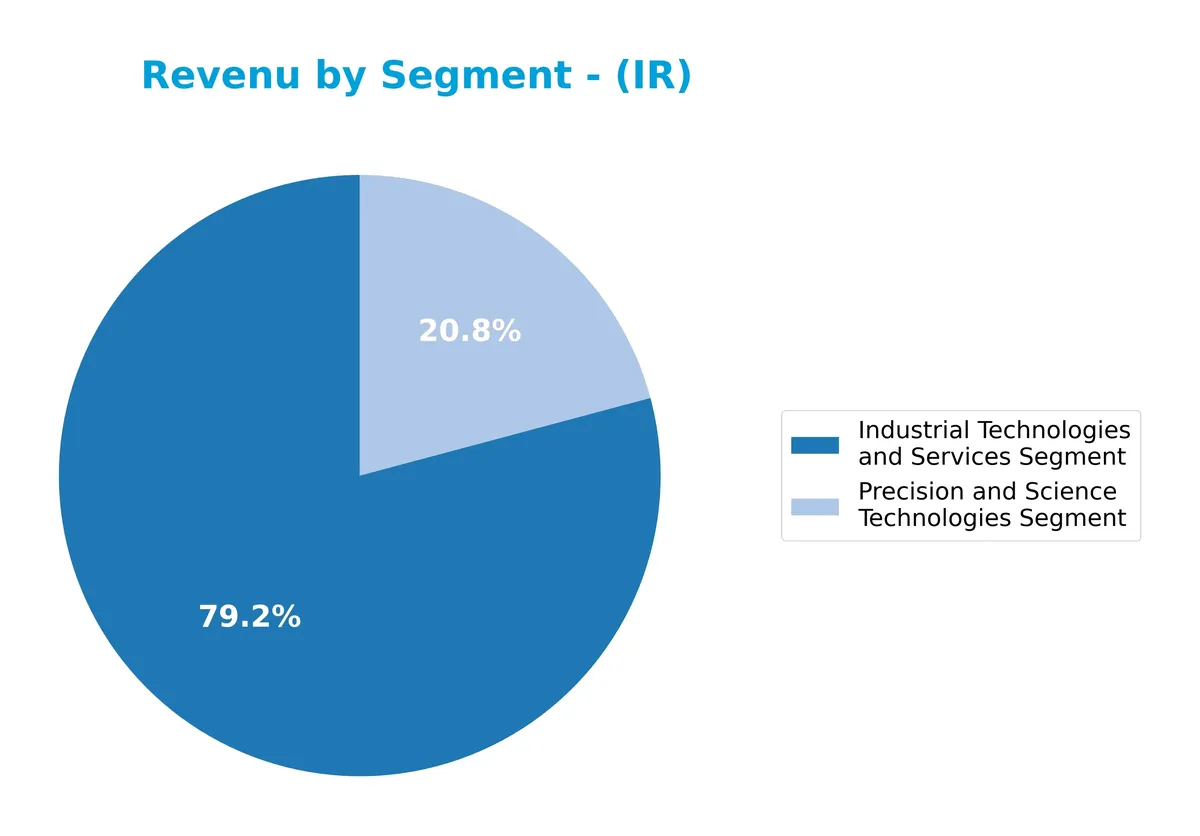
Industrial Technologies and Services dominates with $6.1B in revenue, reflecting steady growth over five years. Precision and Science Technologies contributes $1.6B, also expanding consistently. The 2025 data reveal accelerating momentum, particularly in Industrial Technologies, which drives the business. This concentration underscores a strong industrial focus but signals potential exposure to sector-specific cycles.
Key Products & Brands
The following table outlines Ingersoll Rand Inc.’s main products and brands by segment and specialization:
| Product | Description |
|---|---|
| Industrial Technologies and Services | Designs, manufactures, markets, and services air and gas compression, vacuum, blower products, fluid transfer and loading systems, power tools, lifting equipment, and related accessories and services. |
| Precision and Science Technologies | Produces specialized positive displacement pumps, fluid management systems, and accessories for dosing, transfer, dispensing, compression, sampling, pressure management, and flow control in critical applications. |
| Aftermarket Parts and Consumables | Supplies replacement parts and consumables for air treatment equipment, pumps, and related machinery across sectors. |
| Ingersoll Rand Brand Portfolio | Includes Gardner Denver, Club Car, CompAir, Nash, Elmo Rietschle, Robuschi, Thomas, Milton Roy, Seepex, ARO, Emco Wheaton, Runtech Systems, Air Dimensions, Albin, Dosatron, Haskel, LMI, Maximus, MP, Oberdorfer, Welch, Williams, Zinnser Analytic, and YZ. |
Ingersoll Rand’s products serve diverse sectors including industrial manufacturing, medical, chemical processing, agriculture, and energy. Its broad brand portfolio supports critical air, fluid, and specialty technologies globally.
Main Competitors
There are 24 competitors in the Industrials sector, with the table listing the top 10 leaders by market capitalization:
| Competitor | Market Cap. |
|---|---|
| Eaton Corporation plc | 127B |
| Parker-Hannifin Corporation | 114B |
| Howmet Aerospace Inc. | 85B |
| Emerson Electric Co. | 76B |
| Illinois Tool Works Inc. | 73B |
| Cummins Inc. | 72B |
| AMETEK, Inc. | 48B |
| Roper Technologies, Inc. | 47B |
| Rockwell Automation, Inc. | 45B |
| Symbotic Inc. | 36B |
Ingersoll Rand Inc. ranks 13th among 24 competitors. Its market cap is about 31% of the sector leader Eaton Corporation plc. The company stands below the average market cap of the top 10 competitors (72B) but above the sector median (32B). It maintains a 14.45% gap to the next competitor above, indicating a moderate distance to climb within the sector hierarchy.
Comparisons with competitors
Check out how we compare the company to its competitors:
Does IR have a competitive advantage?
Ingersoll Rand currently lacks a strong competitive advantage, as its ROIC falls 2.8% below its WACC, indicating value destruction despite improving profitability. The company operates in industrial machinery with a diverse product portfolio and global reach.
Looking ahead, Ingersoll Rand targets growth through expanding its precision and science technologies segment and entering new geographic markets like Asia Pacific and EMEA. These efforts aim to leverage innovation and aftermarket services to enhance future opportunities.
SWOT Analysis
This SWOT analysis highlights Ingersoll Rand Inc.’s key strategic factors affecting its competitive position and future growth potential.
Strengths
- strong global footprint with diverse geographic revenues
- solid liquidity ratios (current ratio 2.06, quick ratio 1.49)
- growing operating profit margin (18.53%)
Weaknesses
- ROIC below WACC indicating value destruction
- weak return on equity (5.76%)
- high valuation multiples (PE 54.24, PB 3.13)
Opportunities
- expanding industrial and precision technology markets
- potential to improve capital efficiency and ROIC
- innovation in energy and fluid management technologies
Threats
- margin pressure evidenced by declining gross profit growth
- exposure to cyclical industrial demand
- competitive pressure in machinery and specialty tech sectors
Ingersoll Rand’s solid liquidity and margin profile provide a stable base, but its value destruction warns of inefficient capital use. The company must leverage its technological edge and market diversity to improve returns and counter margin pressures.
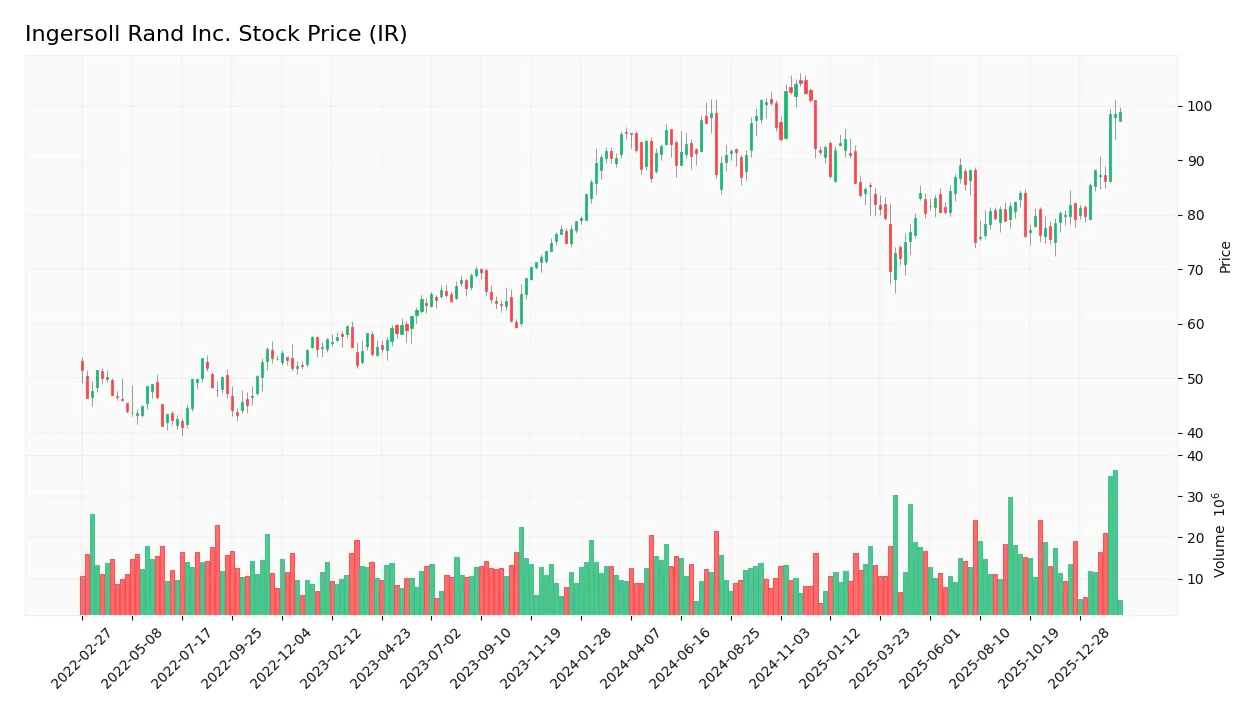
Stock Price Action Analysis
The weekly stock chart for Ingersoll Rand Inc. highlights price movements and key levels over the last 100 weeks:
Trend Analysis
Over the past 12 months, the stock price increased by 4.01%, indicating a bullish trend. The trend shows acceleration with notable volatility, as the standard deviation stands at 8.23. The price ranged between 69.7 and 104.17, reflecting strong upward momentum.
Volume Analysis
Trading volume has increased recently, with a total of 1.6B shares traded. Buyers dominate 62.1% of the volume, signaling strong demand. This buyer-driven activity suggests growing investor confidence and robust market participation in the stock.
Target Prices
The consensus target price for Ingersoll Rand Inc. reflects moderate optimism among analysts.
| Target Low | Target High | Consensus |
|---|---|---|
| 87 | 115 | 105.75 |
Analysts expect the stock to appreciate, with a target consensus suggesting potential upside from current levels.

Don’t Let Luck Decide Your Entry Point
Optimize your entry points with our advanced ProRealTime indicators. You’ll get efficient buy signals with precise price targets for maximum performance. Start outperforming now!
Analyst & Consumer Opinions
This section reviews recent analyst grades and consumer feedback to provide a balanced perspective on Ingersoll Rand Inc.
Stock Grades
Here is the latest grade summary from recognized financial institutions for Ingersoll Rand Inc.:
| Grading Company | Action | New Grade | Date |
|---|---|---|---|
| Stifel | Maintain | Hold | 2026-01-23 |
| Citigroup | Maintain | Buy | 2026-01-12 |
| Wells Fargo | Maintain | Overweight | 2026-01-07 |
| Stifel | Maintain | Hold | 2025-12-16 |
| Citigroup | Maintain | Buy | 2025-12-08 |
| Citigroup | Maintain | Buy | 2025-11-03 |
| Baird | Maintain | Outperform | 2025-11-03 |
| Stifel | Maintain | Hold | 2025-10-20 |
| Wells Fargo | Maintain | Overweight | 2025-10-06 |
| Morgan Stanley | Maintain | Equal Weight | 2025-08-13 |
Grades show consistent support, with a consensus leaning toward Buy. Most firms maintain positive or neutral stances, reflecting steady confidence without recent upgrades or downgrades.
Consumer Opinions
Consumer sentiment about Ingersoll Rand Inc. reflects a blend of appreciation for product reliability and concerns over service responsiveness.
| Positive Reviews | Negative Reviews |
|---|---|
| Durable and high-quality industrial tools. | Customer service can be slow to respond. |
| Excellent performance under heavy use. | Some products have higher upfront costs. |
| Strong innovation in energy-efficient solutions. | Occasional delays in product delivery. |
Overall, consumers praise Ingersoll Rand for robust, reliable equipment that excels in demanding environments. However, recurring complaints about service speed and pricing suggest areas for operational improvement.
Risk Analysis
Below is a detailed table of key risks facing Ingersoll Rand Inc., including their likelihood and potential impact:
| Category | Description | Probability | Impact |
|---|---|---|---|
| Valuation Risk | Elevated P/E of 54.24 signals potential overvaluation compared to Industrials sector norms. | High | High |
| Profitability | ROE at 5.76% trails WACC of 9.21%, indicating weak capital efficiency and value destruction. | Medium | Medium |
| Market Volatility | Beta of 1.31 suggests heightened sensitivity to market swings, increasing share price risk. | High | Medium |
| Operational Risk | Asset turnover at 0.42 is low, implying inefficient use of assets to generate revenue. | Medium | Medium |
| Dividend Risk | Dividend yield at 0.1% is minimal, possibly deterring income-focused investors. | Low | Low |
| Leverage Risk | Debt-to-equity ratio of 0.47 is moderate, but interest coverage of 5.58 provides comfort. | Low | Low |
Valuation risk stands out as the most critical concern. The company trades at a premium relative to sector peers, raising caution amid modest profitability. However, solid liquidity and a safe Altman Z-Score of 3.88 mitigate bankruptcy fears. Investors must weigh growth prospects against stretched multiples and operational inefficiencies.
Should You Buy Ingersoll Rand Inc.?
Ingersoll Rand appears to have improving profitability and a slightly unfavorable moat, as it currently sheds value despite growing ROIC. Its leverage profile seems manageable, supported by a safe-zone Altman Z-score, while the overall rating of C+ suggests a cautious investment case.
Strength & Efficiency Pillars
Ingersoll Rand Inc. shows solid operational efficiency with a gross margin of 38.54% and an EBIT margin of 18.53%. The net margin stands at a modest 7.6%, reflecting reasonable profitability. The return on invested capital (ROIC) is 6.36%, though it trails the weighted average cost of capital (WACC) at 9.21%, signaling that the company is currently destroying value despite improving profitability trends. Return on equity (ROE) is low at 5.76%, indicating limited shareholder returns relative to equity employed.
Weaknesses and Drawbacks
The Altman Z-Score of 3.88 places Ingersoll Rand in the safe zone, dismissing immediate bankruptcy risk. However, the valuation metrics raise concerns: a high P/E of 54.24 and a P/B ratio of 3.13 suggest the stock is priced at a premium, potentially limiting upside. Asset turnover is weak at 0.42, implying inefficient use of assets. While leverage metrics are favorable with a debt-to-equity ratio of 0.47 and current ratio of 2.06, the very low dividend yield of 0.1% may deter income-focused investors.
Our Final Verdict about Ingersoll Rand Inc.
Ingersoll Rand presents a slightly favorable but cautious fundamental profile. Despite a bullish stock trend and increasing buyer dominance at 62.23%, the company’s value destruction (ROIC below WACC) tempers enthusiasm. The high valuation multiples and modest profitability suggest the stock might appear attractive for patient investors but warrants a wait-and-see approach for a better entry point.
Disclaimer: This content is for informational purposes only and does not constitute financial, investment, or other professional advice. Investing in financial markets involves a significant risk of loss, and past performance is not indicative of future results.
Additional Resources
- Ingersoll Rand Inc. (IR) Shares Surge Following Earnings Beat and Improved 2026 Guidance – AlphaStreet News (Feb 14, 2026)
- Ingersoll Rand Q4 Review: Strong Pipeline, But Strategy Is Not Appealing For Now (NYSE:IR) – Seeking Alpha (Feb 17, 2026)
- Is Ingersoll Rand Inc.’s (NYSE:IR) Recent Stock Performance Influenced By Its Fundamentals In Any Way? – Yahoo Finance (Feb 13, 2026)
- Glenview Trust Co Boosts Position in Ingersoll Rand Inc. $IR – MarketBeat (Feb 17, 2026)
- Ingersoll Rand Inc. SEC 10-K Report – TradingView (Feb 17, 2026)
For more information about Ingersoll Rand Inc., please visit the official website: irco.com