Informatica Inc. revolutionizes how enterprises harness the power of their data, seamlessly connecting and unifying information across complex multi-cloud and hybrid environments. As an industry leader in software infrastructure, Informatica’s AI-driven platform delivers cutting-edge data integration, quality, and governance solutions that empower businesses to make smarter, faster decisions. Renowned for its innovation and comprehensive product suite, the company’s future growth hinges on whether it can sustain its market influence amid evolving technology demands.

Table of contents
Company Description
Informatica Inc., founded in 1993 and headquartered in Redwood City, California, is a leading player in the software infrastructure industry. The company specializes in an AI-powered platform that unifies and manages data across multi-cloud and hybrid environments at enterprise scale. Its comprehensive suite includes data integration, API management, data quality, master data management, and governance products, complemented by professional services. Operating primarily in the United States, Informatica balances software innovation with service offerings. Its strategic strength lies in enabling businesses to harness accurate, governed data, positioning the company at the forefront of data management and digital transformation.
Fundamental Analysis
This section provides a detailed examination of Informatica Inc.’s income statement, key financial ratios, and dividend payout policy to support informed investment decisions.
Income Statement
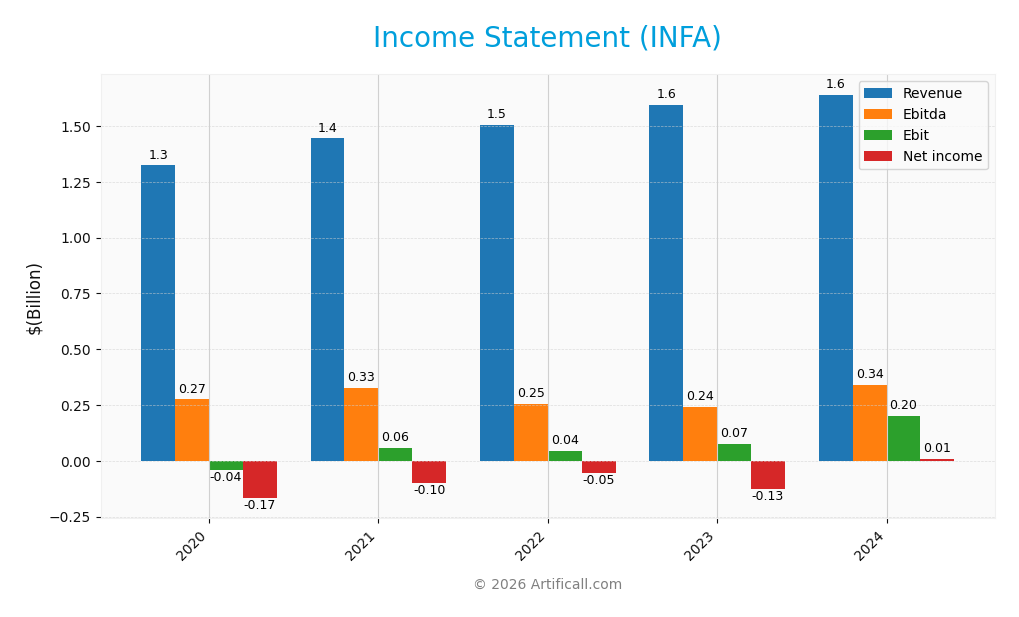
The table below summarizes Informatica Inc.’s key income statement figures over the last five fiscal years, showing its revenue, expenses, profits, earnings per share, and filing dates.
| 2020 | 2021 | 2022 | 2023 | 2024 | |
|---|---|---|---|---|---|
| Revenue | 1.32B | 1.44B | 1.51B | 1.60B | 1.64B |
| Cost of Revenue | 318M | 332M | 344M | 338M | 326M |
| Operating Expenses | 984M | 1.05B | 1.14B | 1.22B | 1.19B |
| Gross Profit | 1.01B | 1.11B | 1.16B | 1.26B | 1.31B |
| EBITDA | 274M | 327M | 254M | 241M | 339M |
| EBIT | -40.8M | 56.5M | 43.8M | 74.2M | 199M |
| Interest Expense | 149M | 132M | 78M | 151M | 146M |
| Net Income | -168M | -100M | -53.7M | -125M | 9.93M |
| EPS | -0.60 | -0.36 | -0.19 | -0.43 | 0.033 |
| Filing Date | 2020-12-31 | 2022-03-24 | 2023-02-27 | 2024-02-22 | 2025-02-25 |
Income Statement Evolution
Informatica Inc. recorded a steady revenue growth of 23.95% over 2020-2024, with a slight 2.81% increase from 2023 to 2024, indicating some slowing. Gross margins remained favorable at 80.11%, supported by a 4.53% gross profit growth in the last year. EBIT margin improved notably to 12.15%, reflecting enhanced operational efficiency, while net margin growth was positive but moderate.
Is the Income Statement Favorable?
The 2024 income statement shows generally favorable fundamentals despite a modest net margin of 0.61%. EBIT surged 168.42% year-over-year, signaling significant operational improvements. Operating expenses grew in line with revenue at 2.81%, which is favorable for cost control. Interest expenses remain neutral at 8.91% of revenue, and earnings per share more than doubled, confirming improved profitability dynamics. Overall, the income statement reflects positive momentum.
Financial Ratios
The table below presents key financial ratios for Informatica Inc. (INFA) over the fiscal years 2020 to 2024, reflecting profitability, valuation, liquidity, leverage, and efficiency metrics.
| Ratios | 2020 | 2021 | 2022 | 2023 | 2024 |
|---|---|---|---|---|---|
| Net Margin | -12.69% | -6.92% | -3.57% | -7.85% | 0.61% |
| ROE | -14.39% | -5.04% | -2.61% | -5.66% | 0.43% |
| ROIC | 0.43% | 1.47% | 0.63% | 0.80% | 0.56% |
| P/E | -48.03 | -102.97 | -85.32 | -65.39 | 787.95 |
| P/B | 6.91 | 5.19 | 2.23 | 3.70 | 3.39 |
| Current Ratio | 1.12 | 1.24 | 1.45 | 1.66 | 1.82 |
| Quick Ratio | 1.12 | 1.24 | 1.45 | 1.66 | 1.82 |
| D/E | 2.47 | 0.97 | 0.93 | 0.85 | 0.81 |
| Debt-to-Assets | 56.79% | 38.76% | 38.49% | 36.28% | 35.24% |
| Interest Coverage | 0.14 | 0.45 | 0.33 | 0.22 | 0.87 |
| Asset Turnover | 0.26 | 0.29 | 0.30 | 0.31 | 0.31 |
| Fixed Asset Turnover | 5.00 | 5.73 | 6.59 | 7.70 | 8.75 |
| Dividend Yield | 0% | 0% | 0.00052% | 0.00015% | 0.00015% |
Evolution of Financial Ratios
From 2020 to 2024, Informatica Inc.’s Return on Equity (ROE) showed a gradual improvement, moving from -14.4% in 2020 to a slightly positive 0.43% in 2024. The Current Ratio consistently improved over the period, rising from 1.12 to 1.82, indicating strengthened short-term liquidity. The Debt-to-Equity Ratio steadily decreased from 2.47 to 0.81, reflecting a reduction in leverage. Profitability margins notably improved in 2024, with net profit margin turning positive at 0.6%.
Are the Financial Ratios Favorable?
In 2024, profitability metrics such as net profit margin and ROE are marginally positive but remain low, signaling limited earnings generation. Liquidity ratios, including a current ratio of 1.82 and cash ratio of 0.84, suggest solid short-term financial health. Efficiency ratios like asset turnover remain stable around 0.31. Leverage ratios have moderated, with debt-to-equity at 0.81 and financial leverage at 2.29, indicating controlled debt levels. Market valuation ratios show elevated price-to-earnings at 788, implying high market expectations or low earnings, resulting in a generally neutral to cautious outlook on the financial ratios.
Shareholder Return Policy
Informatica Inc. pays a minimal dividend with a payout ratio near 0.12% and a negligible dividend yield under 0.0016%. The company appears to prioritize capital retention, supported by strong free cash flow coverage of dividends and capex. Share buybacks are not explicitly indicated.
This restrained distribution aligns with cautious capital management given low net profit margins around 0.6% in 2024. The minimal dividend and absence of aggressive buybacks suggest a focus on sustaining long-term shareholder value without risking unsustainable payouts or excessive leverage.
Sector Analysis
This sector analysis will examine Informatica Inc.’s strategic positioning, revenue by segment, key products, main competitors, and competitive advantages. I will also explore the company’s SWOT analysis to provide a comprehensive overview. The goal is to determine whether Informatica holds a competitive advantage over its industry peers.
Strategic Positioning
Informatica Inc. maintains a concentrated product portfolio focused on AI-powered data management platforms, primarily subscription-based, representing over $1.1B revenue in 2024. Geographically, it has a strong North American presence with $1.1B revenue, complemented by diversified exposure across EMEA, Asia Pacific, and Latin America.
Revenue by Segment
This pie chart illustrates Informatica Inc.’s revenue distribution by segment for the fiscal year 2024, highlighting key contributors to the company’s total income.
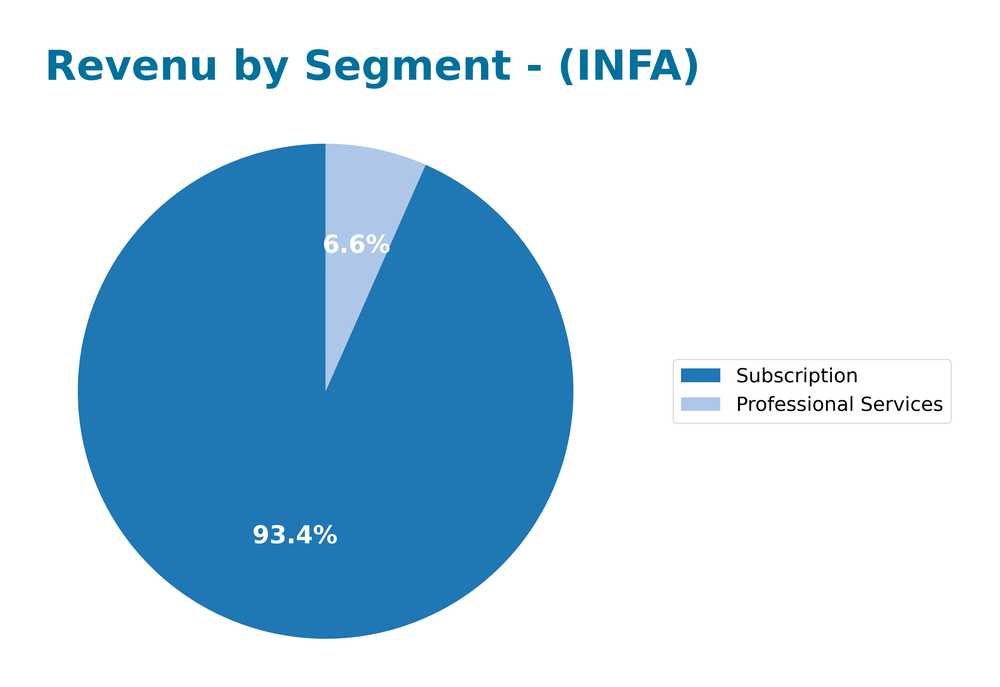
In 2024, Subscription revenue dominated at 1.1B, significantly surpassing Professional Services at 78M. Compared to prior years, Subscription shows continued growth and increasing importance, while traditional service segments have diminished or merged, reflecting a strategic shift towards recurring revenue models. This trend suggests a focus on subscription-based offerings with reduced reliance on license and maintenance revenues, indicating a more stable and predictable income stream moving forward.
Key Products & Brands
The table below summarizes Informatica Inc.’s key products and brand categories along with their descriptions:
| Product | Description |
|---|---|
| Data Integration Products | Tools to ingest, transform, and integrate data across multi-cloud and hybrid enterprise systems. |
| API and Application Integration | Products enabling API creation, management, app synchronization, business process orchestration, and B2B management. |
| Data Quality Products | Solutions to profile, cleanse, standardize, and enrich data to ensure accuracy and consistency. |
| Master Data Management | Products creating a single authoritative source of business-critical data to reduce errors and redundancies. |
| Customer and Business 360 | Tools to create, visualize, and browse comprehensive 360-degree views of business-critical data. |
| Data Catalog Products | Search-enabled products that help users quickly find, access, and understand enterprise data. |
| Governance and Privacy Products | Solutions to govern data, ensure regulatory compliance, and promote data consumption. |
| Professional Services | Services supporting implementation, maintenance, and expert consulting. |
| Subscription Services | Recurring revenue products providing cloud-based data management and integration solutions. |
Informatica’s offerings focus on AI-powered data management across cloud and hybrid environments, encompassing integration, quality, governance, and comprehensive data visibility, supported by professional and subscription services.
Main Competitors
Below is a table of the main competitors in the Software – Infrastructure industry by market capitalization:
| Competitor | Market Cap. |
|---|---|
| Confluent, Inc. | 10.6B |
| Klaviyo, Inc. | 9.8B |
| UiPath Inc. | 8.8B |
| Paylocity Holding Corporation | 8.5B |
| Dropbox, Inc. | 7.8B |
| The Descartes Systems Group Inc. | 7.5B |
| Informatica Inc. | 7.5B |
| Wix.com Ltd. | 5.8B |
| Bullish | 5.7B |
| Core Scientific, Inc. | 4.5B |
The largest competitors in this group include Confluent, Klaviyo, and UiPath, each with market caps above 8B. Informatica Inc., with a market cap of approximately 7.5B, holds a mid-tier position among these key players in the software infrastructure sector.
Does INFA have a competitive advantage?
Informatica Inc. holds competitive advantages through its AI-powered platform that unifies data across multi-cloud and hybrid systems, offering a comprehensive suite of interoperable data management products. Its strong gross margin of 80.11% and favorable EBIT margin of 12.15% reflect operational efficiency, supported by consistent growth in net income and EPS over the 2020-2024 period. The company’s footprint across North America, EMEA, Asia Pacific, and Latin America diversifies revenue streams, enhancing market resilience.
Looking ahead, Informatica aims to capitalize on opportunities in expanding cloud adoption and data governance regulations. Its ongoing development of new products targeting data quality, master data management, and privacy compliance positions it well to address evolving enterprise needs and regulatory environments, potentially sustaining its market relevance and growth trajectory.
SWOT Analysis
This SWOT analysis highlights Informatica Inc.’s key internal and external factors to guide strategic decision-making.
Strengths
- strong AI-powered data management platform
- high gross margin at 80.11%
- favorable EBIT and net margin growth over 2020-2024
Weaknesses
- modest net margin at 0.61% limits profitability
- reliance on North America for ~65% revenue
- Altman Z-Score under 2 indicates moderate financial distress risk
Opportunities
- expanding multi-cloud and hybrid data integration demand
- growing global data governance and privacy needs
- potential for geographic revenue diversification
Threats
- intense competition in software infrastructure
- rapid technological changes require continuous innovation
- regulatory risks and data privacy compliance costs
Overall, Informatica demonstrates robust platform strengths and favorable profitability trends, though current margins and geographic concentration pose risks. Strategic focus should balance innovation and diversification while managing financial and regulatory challenges.
Stock Analysis
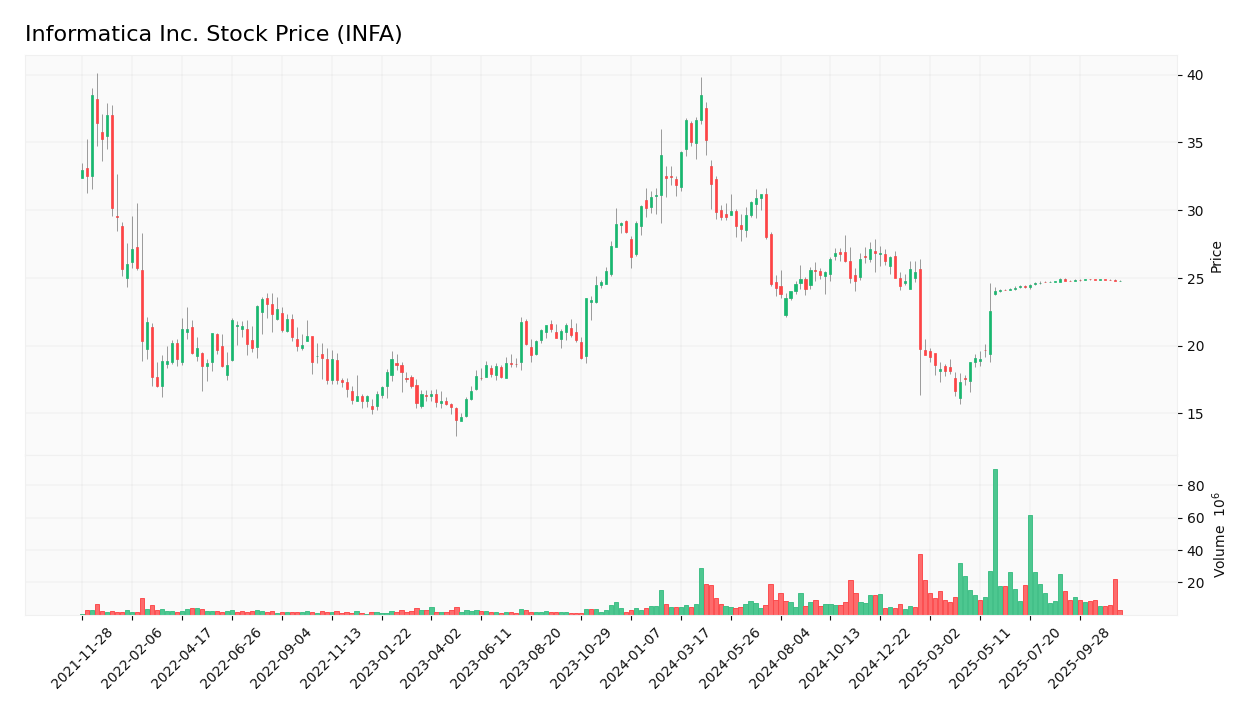
Over the past year, Informatica Inc. (INFA) experienced significant price fluctuations, marked by a 12.68% decline and accelerating bearish momentum, with notable volatility between $16.67 and $38.48.
Trend Analysis
INFA’s stock price declined by 12.68% over the past year, confirming a bearish trend with accelerating downward momentum. The standard deviation of 4.46 indicates moderate volatility. The stock reached a high of $38.48 and a low of $16.67, reflecting significant price swings and sustained negative pressure.
Volume Analysis
Trading volume is increasing overall, with a total of 1.25B shares traded this year, and buyers accounting for 58.6%. However, in the recent three-month period, seller volume dominates at 75M versus 24M buyer volume. This shift suggests growing seller pressure and cautious investor sentiment.
Target Prices
The consensus target price for Informatica Inc. (INFA) is clearly defined by analysts.
| Target High | Target Low | Consensus |
|---|---|---|
| 27 | 27 | 27 |
Analysts uniformly expect the stock to reach a price of 27, indicating a stable outlook with no significant variation in target estimates.
Analyst Opinions
Analysts remain cautiously optimistic on Informatica Inc. (INFA) in 2026. Morgan Stanley and JPMorgan recommend a buy, highlighting strong cloud integration growth and expanding AI-driven data management solutions. Conversely, Citi and Wells Fargo suggest holding positions, citing valuation concerns and increased competition. The consensus leans toward a buy, driven by robust revenue prospects and strategic partnerships, but investors should monitor execution risks closely.
Stock Grades
Here is a summary of the latest stock ratings from reputable analysts for Informatica Inc. (INFA).
| Grading Company | Action | New Grade | Date |
|---|---|---|---|
| Guggenheim | Downgrade | Neutral | 2025-08-07 |
| UBS | Maintain | Neutral | 2025-08-07 |
| Baird | Maintain | Neutral | 2025-05-28 |
| JP Morgan | Downgrade | Neutral | 2025-05-28 |
| RBC Capital | Maintain | Sector Perform | 2025-05-28 |
| Wolfe Research | Downgrade | Peer Perform | 2025-05-28 |
| Wells Fargo | Maintain | Equal Weight | 2025-05-28 |
| Truist Securities | Downgrade | Hold | 2025-05-28 |
| RBC Capital | Maintain | Sector Perform | 2025-05-27 |
| UBS | Maintain | Neutral | 2025-05-16 |
The overall trend shows a cautious stance with several downgrades from previously more optimistic ratings toward neutral or hold positions. Most analysts are maintaining a moderate outlook, signaling a need for investors to carefully evaluate risk before adding INFA to their portfolios.
Consumer Opinions
Consumer sentiment around Informatica Inc. (INFA) reveals a mix of appreciation for its technology and concerns about service aspects.
| Positive Reviews | Negative Reviews |
|---|---|
| Robust data integration tools that improve workflow efficiency. | Customer support response times can be slow. |
| User-friendly interface that simplifies complex data processes. | Pricing model is considered expensive by some users. |
| Strong security features ensuring data protection. | Occasional bugs reported in software updates. |
Overall, consumers praise Informatica’s powerful and secure data management solutions, though some express frustration with customer service delays and pricing, suggesting these are key areas for improvement.
Risk Analysis
The table below summarizes key risks associated with Informatica Inc. (INFA), focusing on their likelihood and potential impact on the company’s financial health and stock performance.
| Category | Description | Probability | Impact |
|---|---|---|---|
| Profitability Risk | Low net profit margin (~0.6% in 2024) and volatile historical profitability indicate ongoing challenges in achieving sustainable profits. | High | High |
| Debt and Leverage | Significant debt levels with debt-to-equity ratio around 0.81 and interest coverage ratio below 1 indicate financial leverage risk and vulnerability to interest rate changes. | High | High |
| Market Valuation | Extremely high Price-to-Earnings ratio (~788 in 2024) suggests overvaluation risk, which may lead to price corrections. | Medium | Medium |
| Operating Cash Flow | Operating cash flow coverage ratio is low (~0.22), signaling potential liquidity constraints for meeting debt obligations and operating expenses. | Medium | High |
| Competitive Market | Operating in the fast-evolving software infrastructure sector with intense competition could pressure margins and market share. | Medium | Medium |
Informatica’s most critical risks combine high leverage and low profitability, which elevate financial vulnerability. The company’s interest coverage ratio under 1 in recent years signals difficulty covering interest expenses, a red flag for investors. Additionally, the extremely high valuation multiples warrant caution, especially amid sector volatility. I advise careful risk management and monitoring of debt servicing capability before investing.
Should You Buy Informatica Inc.?
In 2024, Informatica Inc. reported a positive net profit margin of 0.61% and a ROIC of 0.56%, which is greater than its WACC, indicating value creation. The company has a moderate debt-to-equity ratio of 0.81 and a current ratio of 1.82, reflecting manageable leverage and liquidity. Its interest coverage ratio stands at 0.87, suggesting limited ability to cover interest expenses. The market cap is $7.83B with a price-to-earnings ratio of 788, implying high valuation. Overall, these metrics might indicate cautious optimism but also signal risks that could warrant careful analysis before investing.
Favorable signals
Informatica Inc. shows several favorable elements in its income statement evaluation. The company has a strong gross margin of 80.11% and a positive EBIT margin of 12.15%, both indicating efficient core operations. Additionally, the company experienced significant growth in EBIT by 168.42% and net margin by 107.71% over the past year. Over the overall period from 2020 to 2024, revenue grew by 23.95%, net income doubled with a growth of 105.92%, and earnings per share increased by 105.28%. These factors collectively suggest improving profitability and operational efficiency.
Unfavorable signals
Despite the positive income indicators, some unfavorable signals are present. The company’s revenue growth over the last year was only 2.81%, which is considered unfavorable and indicates a slowdown in top-line expansion. The stock has experienced a bearish long-term trend with a price decline of 12.68%. Moreover, recent trading shows a seller-dominant volume with sellers accounting for approximately 75M shares compared to buyers at 23.8M shares, indicating weak buying interest in the short term. These signals reflect challenges in market sentiment and growth momentum.
Conclusion
While Informatica Inc.’s income statement presents many favorable signs such as strong margins and significant growth in profitability measures, the bearish long-term stock trend and recent seller dominance might suggest caution. Given the overall favorable income statement evaluation but negative stock trend and volume dynamics, the stock could be interpreted as attractive for long-term investors but might require waiting for clearer buying interest to emerge.
Disclaimer: This article is not financial advice. Each investor is responsible for their own investment decisions.
Additional Resources
- Salesforce Acquires Informatica: A $25/Share AI Data Merger Explained (INFA) – tradingcalendar.com (Nov 18, 2025)
- Informatica Inc (INFA) Announces New Integrations With Oracle Cloud Infrastructure – Yahoo Finance (Oct 21, 2025)
- INFA INVESTIGATION ALERT: Investigation Launched into Informatica Inc., Attorneys Encourage Investors and Potential Witnesses to Contact Law Firm – PR Newswire (Sep 26, 2025)
- Join Our Data-Driven, Inclusive Culture – Informatica (Apr 19, 2025)
- Salesforce completes acquisition of Informatica, delists company from NYSE – Investing.com (Nov 18, 2025)
For more information about Informatica Inc., please visit the official website: informatica.com