Home > Analyses > Healthcare > IDEXX Laboratories, Inc.
IDEXX Laboratories transforms veterinary and environmental diagnostics, directly impacting animal health and public safety worldwide. The company leads with cutting-edge diagnostic instruments, rapid test kits, and veterinary software that empower clinics and research labs alike. Its reputation for innovation and quality sets a high industry standard. As healthcare technologies evolve rapidly, I ask whether IDEXX’s solid fundamentals still justify its premium valuation and growth prospects in 2026.
Table of contents
Business Model & Company Overview
IDEXX Laboratories, Inc., founded in 1983 and headquartered in Westbrook, Maine, commands a dominant position in the medical diagnostics sector. It integrates veterinary diagnostics, water testing, and biomedical research into a cohesive ecosystem serving companion animals, livestock, and human health markets. The company’s mission centers on advancing animal and environmental health through innovative diagnostic instruments, consumables, and software solutions.
IDEXX’s revenue engine balances recurring consumables, high-tech instruments, and software services. Its global footprint spans the Americas, Europe, and Asia, leveraging sales, marketing, and technical support networks alongside distributors. This blend ensures steady cash flow and customer retention. IDEXX’s economic moat lies in its integrated product suite and entrenched customer relationships, shaping the future of veterinary and environmental diagnostics.
Financial Performance & Fundamental Metrics
I analyze IDEXX Laboratories’ income statement, key financial ratios, and dividend payout policy to assess its operational efficiency and shareholder value creation.
Income Statement
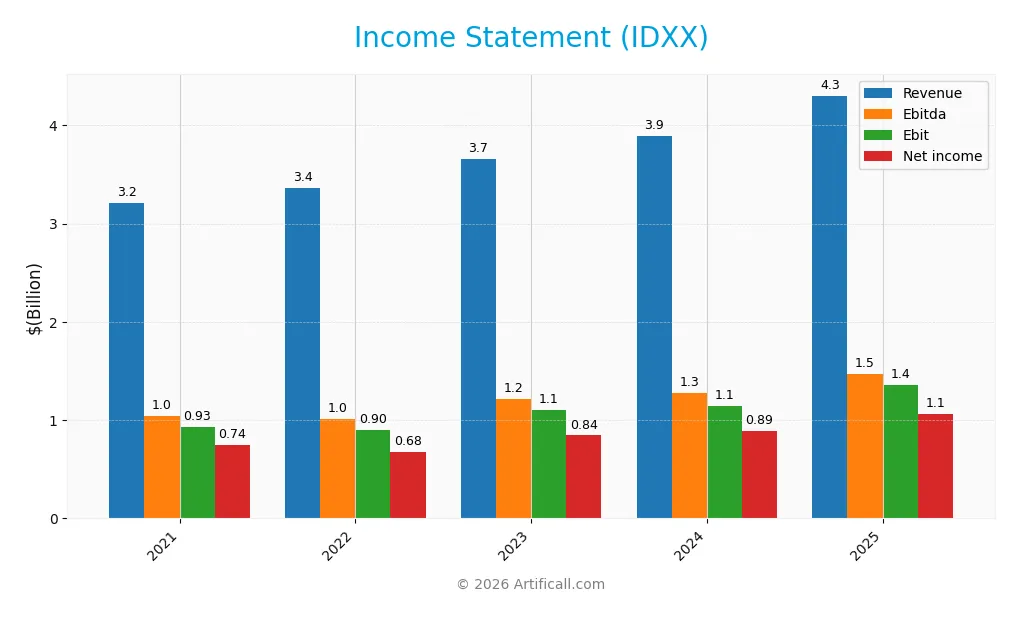
The table below summarizes IDEXX Laboratories, Inc.’s key income statement figures over the past five fiscal years, reflecting its financial performance trends.
| 2021 | 2022 | 2023 | 2024 | 2025 | |
|---|---|---|---|---|---|
| Revenue | 3.22B | 3.37B | 3.66B | 3.90B | 4.30B |
| Cost of Revenue | 1.33B | 1.36B | 1.47B | 1.52B | 1.64B |
| Operating Expenses | 957M | 1.11B | 1.09B | 1.25B | 1.30B |
| Gross Profit | 1.89B | 2.00B | 2.19B | 2.38B | 2.66B |
| EBITDA | 1.04B | 1.01B | 1.22B | 1.28B | 1.47B |
| EBIT | 932M | 900M | 1.10B | 1.14B | 1.36B |
| Interest Expense | 30M | 40M | 42M | 31M | 38M |
| Net Income | 745M | 679M | 845M | 888M | 1.06B |
| EPS | 8.74 | 8.12 | 10.17 | 10.77 | 13.17 |
| Filing Date | 2022-02-16 | 2023-02-16 | 2024-02-22 | 2025-02-21 | 2026-02-20 |
Income Statement Evolution
IDEXX Laboratories’ revenue rose steadily from 3.22B in 2021 to 4.30B in 2025, reflecting a 33.85% growth over five years. Net income increased 42.24% to 1.06B, with net margins improving by 6.27%. Gross and EBIT margins remained consistently strong, indicating stable profitability and efficient cost management throughout the period.
Is the Income Statement Favorable?
In 2025, IDXX reported a gross margin of 61.8% and an EBIT margin of 31.7%, both favorable compared to industry norms. The net margin of 24.6% and controlled interest expense of 0.9% demonstrate solid fundamentals. Revenue and EPS growth exceeded 10% annually, indicating robust operational performance and effective capital allocation in the most recent fiscal year.
Financial Ratios
The following table presents key financial ratios for IDEXX Laboratories, Inc. over the last five fiscal years to facilitate year-over-year analysis:
| Ratios | 2021 | 2022 | 2023 | 2024 | 2025 |
|---|---|---|---|---|---|
| Net Margin | 23.2% | 20.2% | 23.1% | 22.8% | 24.6% |
| ROE | 108.0% | 111.6% | 56.9% | 55.7% | 66.0% |
| ROIC | 41.8% | 32.5% | 32.9% | 33.9% | 40.7% |
| P/E | 75.3 | 50.2 | 54.6 | 38.4 | 51.1 |
| P/B | 81.3 | 56.0 | 31.1 | 21.4 | 33.8 |
| Current Ratio | 1.25 | 0.89 | 1.57 | 1.31 | 1.23 |
| Quick Ratio | 0.90 | 0.59 | 1.17 | 0.95 | 0.90 |
| D/E | 1.49 | 2.41 | 0.72 | 0.62 | 0.53 |
| Debt-to-Assets | 42.3% | 53.5% | 32.7% | 30.0% | 25.3% |
| Interest Coverage | 31.3x | 22.5x | 26.4x | 36.2x | 35.5x |
| Asset Turnover | 1.32 | 1.23 | 1.12 | 1.18 | 1.28 |
| Fixed Asset Turnover | 4.64 | 4.38 | 4.48 | 4.70 | 5.76 |
| Dividend Yield | 0% | 0% | 0% | 0% | 0% |
Evolution of Financial Ratios
From 2021 to 2025, IDEX Laboratories’ Return on Equity (ROE) showed notable variability, peaking above 110% in 2022 before settling near 66% in 2025. The Current Ratio declined from a high of 1.57 in 2023 to about 1.23 in 2025, indicating reduced short-term liquidity. Debt-to-Equity Ratio also decreased significantly from 2.41 in 2022 to 0.53 in 2025, reflecting deleveraging. Profitability margins steadily improved, with net margin rising from 20.17% in 2022 to 24.62% in 2025.
Are the Financial Ratios Favorable?
In 2025, IDEX Laboratories displays strong profitability, with ROE at 65.99% and ROIC at 40.68%, both well above typical market benchmarks. Liquidity ratios like Current and Quick Ratios remain neutral, suggesting adequate but not excessive liquidity. Leverage metrics show moderate debt levels, with a favorable debt-to-assets ratio of 25.3%. Market valuation ratios such as P/E (51.15) and P/B (33.75) are high, flagged as unfavorable. Overall, about half the ratios are favorable, with the rest neutral or unfavorable, implying a slightly favorable financial profile.
Shareholder Return Policy
IDEXX Laboratories, Inc. does not pay dividends, reflecting a strategic choice to reinvest earnings. The company maintains positive net income and strong free cash flow, supporting internal growth and innovation without income distribution.
IDEXX does not engage in share buybacks either, signaling a focus on long-term investments over immediate shareholder payouts. This approach aligns with sustaining shareholder value through growth rather than direct capital returns.
Score analysis
The radar chart below shows the company’s key financial scores across multiple valuation and performance metrics:
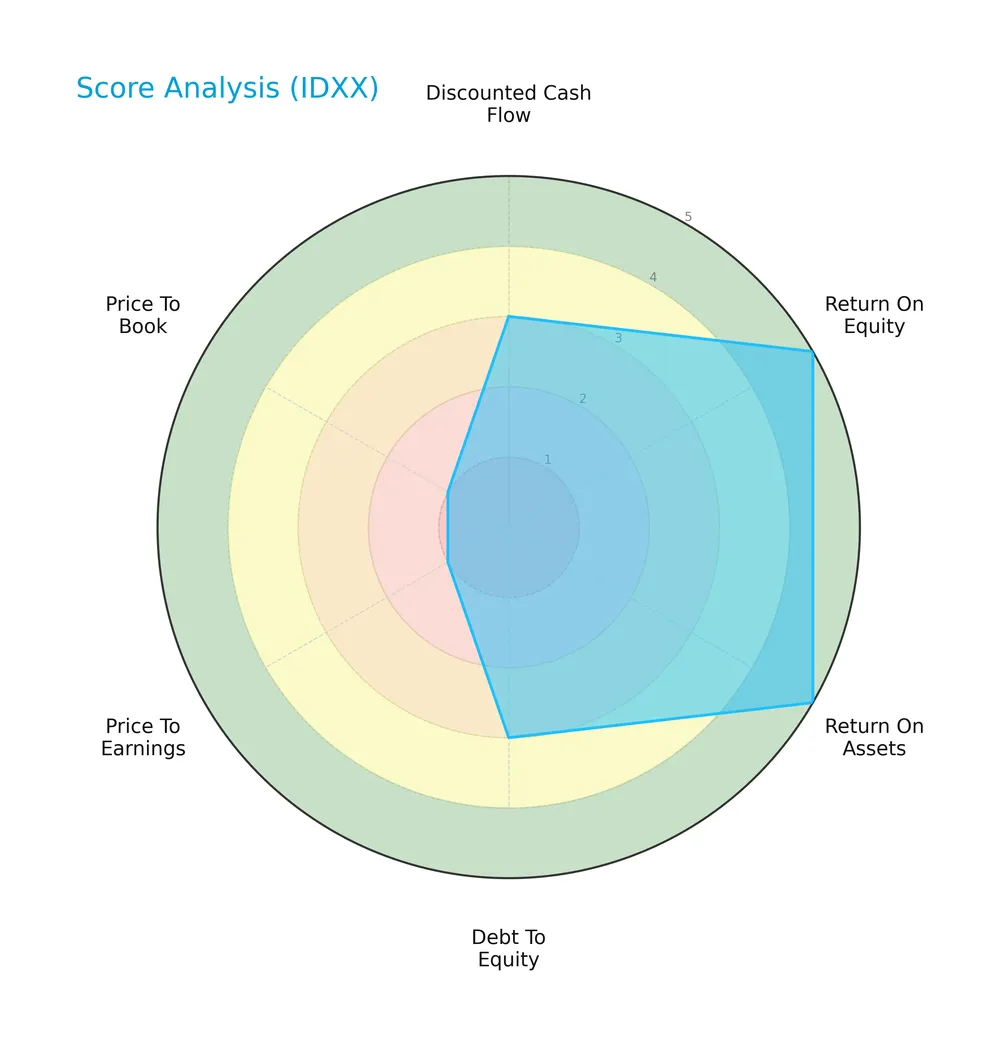
IDEXX Laboratories scores very favorably on return on equity (5) and return on assets (5), indicating strong profitability. Its discounted cash flow score is moderate (3). However, debt-to-equity (2), price-to-earnings (1), and price-to-book (1) scores reveal weaknesses in leverage and valuation metrics.
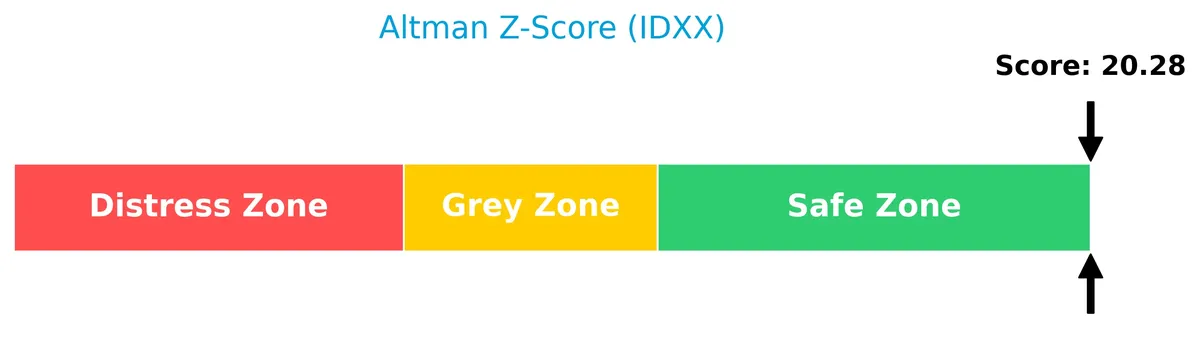
Analysis of the company’s bankruptcy risk
The Altman Z-Score places IDEXX Laboratories firmly in the safe zone, signaling a very low bankruptcy risk:
Is the company in good financial health?
The Piotroski Score diagram illustrates IDEXX Laboratories’ financial strength based on nine key criteria:
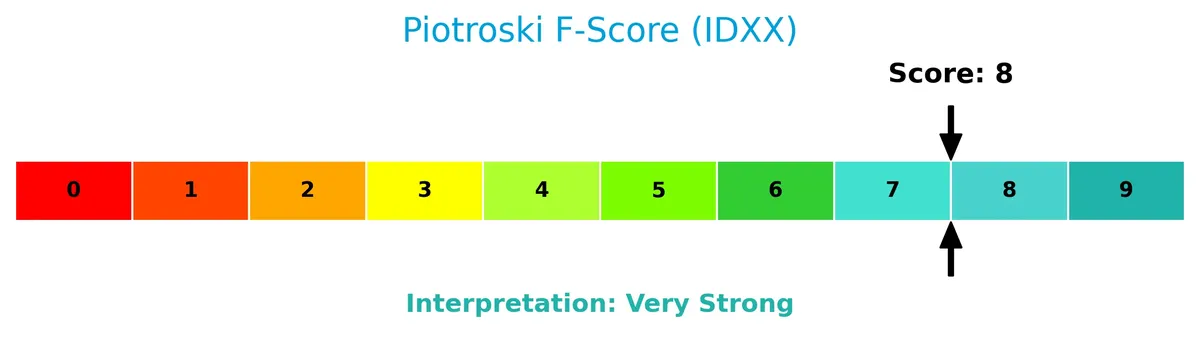
With a very strong score of 8, IDEXX Laboratories demonstrates robust financial health and operational efficiency, positioning it well among peers on fundamental metrics.
Competitive Landscape & Sector Positioning
This section examines IDEXX Laboratories’ strategic positioning, revenue breakdown, key products, and main competitors. I will analyze whether IDEXX holds a competitive advantage within the medical diagnostics sector.
Strategic Positioning
IDEXX Laboratories maintains a diversified product portfolio spanning veterinary diagnostics, water testing, and biomedical research, with revenue split roughly 59% products and 41% services in 2025. Geographically, it concentrates in the U.S. (about 60% of 2025 revenue) but steadily expands in EMEA and Asia Pacific regions.
Revenue by Segment
This pie chart illustrates IDEXX Laboratories’ revenue breakdown by segment for the fiscal year 2025, highlighting the contributions of Product and Service lines.
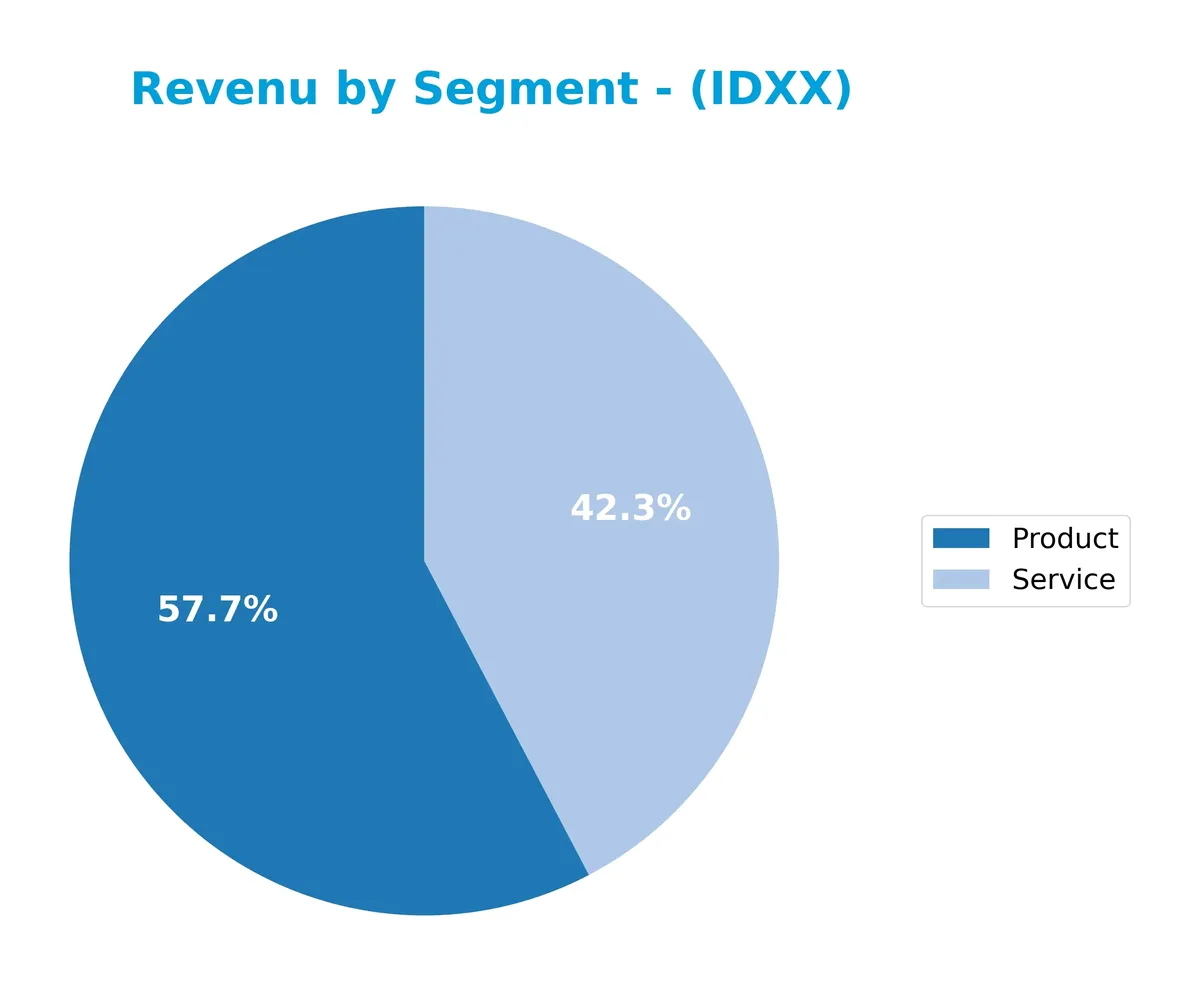
In 2025, Product revenue leads with $2.5B, followed by Services at $1.76B. Both segments show steady growth since 2023, reflecting strong demand and effective capital allocation. The Product segment drives expansion, while Services provide consistent recurring income. This balanced mix reduces concentration risk and supports sustainable growth. The acceleration from 2024 to 2025 signals robust operational execution amid sector cyclicality.
Key Products & Brands
IDEXX Laboratories offers a diverse portfolio of diagnostic products and services for veterinary and water testing markets:
| Product | Description |
|---|---|
| Point-of-Care Veterinary Diagnostics | Instruments, consumables, and rapid assay test kits for companion animals, including SNAP rapid assays. |
| Veterinary Reference Laboratory Services | Diagnostic and consulting services supporting veterinarians with laboratory testing and analysis. |
| Practice Management and Imaging Systems | Software and diagnostic imaging solutions for veterinary clinics. |
| Livestock, Poultry, and Dairy Diagnostics | Diagnostic and health-monitoring products designed for farm animals. |
| Water Quality Testing Products | Tests such as Colilert, Colilert-18, and Colisure to detect coliforms and E. coli in water. |
| Human Point-of-Care Medical Diagnostics | Electrolytes, blood gas analyzers, and SARS-CoV-2 RT-PCR tests used in human healthcare settings. |
| Veterinary Software and Services | Practice management software and services for independent clinics and corporate veterinary groups. |
IDEXX’s product mix spans cutting-edge diagnostics and software solutions targeting companion animals, livestock, and environmental testing. This breadth supports steady revenue growth and diversification.
Main Competitors
In total, 11 competitors operate in the sector. The table below shows the top 10 leaders by market capitalization:
| Competitor | Market Cap. |
|---|---|
| Thermo Fisher Scientific Inc. | 225B |
| Danaher Corporation | 165B |
| IDEXX Laboratories, Inc. | 53.5B |
| Agilent Technologies, Inc. | 39.1B |
| IQVIA Holdings Inc. | 38.4B |
| Mettler-Toledo International Inc. | 28.8B |
| Waters Corporation | 22.7B |
| Quest Diagnostics Incorporated | 19.4B |
| Revvity, Inc. | 11.6B |
| Charles River Laboratories International, Inc. | 10.0B |
IDEXX Laboratories ranks 3rd among 11 competitors. Its market cap equals 22.6% of the sector leader’s value. The company sits below the average market cap of the top 10 (61.3B) but above the sector median (28.8B). The gap to the next competitor above exceeds 225%, highlighting a significant scale difference with its closest rival.
Comparisons with competitors
Check out how we compare the company to its competitors:
Does IDEXX have a competitive advantage?
IDEXX demonstrates a competitive advantage by consistently creating value through a ROIC 29.3% above its WACC, indicating efficient capital use and strong profitability. However, its slightly declining ROIC trend signals caution regarding sustained profitability.
Looking ahead, IDEXX benefits from expansion across veterinary diagnostics, water quality testing, and biomedical research markets. Continued innovation in point-of-care products and global geographic growth present opportunities to reinforce its market position.
SWOT Analysis
This analysis highlights IDEXX Laboratories’ internal strengths and weaknesses alongside external opportunities and threats to guide strategic decisions.
Strengths
- Strong profitability with 25%+ net margin
- High ROE at 66% signaling efficient capital use
- Diverse product portfolio in veterinary and water testing
Weaknesses
- High valuation multiples with P/E over 50
- Declining ROIC trend warns of slipping operational efficiency
- Moderate liquidity ratios limit short-term flexibility
Opportunities
- Expanding global veterinary diagnostics market
- Growth potential in emerging regions like Asia Pacific
- Innovation in rapid and point-of-care diagnostic technology
Threats
- Competitive pressure from other diagnostics firms
- Regulatory risks in healthcare and environmental testing
- Economic downturns affecting veterinary spending
IDEXX’s robust profitability and wide product range build a solid competitive moat. However, stretched valuation and declining ROIC require caution. The company should leverage geographic expansion and innovation while managing regulatory and market risks.
Stock Price Action Analysis
The following weekly chart illustrates IDEXX Laboratories, Inc. (IDXX) stock price movements over the past 100 weeks, highlighting key highs and lows:
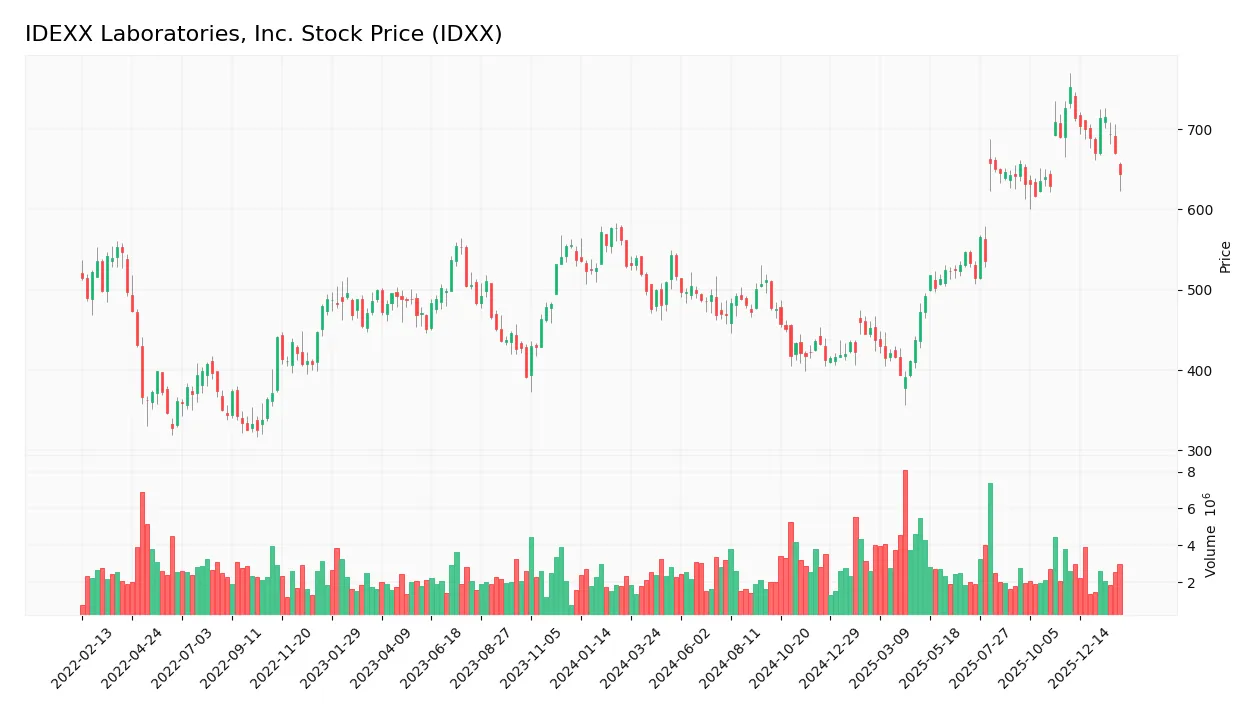
Trend Analysis
Over the past 12 months, IDXX gained 17.73%, indicating a bullish trend with decelerating momentum. The stock peaked at 752.88 and bottomed at 390.94. Despite high volatility (std dev 97.83), recent months show a negative slope of -6.79 and a -10.98% decline, signaling a short-term pullback within the broader uptrend.
Volume Analysis
Trading volume for IDXX is increasing overall, with 325M shares exchanged, split nearly evenly between buyers (49%) and sellers (51%). However, the recent period shows a seller-dominant pattern, with buyers representing only 21% of volume. This suggests cautious investor sentiment and heightened selling pressure since December 2025.
Target Prices
Analysts set a strong target consensus for IDEXX Laboratories, signaling bullish expectations.
| Target Low | Target High | Consensus |
|---|---|---|
| 730 | 830 | 784.38 |
The target range from 730 to 830 indicates confidence in IDXX’s growth potential. The consensus near 784 reflects solid optimism among reputable analysts.

Don’t Let Luck Decide Your Entry Point
Optimize your entry points with our advanced ProRealTime indicators. You’ll get efficient buy signals with precise price targets for maximum performance. Start outperforming now!
Analyst & Consumer Opinions
This section reviews analyst ratings and consumer feedback to provide balanced insights on IDEXX Laboratories, Inc. (IDXX).
Stock Grades
Here are the latest verified grades for IDEXX Laboratories, Inc. from established financial institutions:
| Grading Company | Action | New Grade | Date |
|---|---|---|---|
| Piper Sandler | Maintain | Neutral | 2026-02-09 |
| Barclays | Maintain | Overweight | 2026-02-05 |
| BTIG | Maintain | Buy | 2026-02-03 |
| UBS | Maintain | Neutral | 2026-02-03 |
| BTIG | Maintain | Buy | 2025-11-04 |
| JP Morgan | Maintain | Overweight | 2025-11-04 |
| UBS | Maintain | Neutral | 2025-11-04 |
| Morgan Stanley | Maintain | Overweight | 2025-11-04 |
| Stifel | Upgrade | Buy | 2025-10-31 |
| Morgan Stanley | Maintain | Overweight | 2025-08-15 |
The consensus across major analysts leans toward a buy stance, with consistent overweight and buy ratings. Neutral grades persist but no downgrades indicate steady confidence in the stock’s outlook.
Consumer Opinions
IDEXX Laboratories consistently earns praise for its innovative diagnostics, yet some customers express concerns about pricing and service responsiveness.
| Positive Reviews | Negative Reviews |
|---|---|
| “IDEXX’s diagnostic tools are industry-leading and reliable.” | “Customer support can be slow during peak times.” |
| “Their technology significantly improves workflow efficiency.” | “Some products feel overpriced compared to competitors.” |
| “The accuracy of test results gives us confidence in treatment decisions.” | “Occasional delays in product delivery disrupt schedules.” |
Overall, consumers applaud IDEXX’s technological edge and accuracy. However, pricing and service delays emerge as consistent pain points that could impact long-term loyalty.
Risk Analysis
Below is a summary of key risk factors affecting IDEXX Laboratories, Inc., categorized by likelihood and potential impact:
| Category | Description | Probability | Impact |
|---|---|---|---|
| Valuation Risk | Extremely high P/E (51.15) and P/B (33.75) ratios suggest overvaluation. | High | High |
| Market Volatility | Beta of 1.66 indicates above-average sensitivity to market swings. | High | Medium |
| Liquidity Risk | Current ratio of 1.23 and quick ratio of 0.9 show moderate short-term risk. | Medium | Medium |
| Debt Risk | Moderate debt-to-equity ratio (0.53) with strong interest coverage (35.61). | Low | Low |
| Dividend Risk | No dividend payout may deter income-focused investors. | Medium | Low |
| Sector-Specific Risk | Exposure to regulatory changes in medical diagnostics and veterinary markets. | Medium | High |
I emphasize valuation risk as the most pressing concern. IDEXX’s P/E and P/B multiples far exceed healthcare sector averages, raising concerns about price sustainability. Its beta of 1.66 also signals vulnerability during market downturns. Fortunately, liquidity and debt metrics are stable, reflecting prudent capital management. Still, regulatory shifts in diagnostics and veterinary markets could materially affect revenue streams. Investors should weigh these risks carefully against IDEXX’s strong profitability and financial health.
Should You Buy IDEX Laboratories, Inc.?
IDEXX Laboratories appears to be a profitable company with strong operational efficiency and a durable competitive moat, despite a slight decline in ROIC. Its leverage profile seems manageable, supporting a very favorable overall B rating, though valuation metrics suggest caution.
Strength & Efficiency Pillars
IDEXX Laboratories, Inc. demonstrates robust profitability with a net margin of 24.62% and an impressive return on equity (ROE) of 65.99%. The company achieves a return on invested capital (ROIC) of 40.68%, significantly exceeding its weighted average cost of capital (WACC) at 11.36%, confirming its status as a clear value creator. Operational efficiency is strong, supported by favorable gross and EBIT margins of 61.8% and 31.66%, respectively, reflecting disciplined capital allocation and sustainable competitive advantages.
Weaknesses and Drawbacks
Despite operational strengths, valuation metrics pose concerns. The price-to-earnings (P/E) ratio stands at 51.15, signaling a steep premium relative to earnings, while the price-to-book (P/B) ratio of 33.75 suggests the market prices the company well above its book value. These elevated multiples increase vulnerability to market corrections. Additionally, the current ratio of 1.23 and quick ratio of 0.9 indicate only moderate liquidity buffers. Recent seller dominance (buyer share 21.28%) creates near-term headwinds, reflecting potential profit-taking or market skepticism.
Our Final Verdict about IDEXX Laboratories, Inc.
The company’s fundamental profile remains strong, marked by solid profitability and value creation. However, despite a bullish long-term trend, recent market pressure and elevated valuation multiples suggest a cautious stance. IDEXX may appear attractive for long-term exposure but might warrant a wait-and-see approach to mitigate near-term volatility and capture a more favorable entry point.
Disclaimer: This content is for informational purposes only and does not constitute financial, investment, or other professional advice. Investing in financial markets involves a significant risk of loss, and past performance is not indicative of future results.
Additional Resources
- Decoding IDEXX Laboratories Inc (IDXX): A Strategic SWOT Insight – GuruFocus (Feb 21, 2026)
- Raiffeisen Bank International AG Has $35.07 Million Stock Holdings in IDEXX Laboratories, Inc. $IDXX – MarketBeat (Feb 21, 2026)
- Here’s Why IDEXX Laboratories (IDXX) Shares are Re-Rating to Historical Average – Yahoo Finance (Feb 20, 2026)
- Here’s Why IDEXX Laboratories (IDXX) Shares are Re-Rating to Historical Average – Insider Monkey (Feb 20, 2026)
- Idexx Laboratories: A New Opportunity in Pet Health Investment – Intellectia AI (Feb 20, 2026)
For more information about IDEXX Laboratories, Inc., please visit the official website: idexx.com